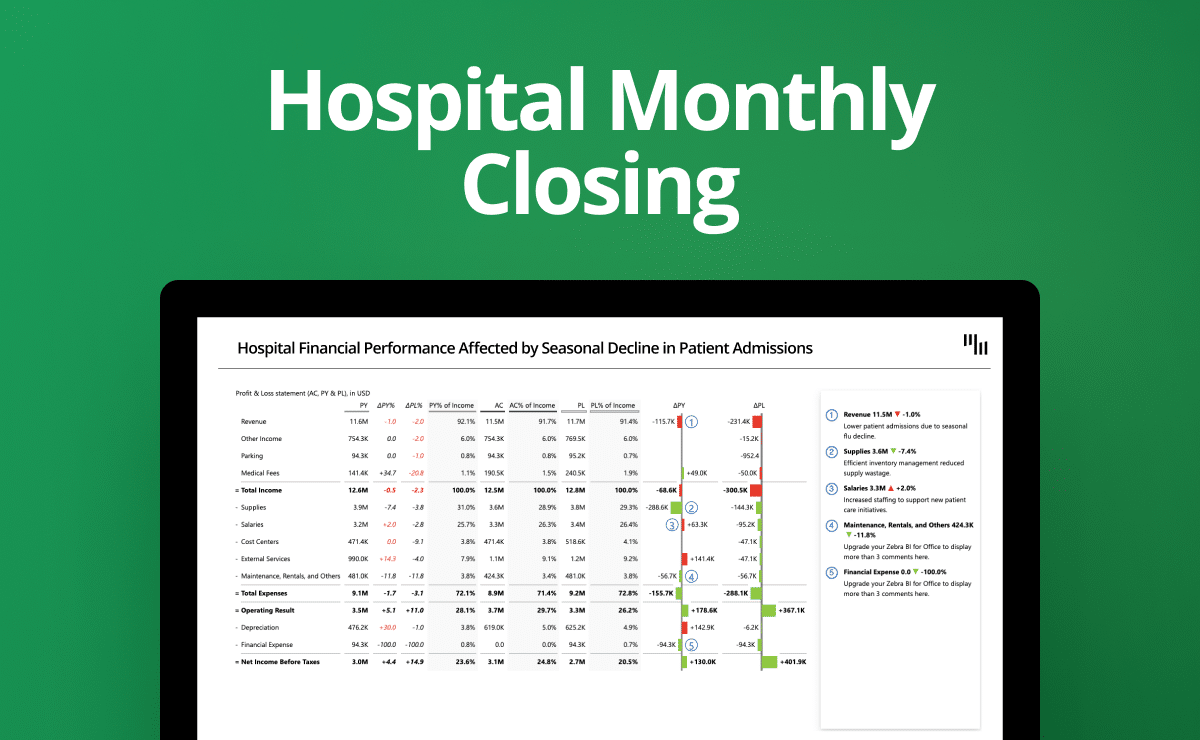
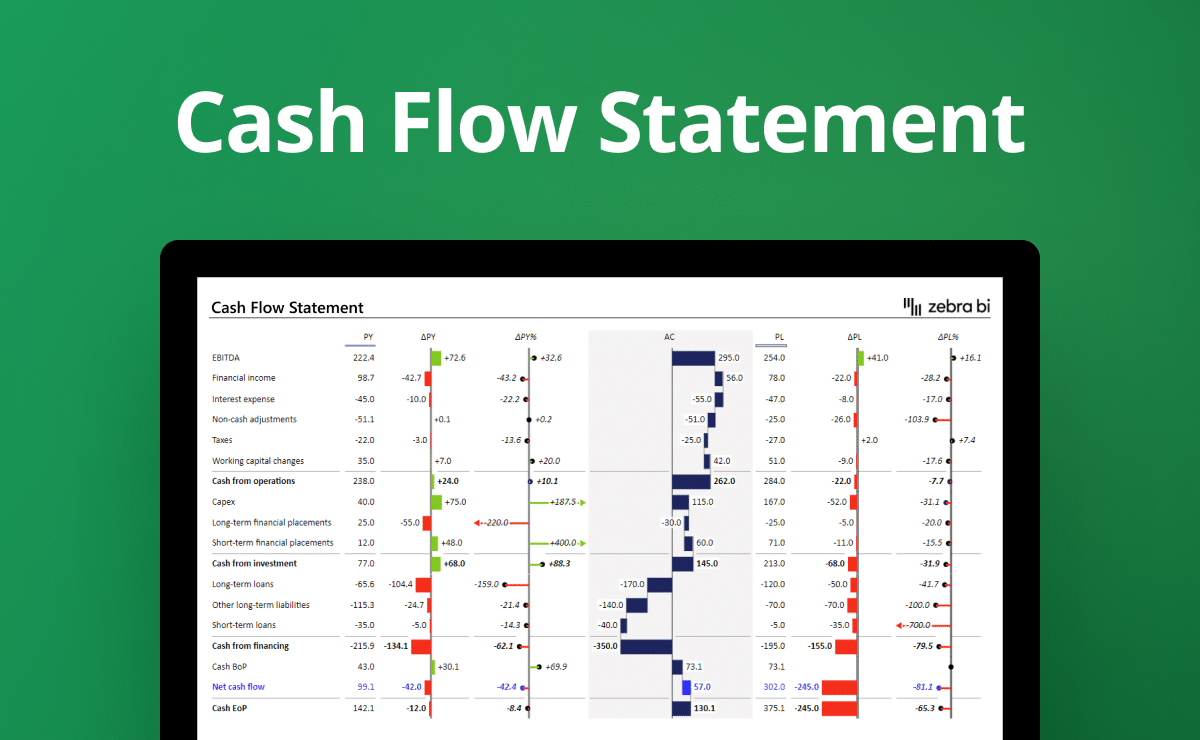
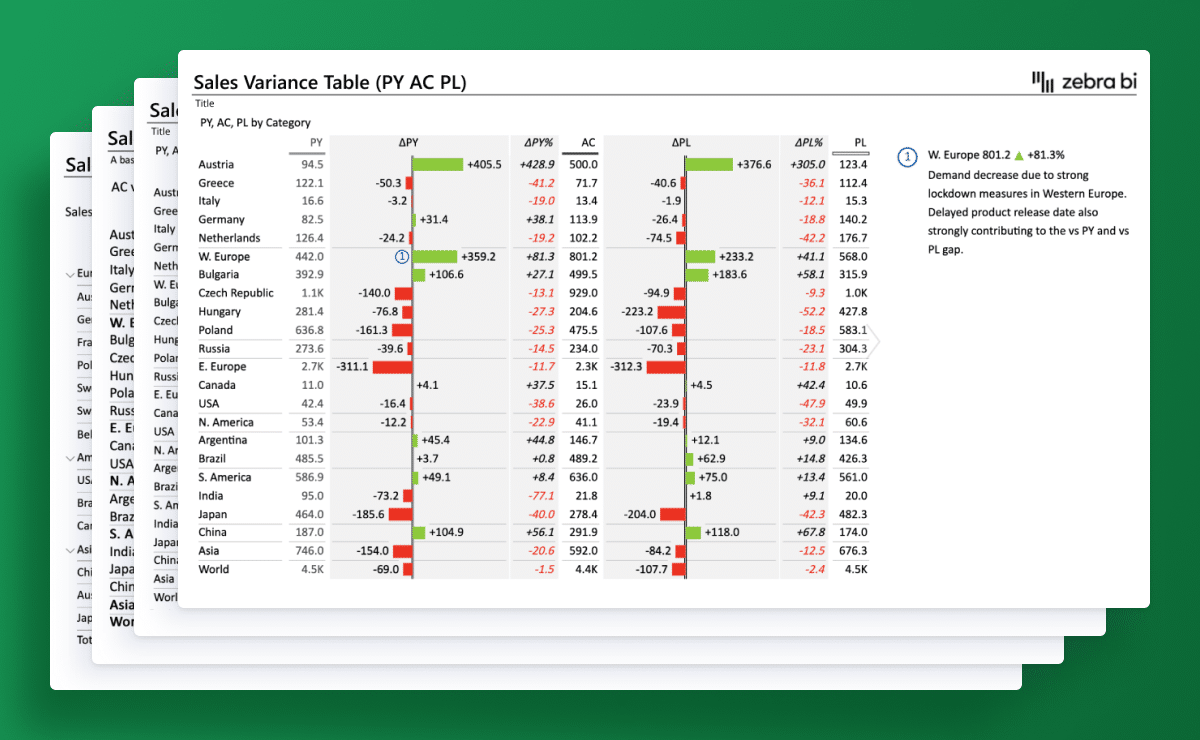
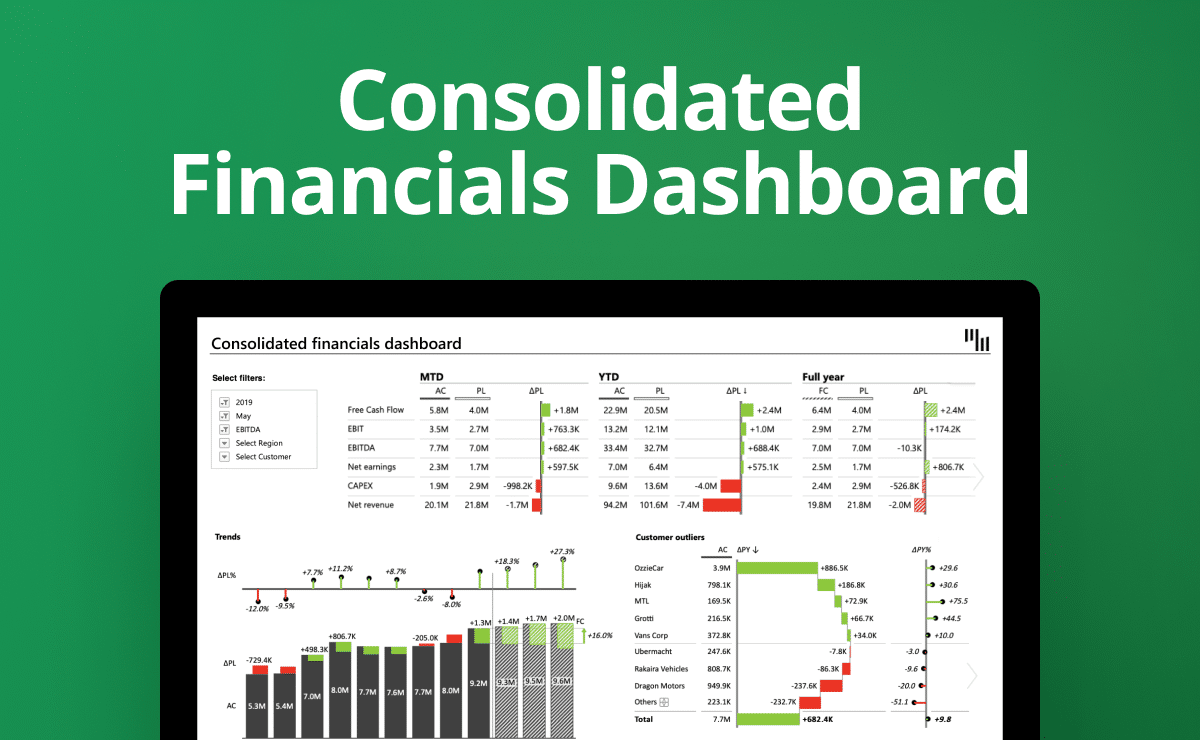
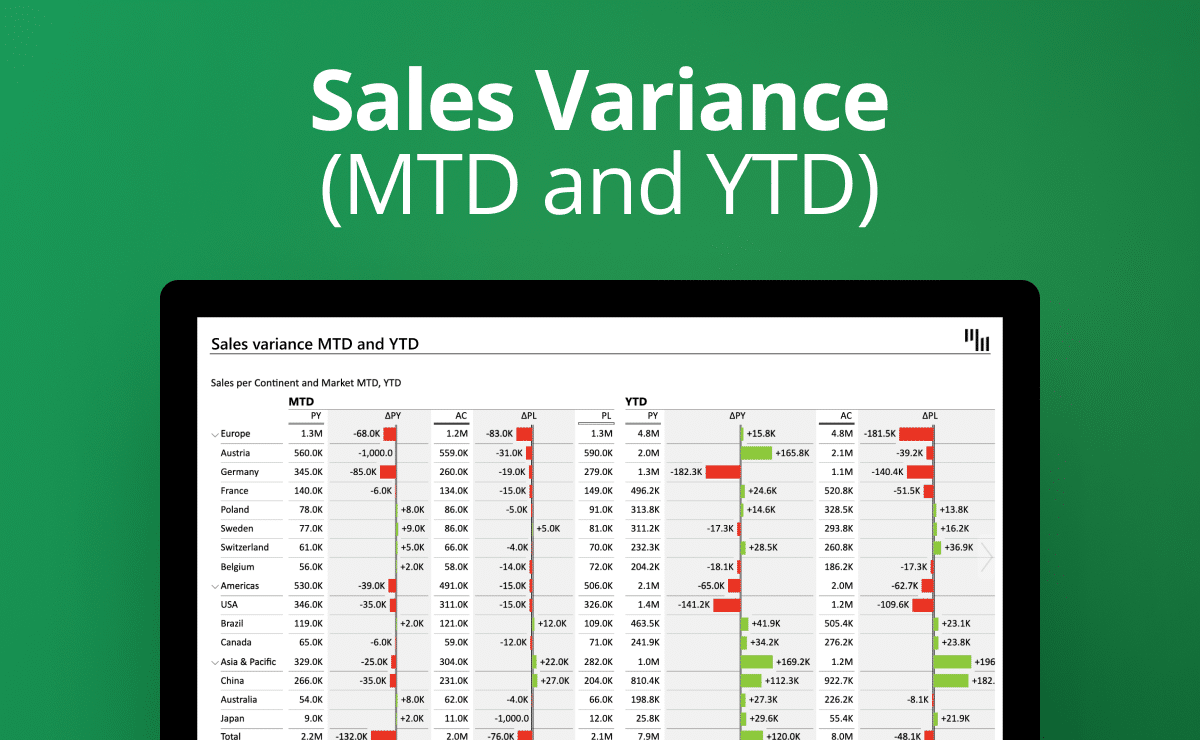
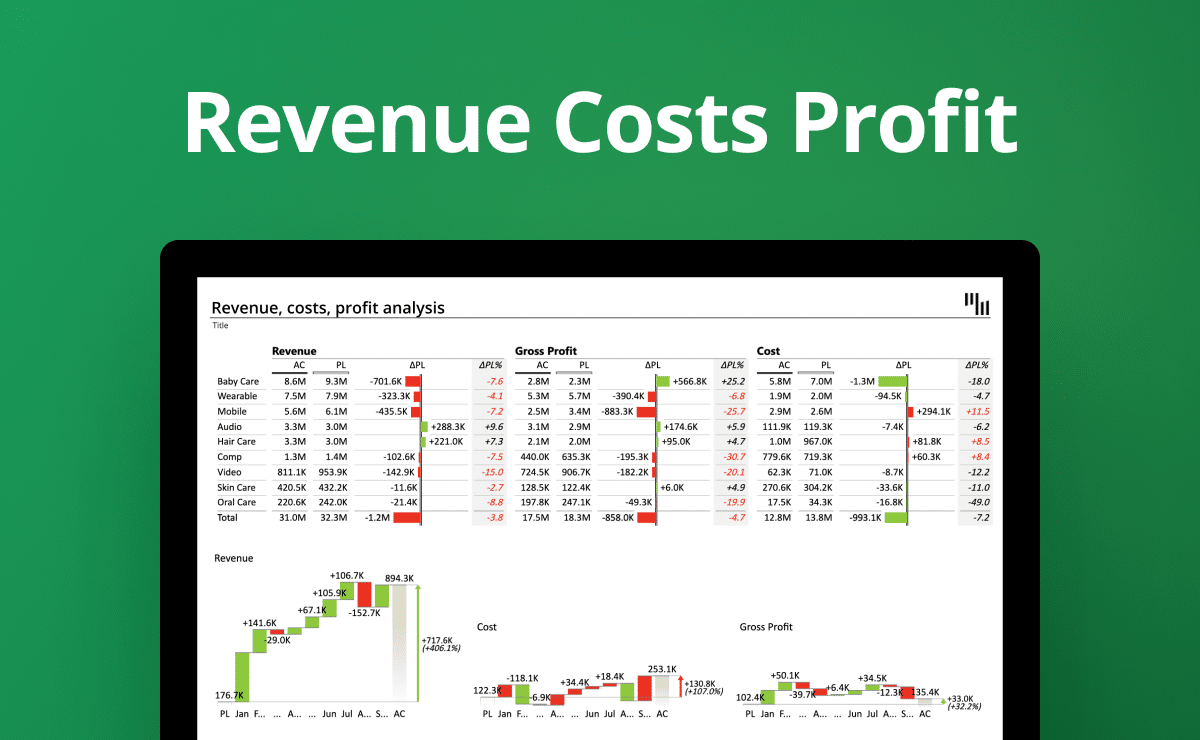
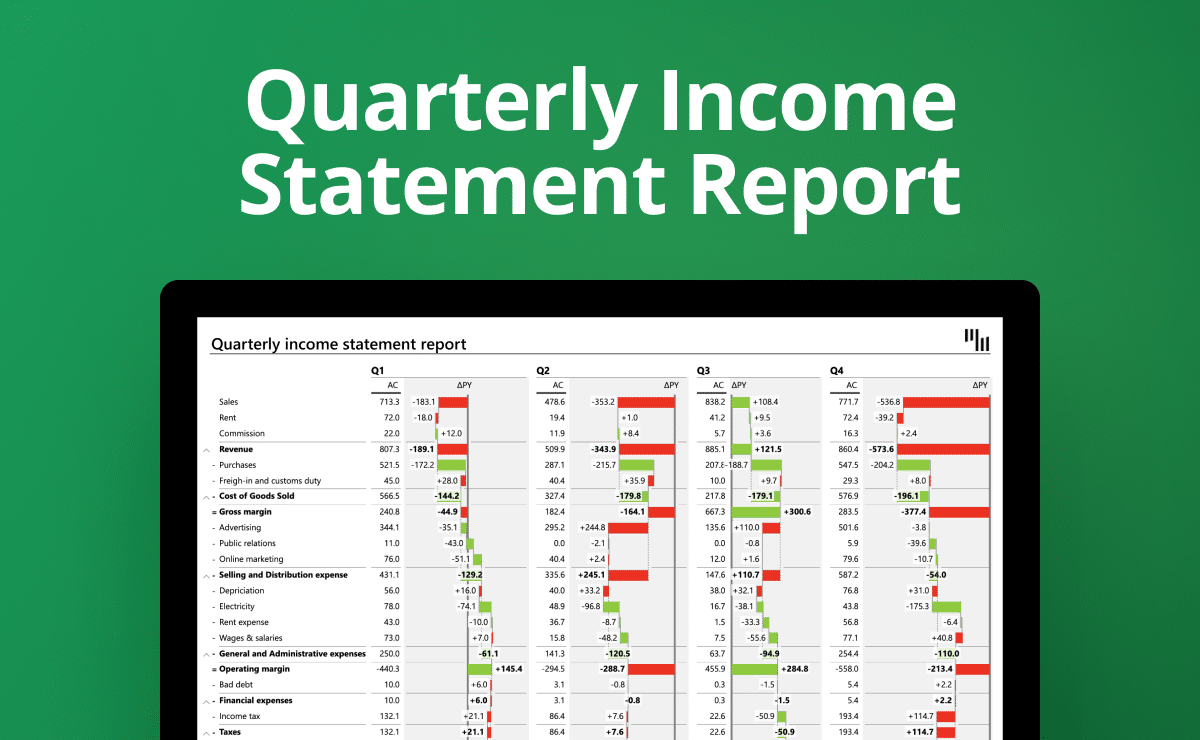
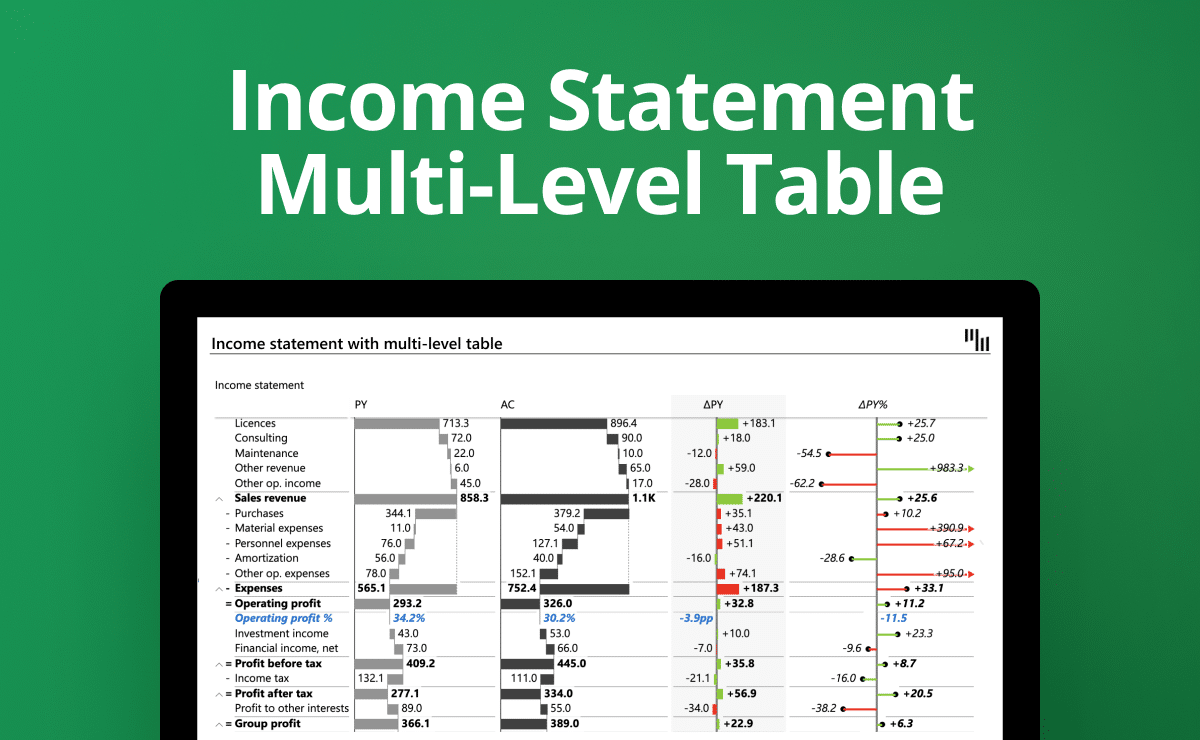
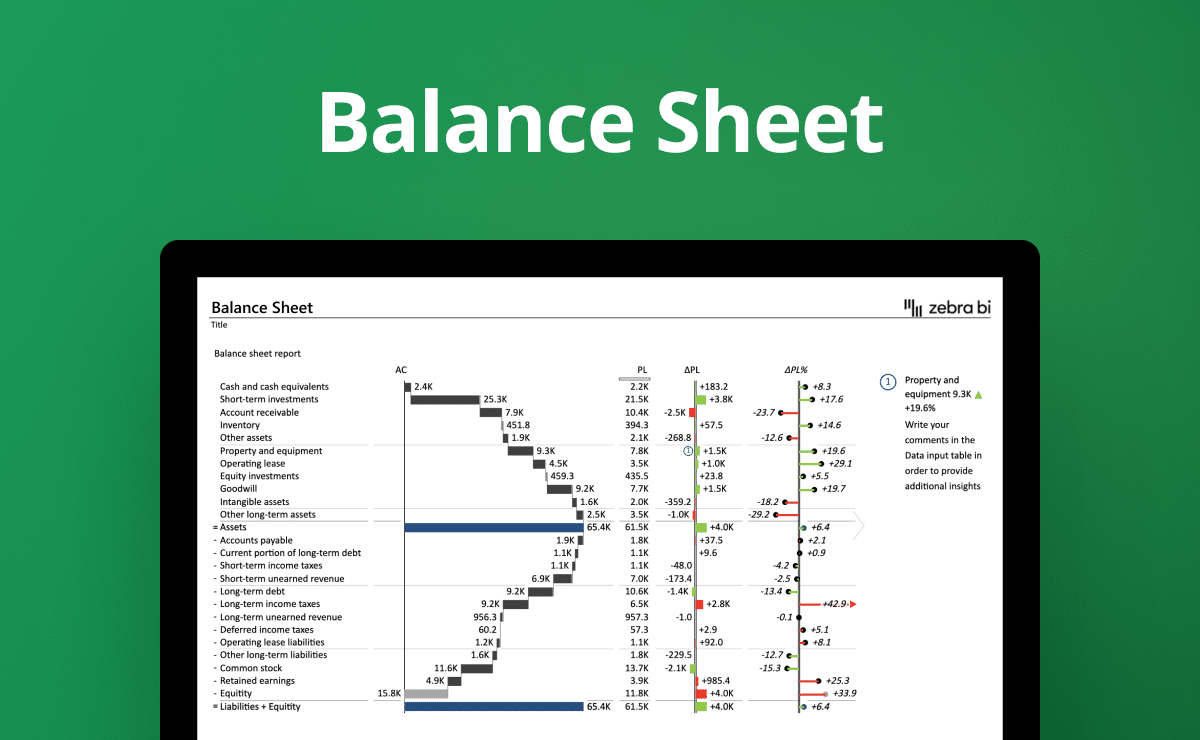
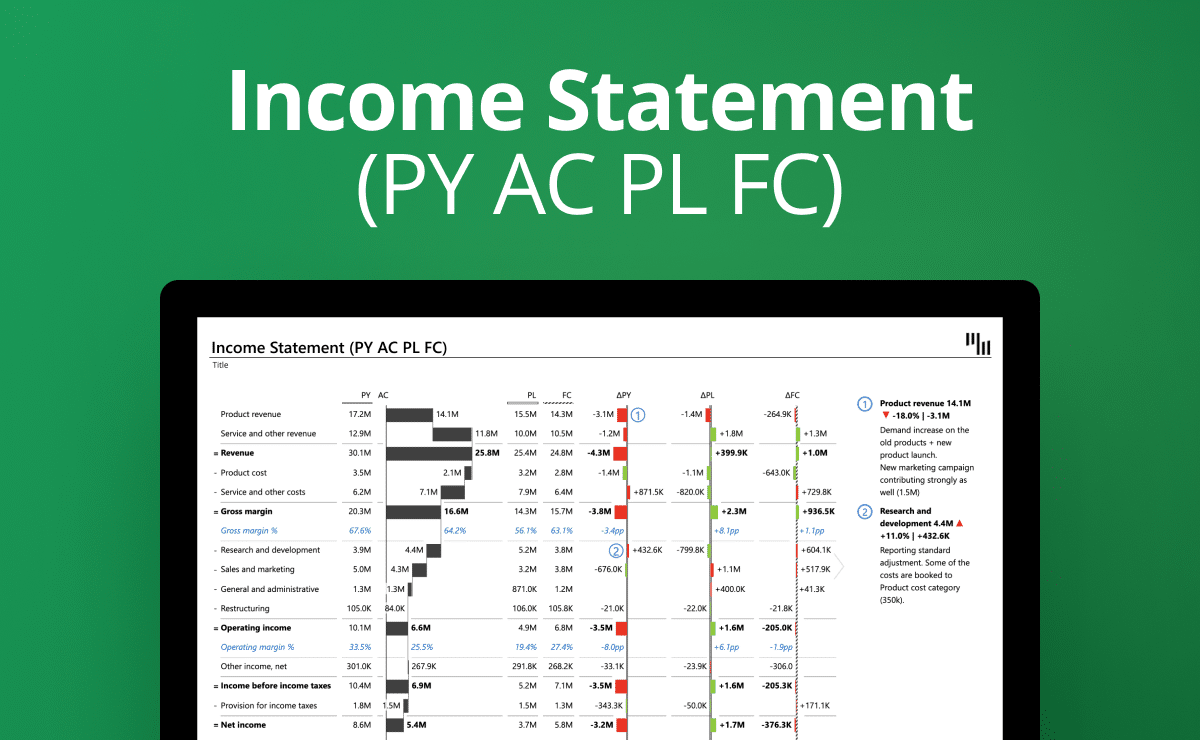
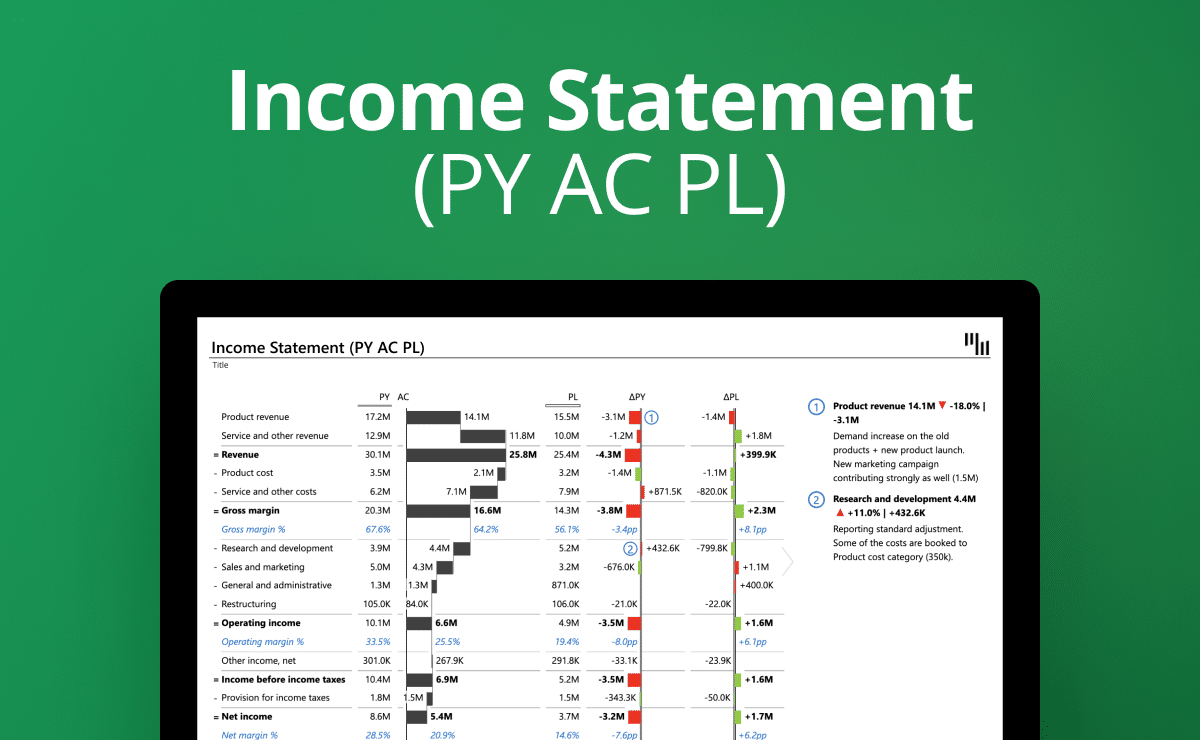
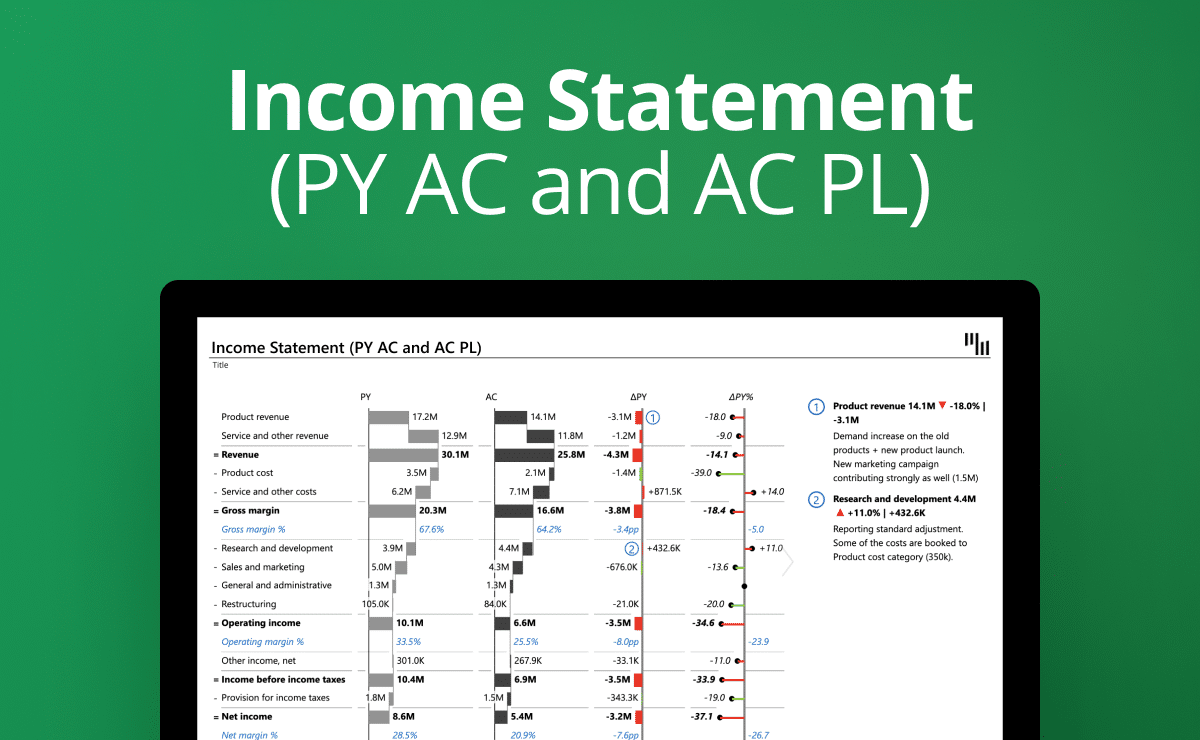
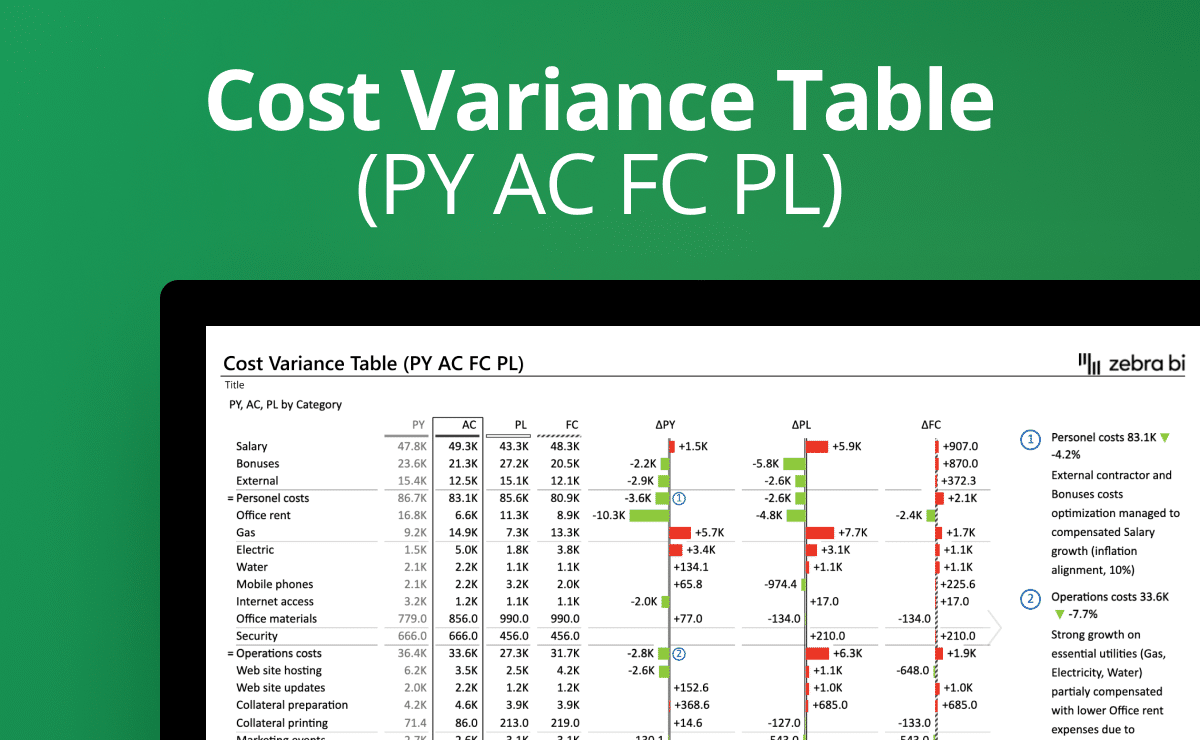
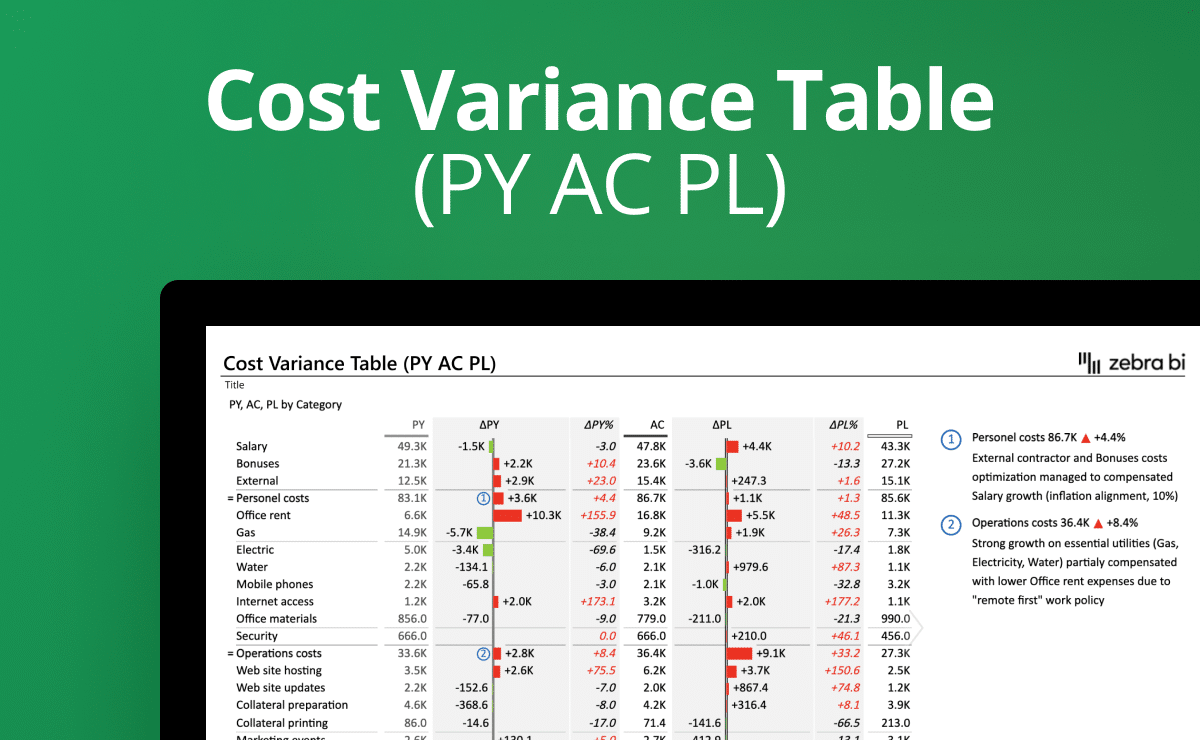
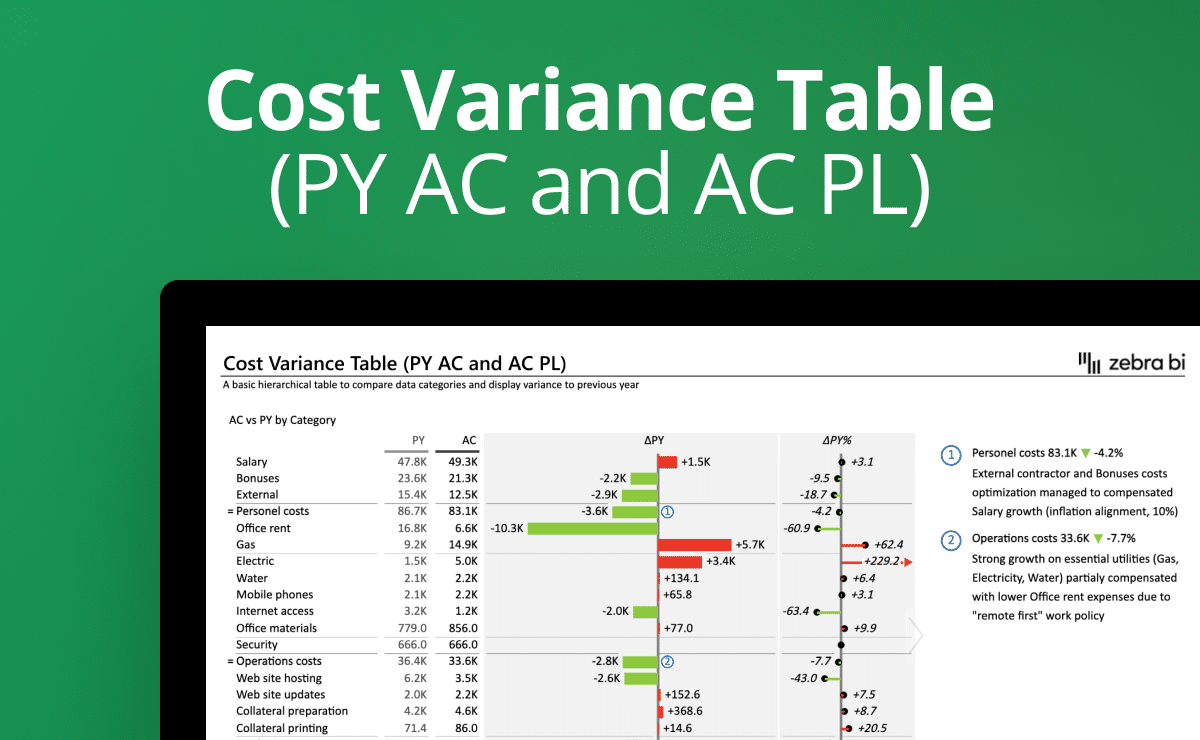
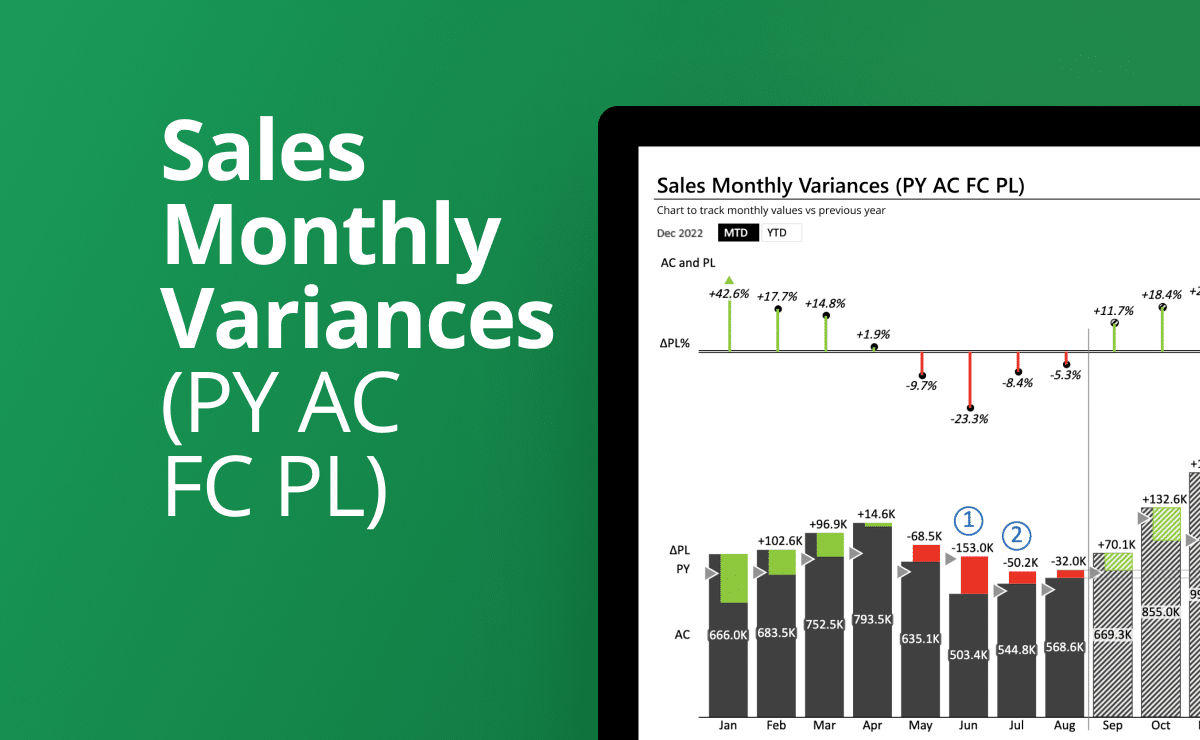
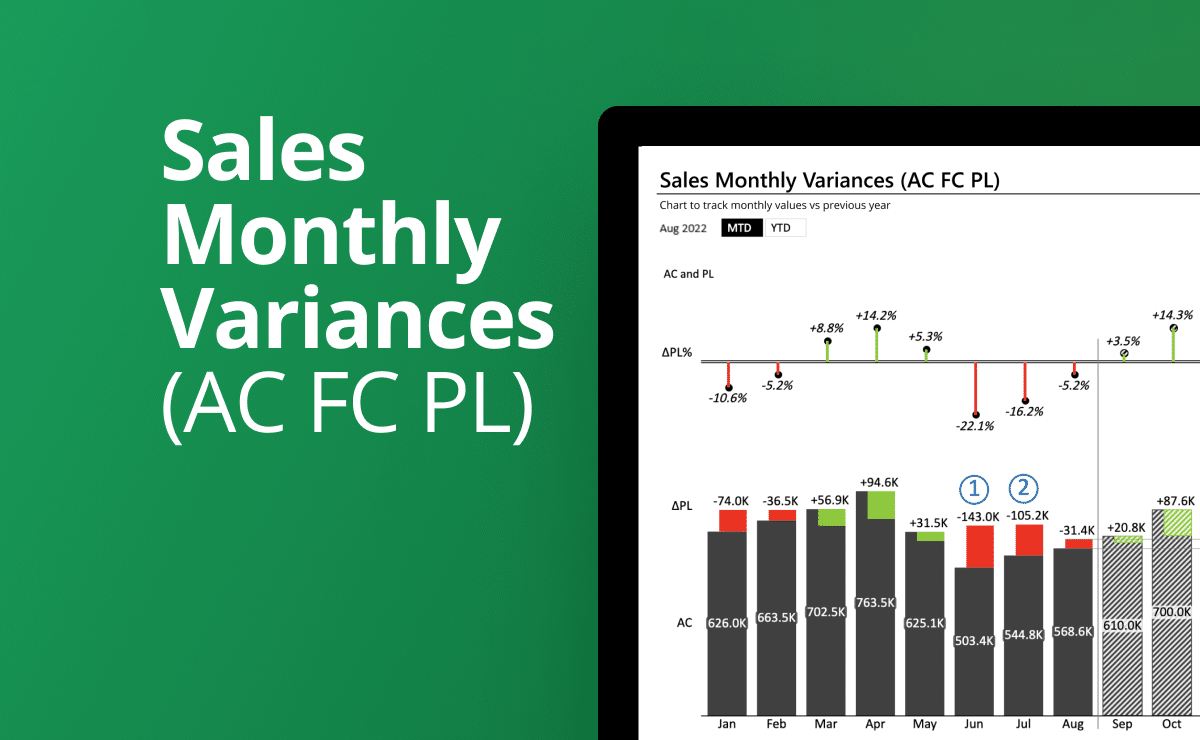
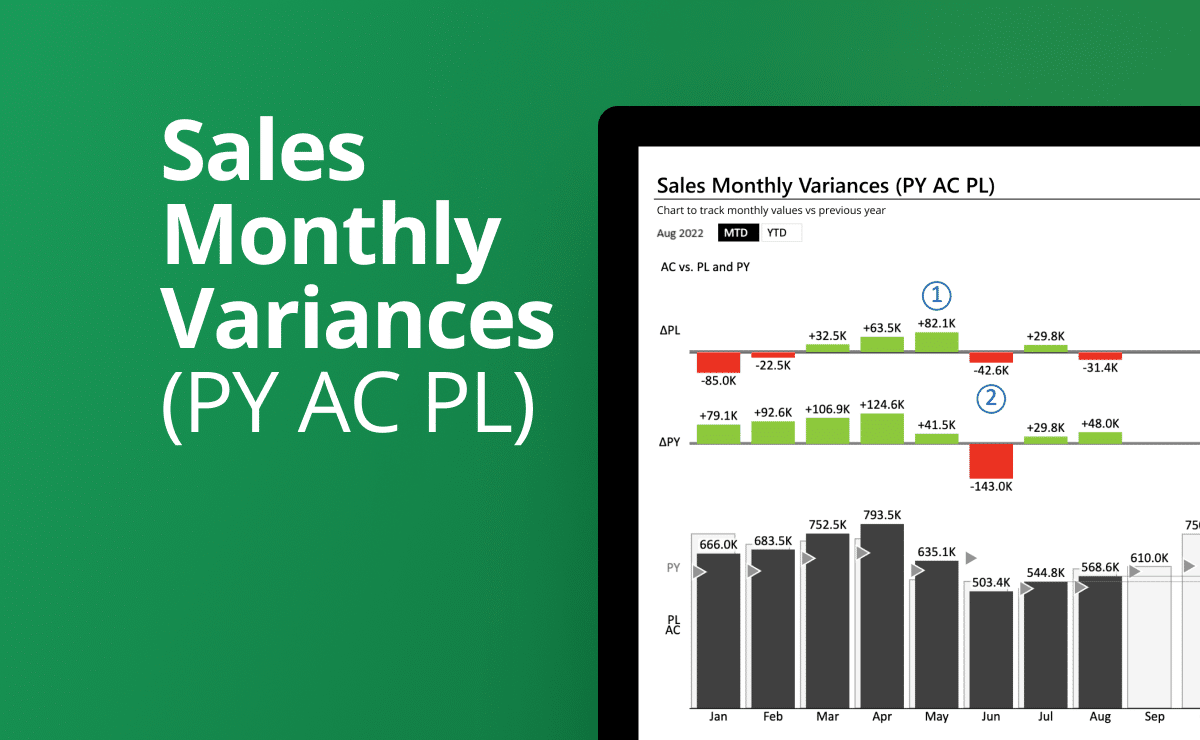
Display different costs with absolute and relative variances. Compare your actual values (AC) with previous year's (PY) and plan (PL) in the same table and add dynamic comments for more context.
Features used
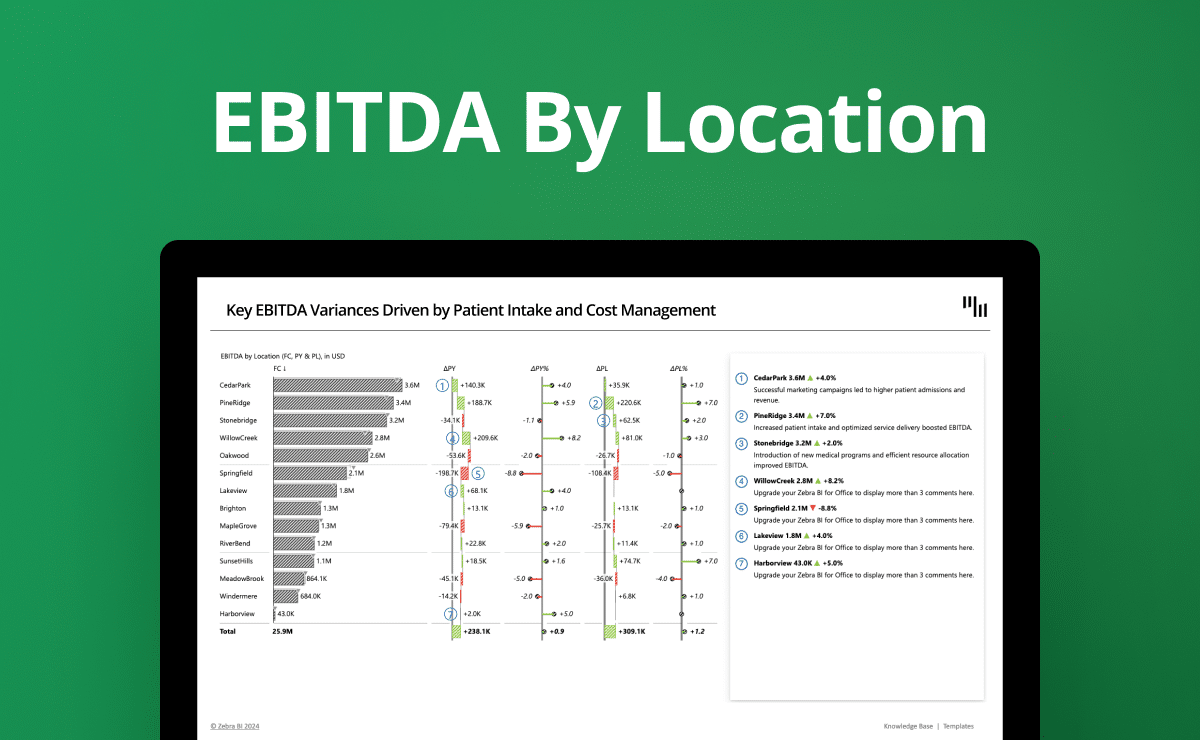
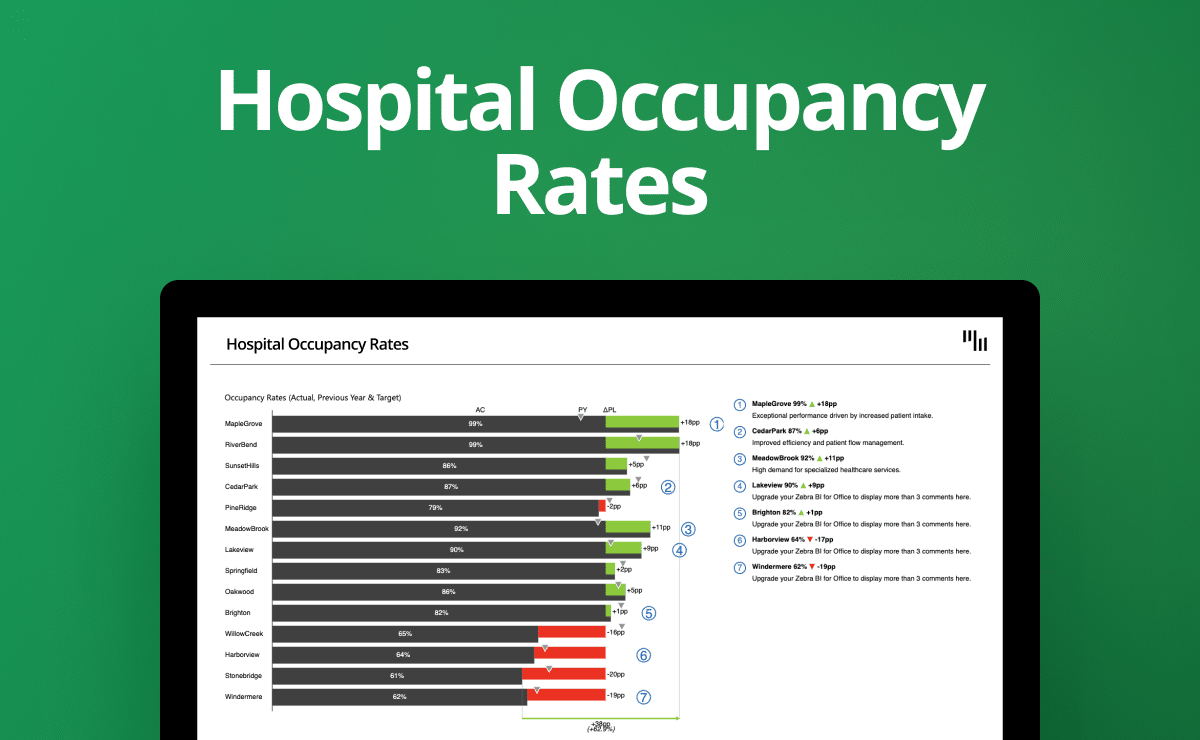
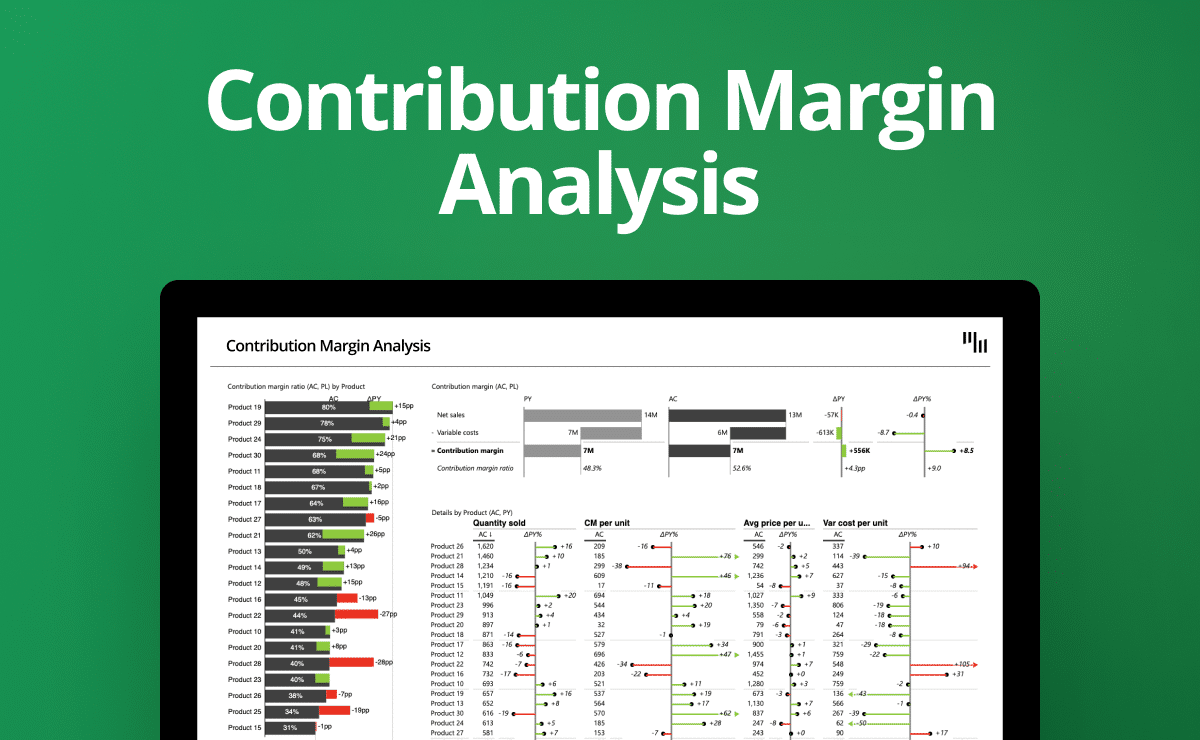
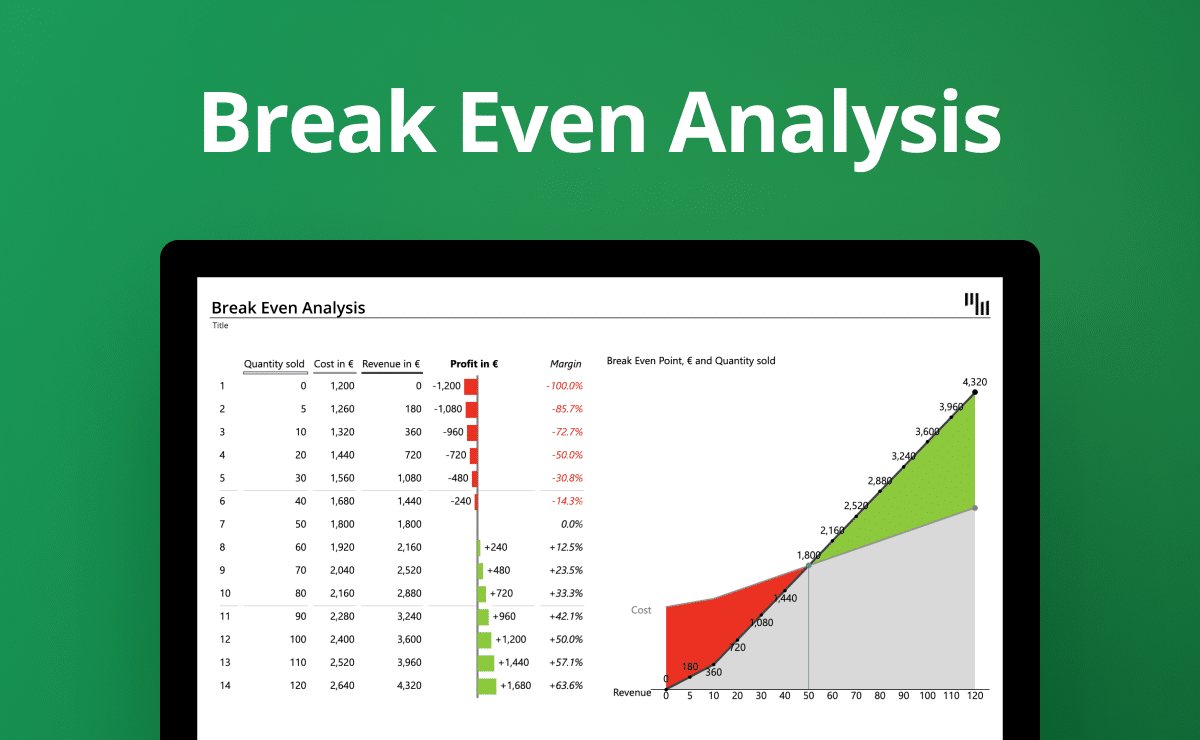
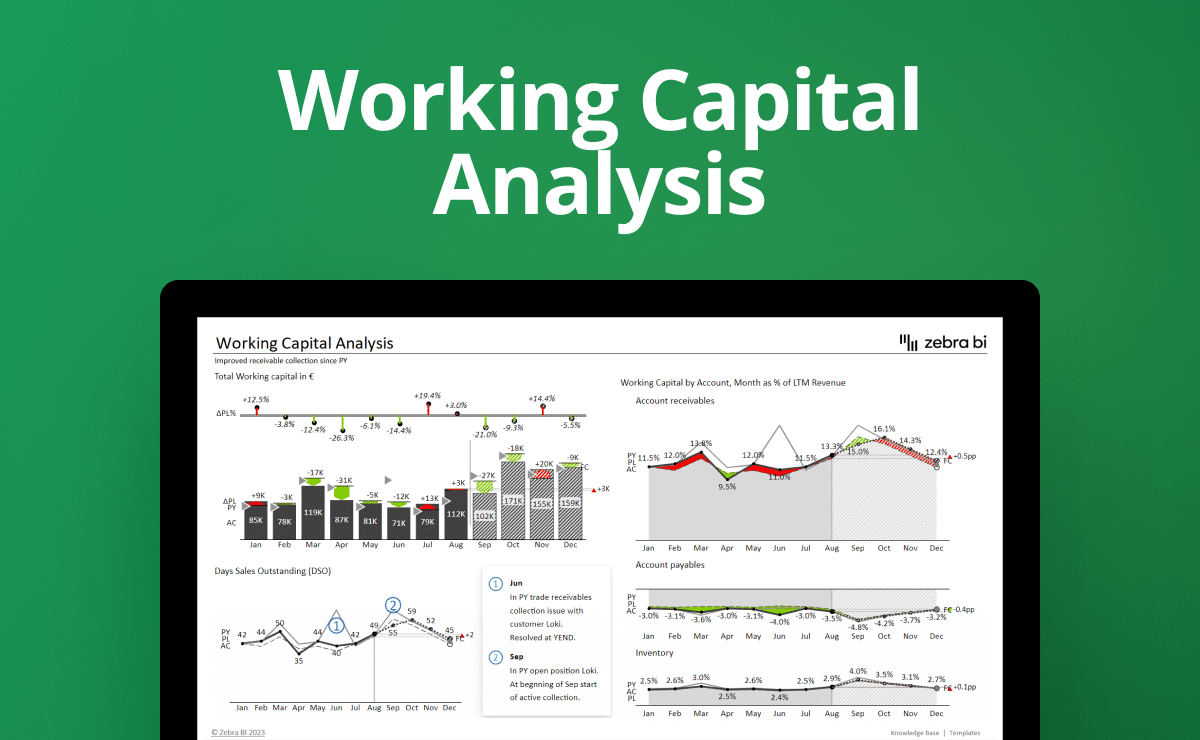
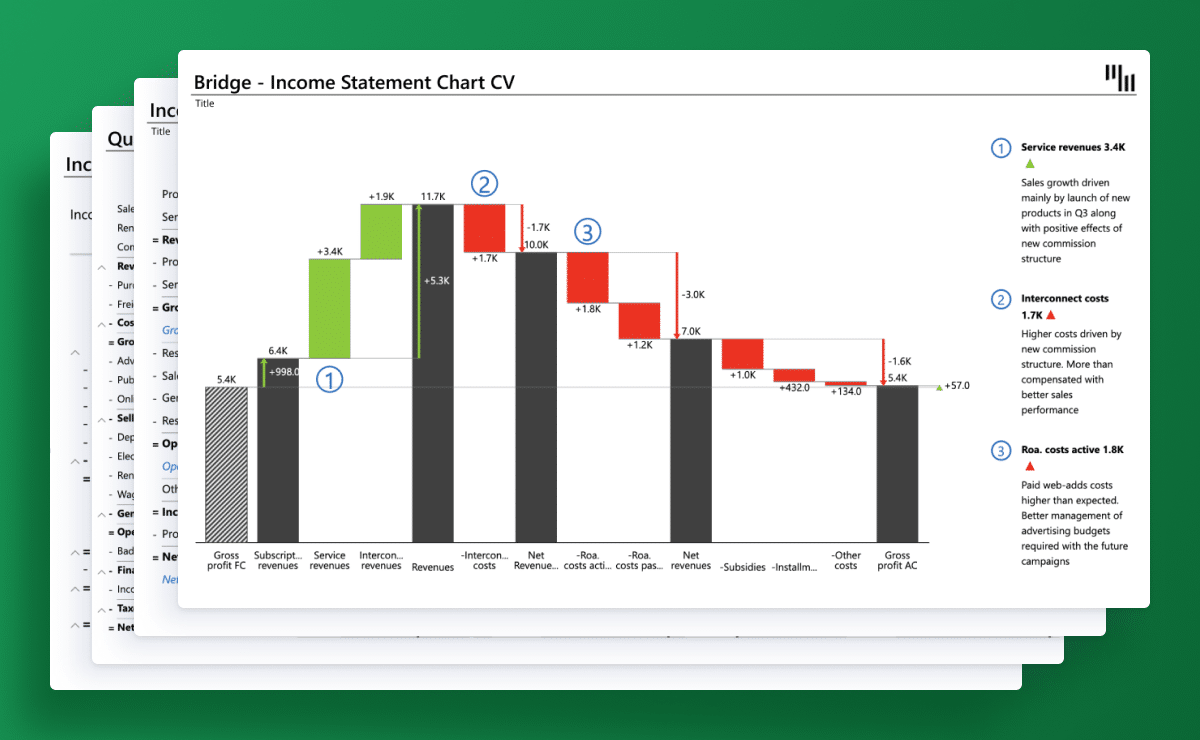
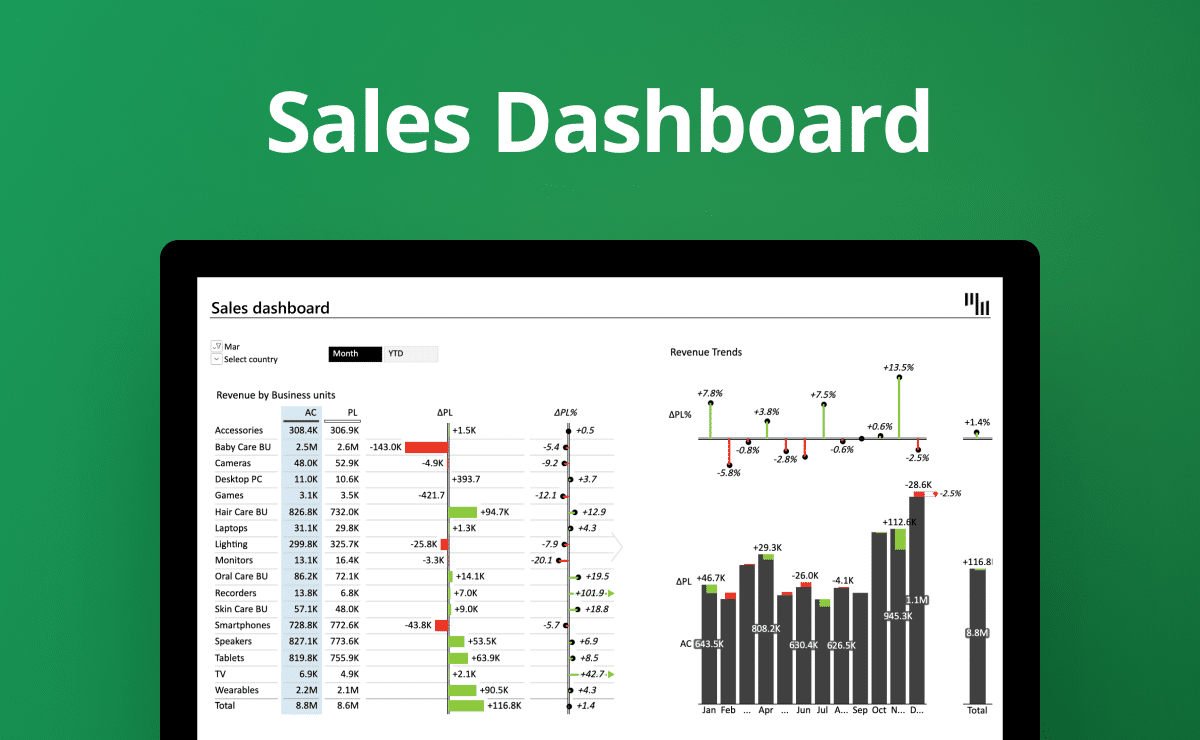
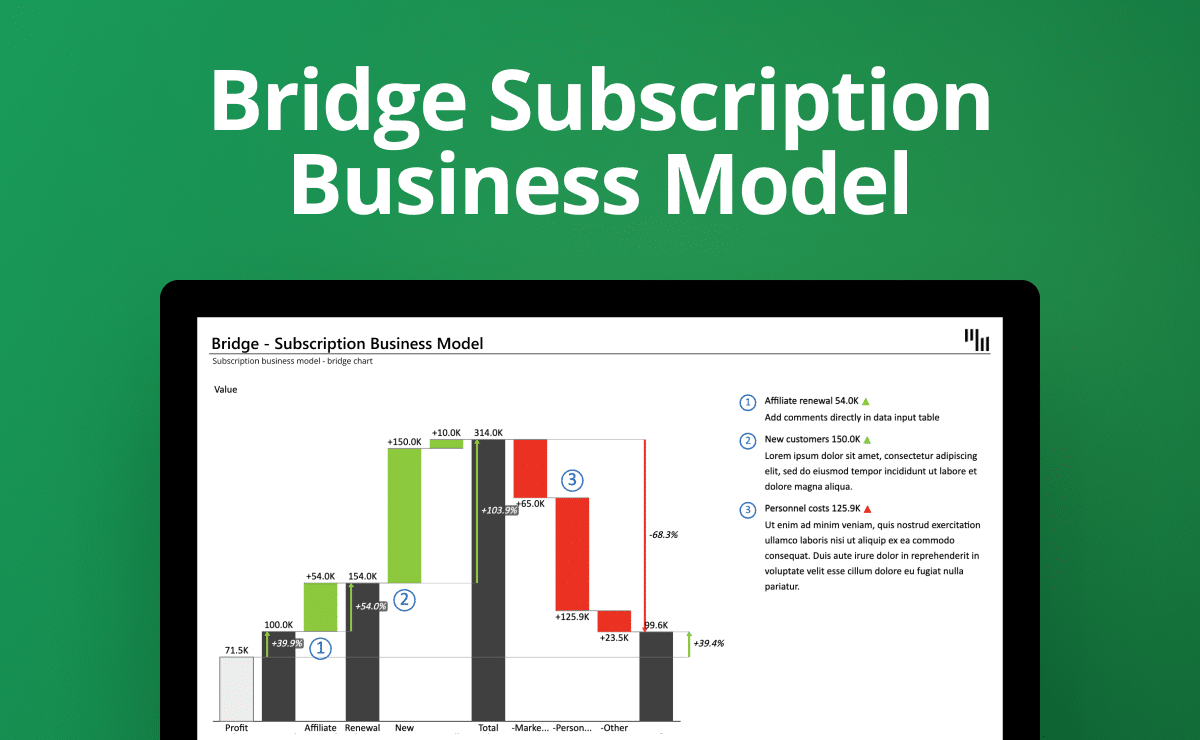
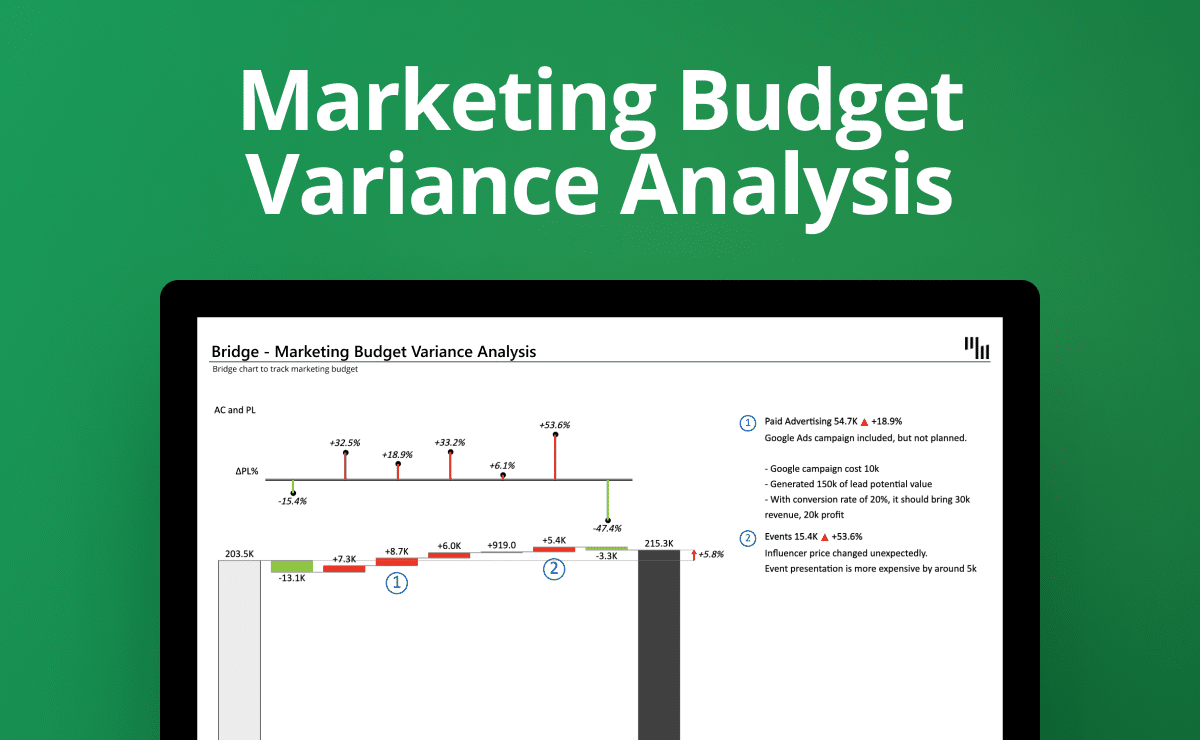
Present your costs in the form of an actionable story. Enjoy the preview of how Zebra BI for Office turns your data into concise and compelling insights.
 September 8th
 February 22nd
 26 Feb 2026