An essential tool for finance professionals, our Financial Reporting and Forecasts Update PowerPoint Template provides a structured approach to documenting and predicting a company's financial performance. This template is designed to support informed decision-making, strategic planning, and operational efficiency.
Purpose of Financial Reporting and Forecasts Updates
Financial reporting and forecast updates are critical tools for business and finance professionals. They serve to:
- Informed Decision-Making: Deliver crucial insights into financial health to guide strategic decisions.
- Operational Efficiency: Identify areas for cost reduction and process optimization.
- Strategic Planning: Support long-term planning by predicting future financial performance.
- Stakeholder Communication: Ensure transparent communication with stakeholders about financial status and forecasts.
Usage and Frequency
Financial reporting is typically conducted monthly, quarterly, and annually, while forecast updates are performed monthly to maintain an accurate financial outlook. These reports involve data collection, financial performance analysis, and preparation of comprehensive reports including actuals and forecasts.
Preparation and Audience
Financial analysts, controllers, and CFOs prepare these reports by gathering data, performing analyses, and compiling the information. The primary audience includes senior management, department heads, and investors, who use these reports to understand financial performance, make informed decisions, allocate resources efficiently, and develop strategic plans.
Key Performance Indicators (KPIs)
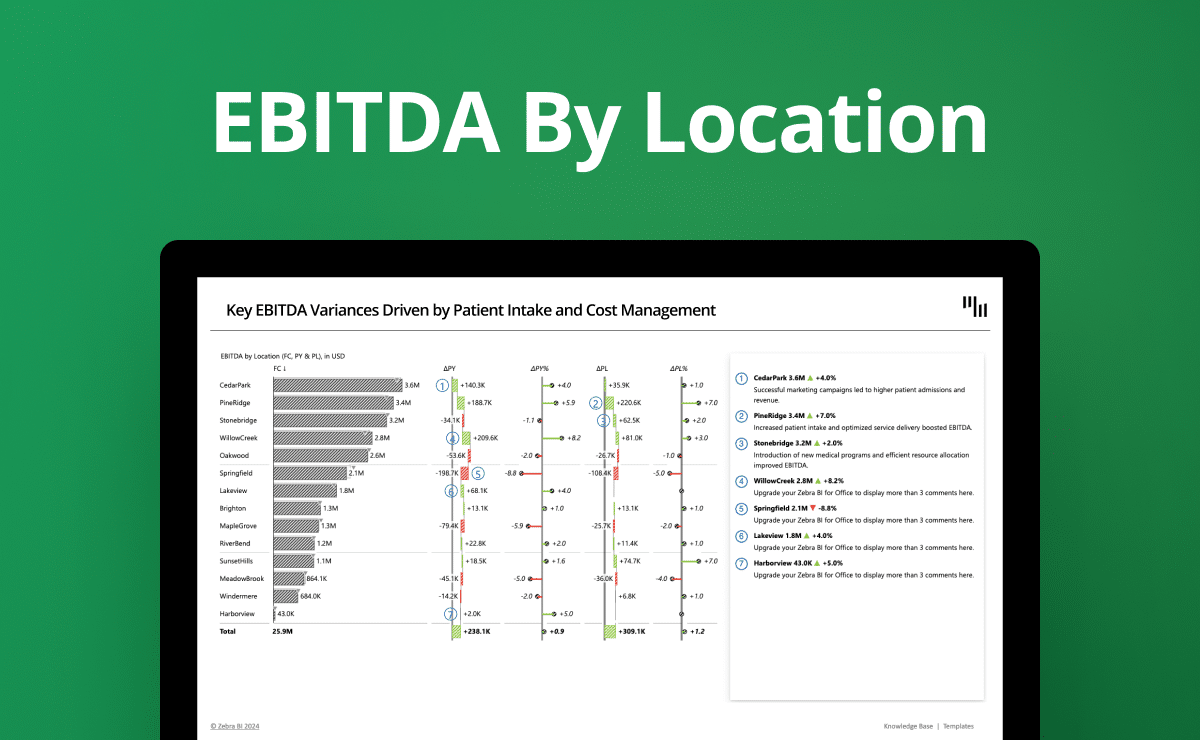
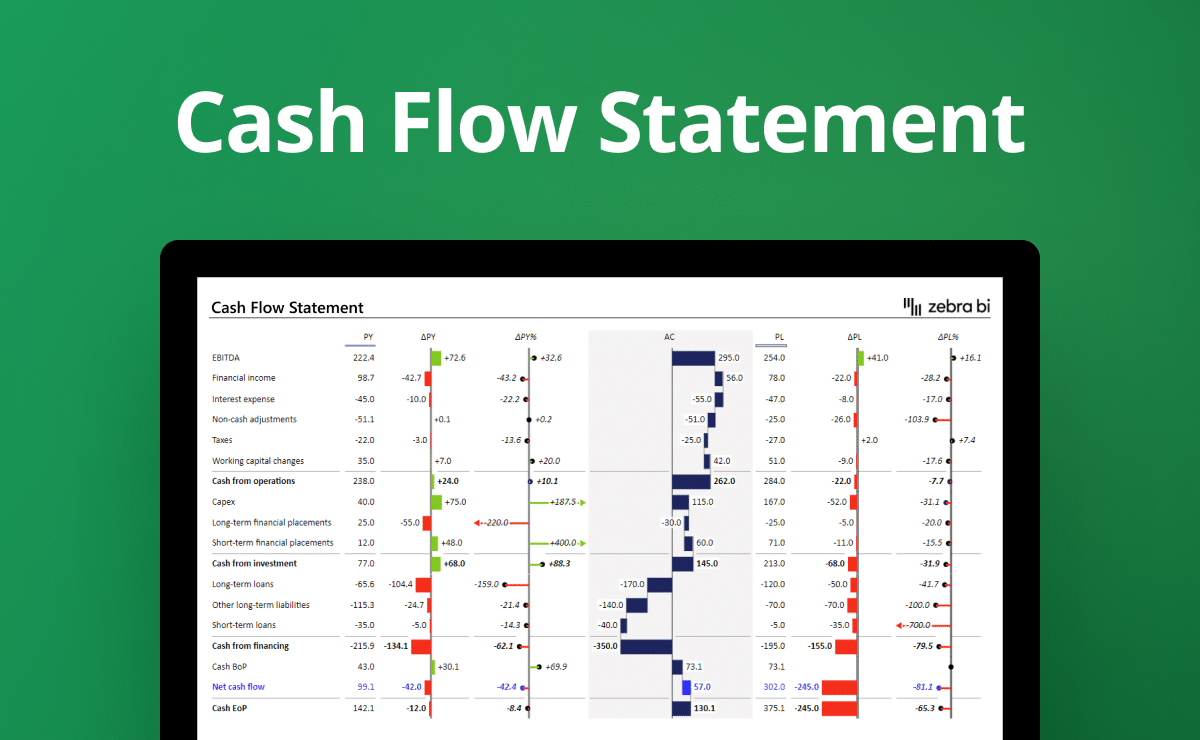
- EBITDA (Earnings Before Interest, Taxes, Depreciation, and Amortization): Indicates operational profitability. Crucial for understanding the core business performance without the impact of financial and non-operational factors.
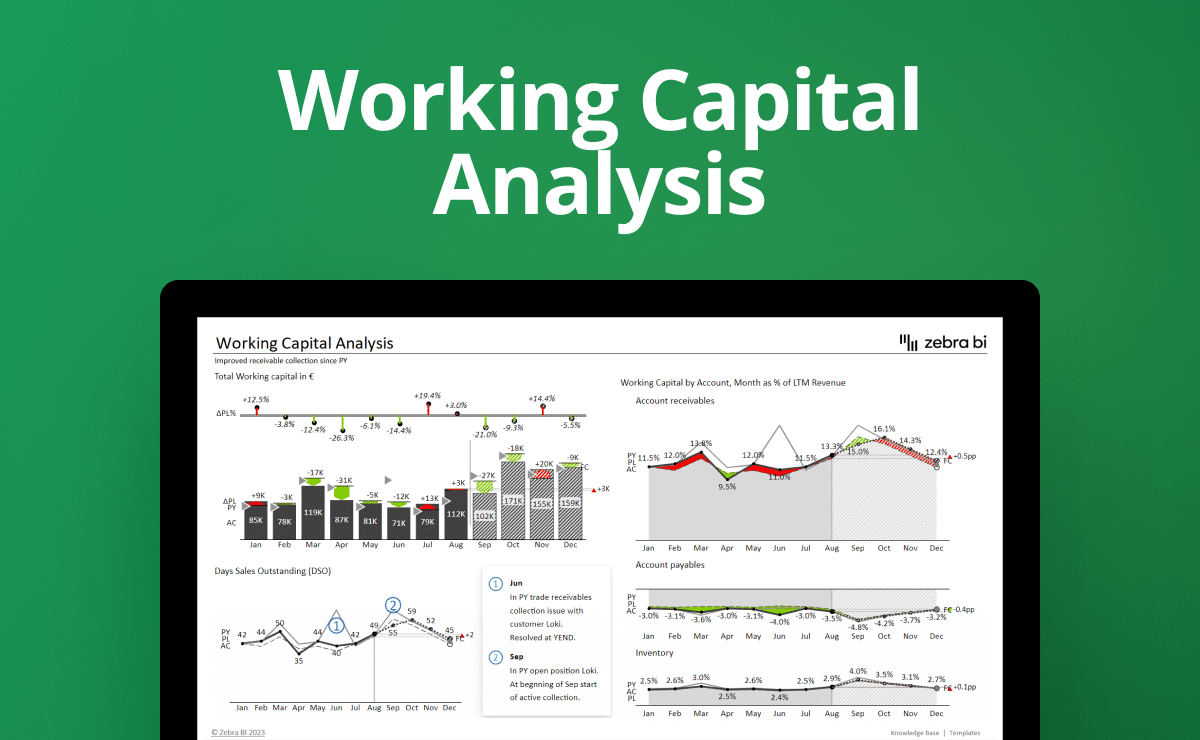
- Trade Working Capital (TWC): Measures operational liquidity and efficiency in managing short-term assets and liabilities.
- Cash Conversion Cycle (CCC): Time taken to convert inventory into cash flows, indicating efficiency.
- Days Inventory on Hold (DOH): Average number of days inventory is held before being sold.
- Days Sales Outstanding (DSO): Average number of days to collect payment after a sale.
- Days Payables Outstanding (DPO): Average number of days to pay suppliers.
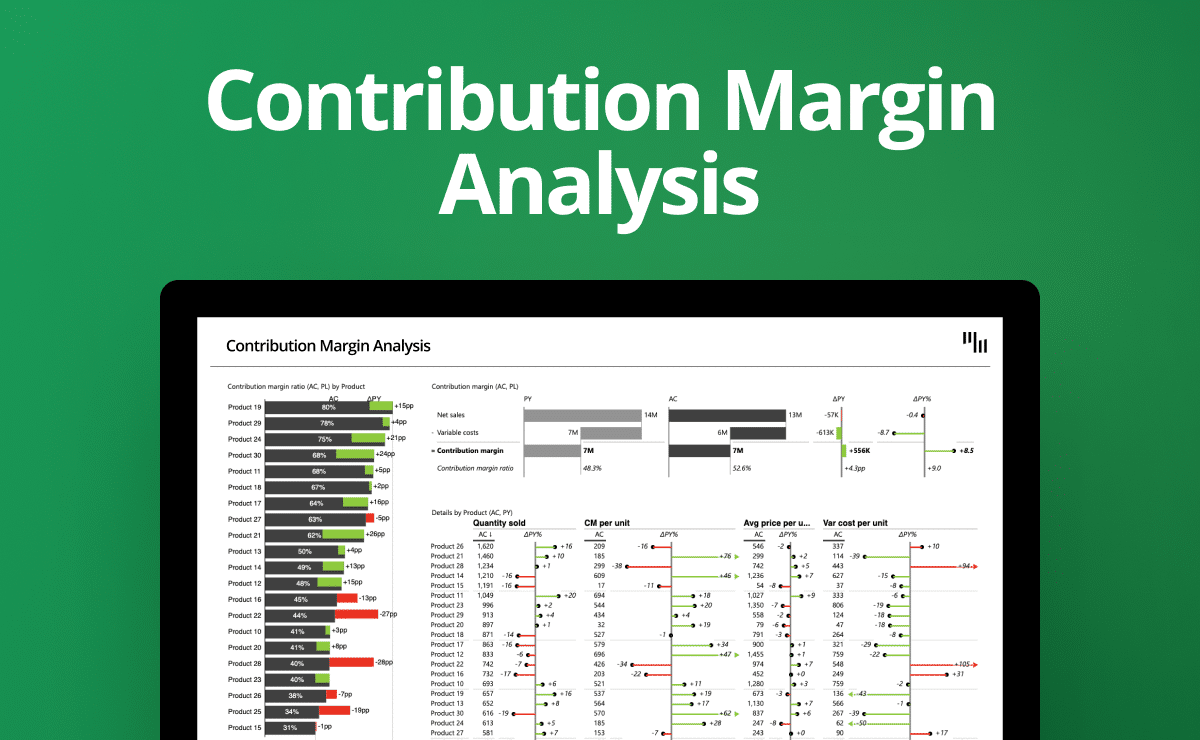
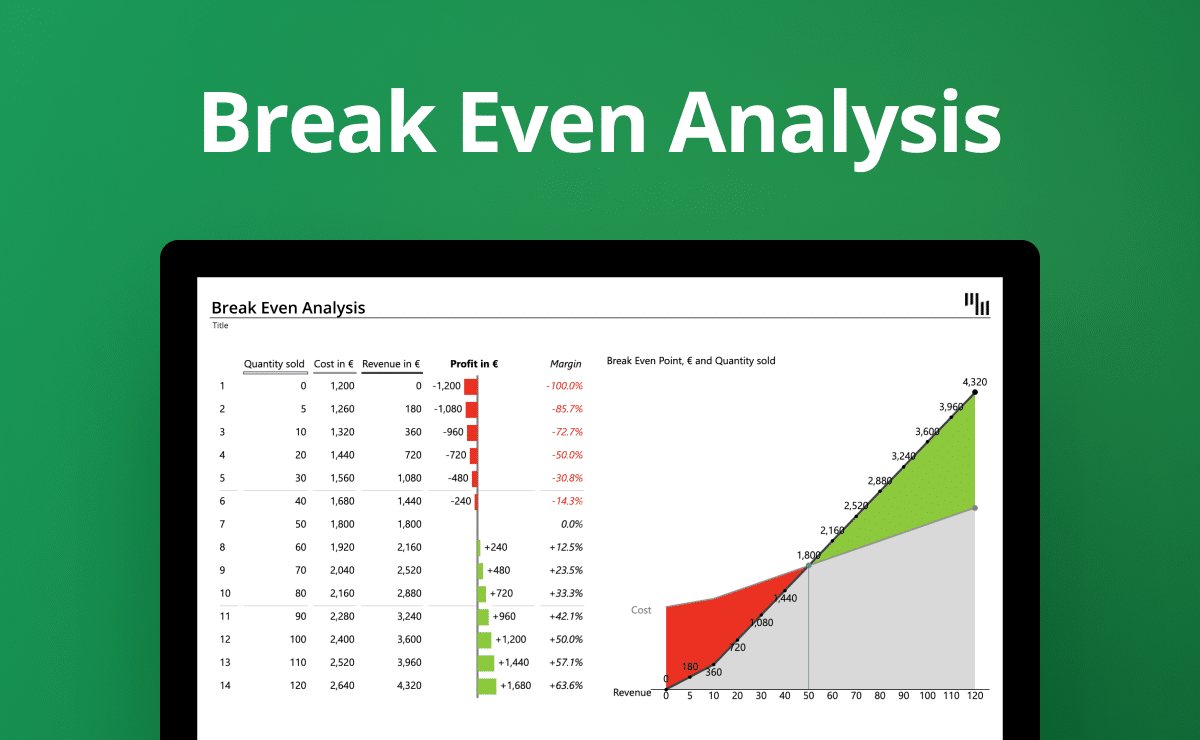
- Contribution Margin (CM): Shows product profitability by calculating sales revenue minus variable costs.
- Total Recordable Incident Rate (TRIR): Measures workplace safety by indicating the number of recordable incidents per 100 employees.
 September 8th
 February 22nd
 26 Mar 2026