Gross Sales vs Net Sales Excel Report Template
Overview
Revolutionize Your Revenue Analysis: The Ultimate Excel Template for Gross vs Net Sales
Understanding Gross Sales vs. Net Sales
Gross Sales represent the total sales revenue without deductions. In contrast, Net Sales is revenue after subtracting returns, allowances, and discounts. This distinction is critical for accurately assessing sales efficiency and net profitability.
The Importance of Tracking Gross Sales vs. Net Sales
Tracking both Gross and Net Sales is essential for:
Evaluating sales performance : By comparing gross and net sales, businesses can identify the impact of sales activities and customer interactions on revenue.
Improving financial strategies : These metrics offer insights into product pricing, discounts, and customer satisfaction, guiding more informed financial decisions.
Enhancing reporting accuracy : Accurate tracking ensures reliable financial statements, crucial for stakeholders and strategic planning.
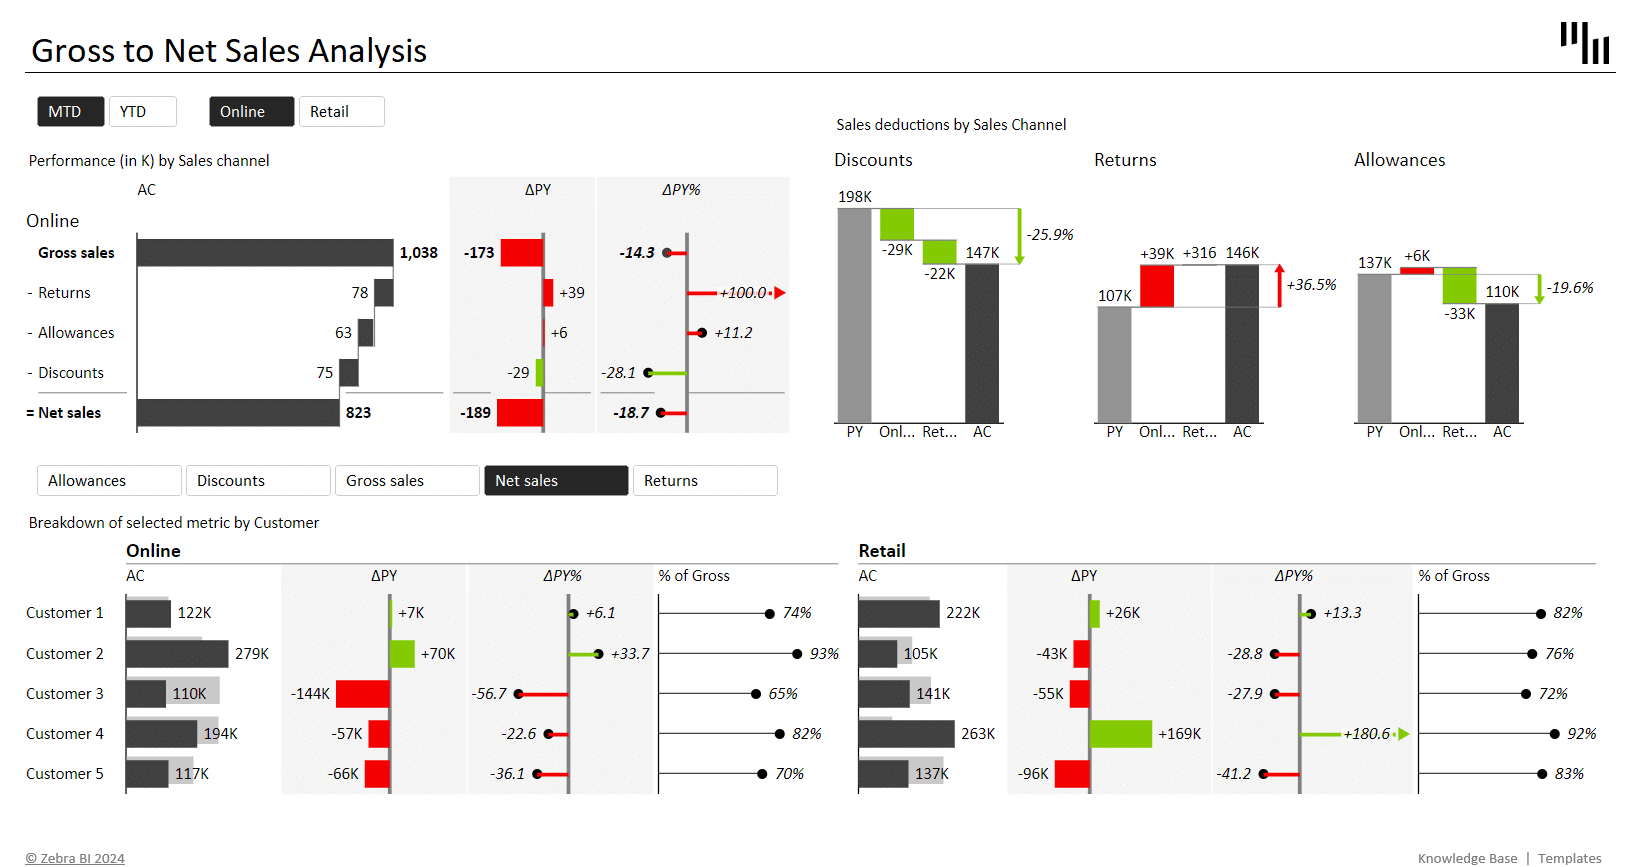
Visualizing Sales Data with Zebra BI
Our template uses both Zebra BI Tables with integrated charts and Zebra BI Charts, for dynamic visual analysis, transforming complex sales data into understandable insights. Features include:
Waterfall Charts : Simplify the narrative from Gross to Net Sales, highlighting discounts, returns, and allowances.
Cross-filtering : Enhance report clarity by allowing users to filter data across different dimensions, providing a multi-angle view of sales performance.
This Gross Sales vs Net Sales template is not just a report but a strategic tool for fine-tuning your sales strategy and financial planning.


