Hospital Monthly Closing P&L Excel Template
Overview
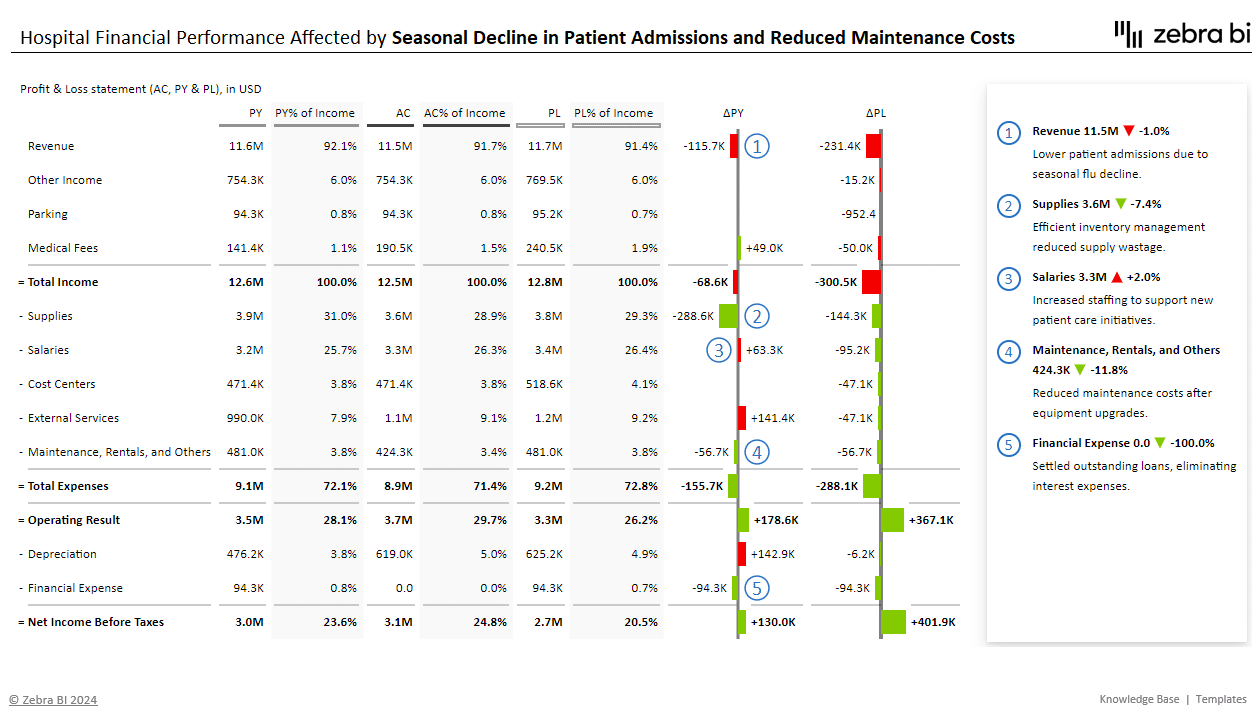
Prepared on a monthly basis, these reports are essential for assessing financial health and guiding strategic decisions. With Zebra BI, visualize your data with proportional scaling, highlight critical variances, and maintain standardized formatting for consistency. Integrated comments and inverted variances for expenses provide the context needed to understand and act on financial insights effectively.
Business intelligence and financial analysis require monthly closing reporting. It offers a deep understanding of hospital financial performance, serving as a foundation for informed decision-making. Our Hospital Monthly Closing P&L Excel Template equips analysts with a comprehensive tool for conducting detailed monthly closing reports effortlessly.
What is Monthly Closing Reporting and Why is it Important?
Monthly closing reporting finalizes all financial transactions for a specific month. This ensures that all income and expenses are accurately accounted for, providing a comprehensive snapshot of the hospital's financial performance. This process is crucial for management to make informed decisions, assess financial health, track performance against budgets, and identify areas for improvement.
How and When is the P&L Statement Used?
The Profit and Loss (P&L) statement summarizes the revenues and expenses incurred during a specific period, highlighting the hospital's profitability. It is prepared monthly and ensures timely and accurate financial insights essential for strategic decision-making.
Who Prepares and Reads the P&L Statement?
The P&L statement is typically prepared by financial analysts, accountants, and the finance department. This involves gathering data from various financial systems, reconciling accounts, and recording transactions accurately.
The primary readers include C-level executives, financial managers, department heads, and external stakeholders. These reports are used to review financial performance, guide strategic planning, and meet regulatory requirements.
Importance of Visualization in P&L Reporting
Proper visualization is key to making financial data understandable and actionable:
- Scaling: Presenting data proportionally helps compare different metrics easily, allowing stakeholders to identify significant figures and trends quickly.
- Variances: Highlighting differences between actuals and budget or previous periods provides insights into performance deviations, facilitating immediate identification of areas needing attention.
- Standardized Formatting: Consistent data presentation enhances readability and ensures all reports follow a common structure, making it easier for stakeholders to interpret and compare over time.
- Integrated Comments: Adding context and explanations for the numbers gives depth to the analysis, helping stakeholders understand the reasons behind variances and make informed decisions.
- Inverted Variances: Presenting expense variances inversely (green for savings, red for overruns) indicates cost management performance, aiding in effective expense control.


