 September 8th
 February 22nd
 26 Feb 2026
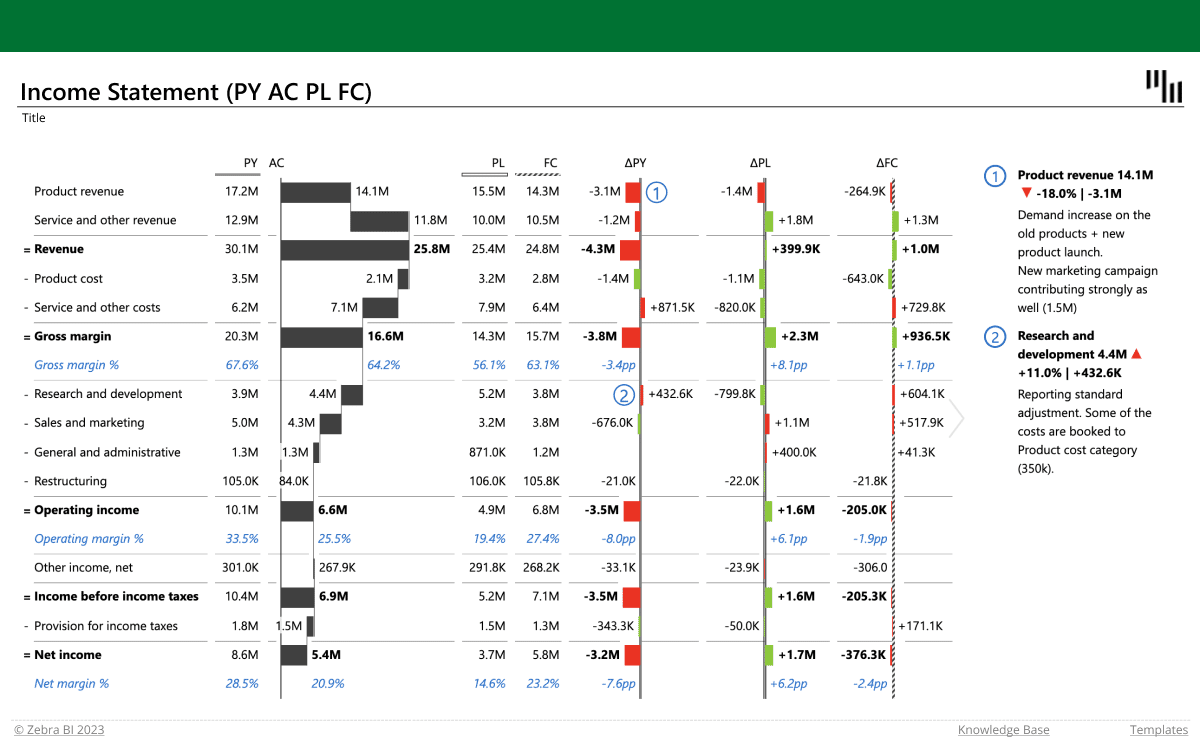
The most advanced Excel template for visualizing your profit & loss data and comparing your actual values with previous year's, the plan and forecast. It uses tables with integrated vertical waterfall charts and includes features such as the formula manager and custom calculations. It also displays absolute and relative variances that are calculated automatically.