Back to Templates for Excel
Last update:

Sales variance analysis report templates for Excel

These 4 free variance analysis report templates for Excel will help you monitor your annual sales as compared to forecasts, plans, and previous year's results. Present your data using an easy-to-read table with integrated charts and other advanced visualization features.
Overview
Tracking your annual sales performance is key to keeping your numbers up and staying ahead of the competition. These sales variance analysis report templates for Excel will help you quickly turn your data into insights that are easy to understand and inspire action.

Sales variance report template with basic comparisons (up to 3 measures)

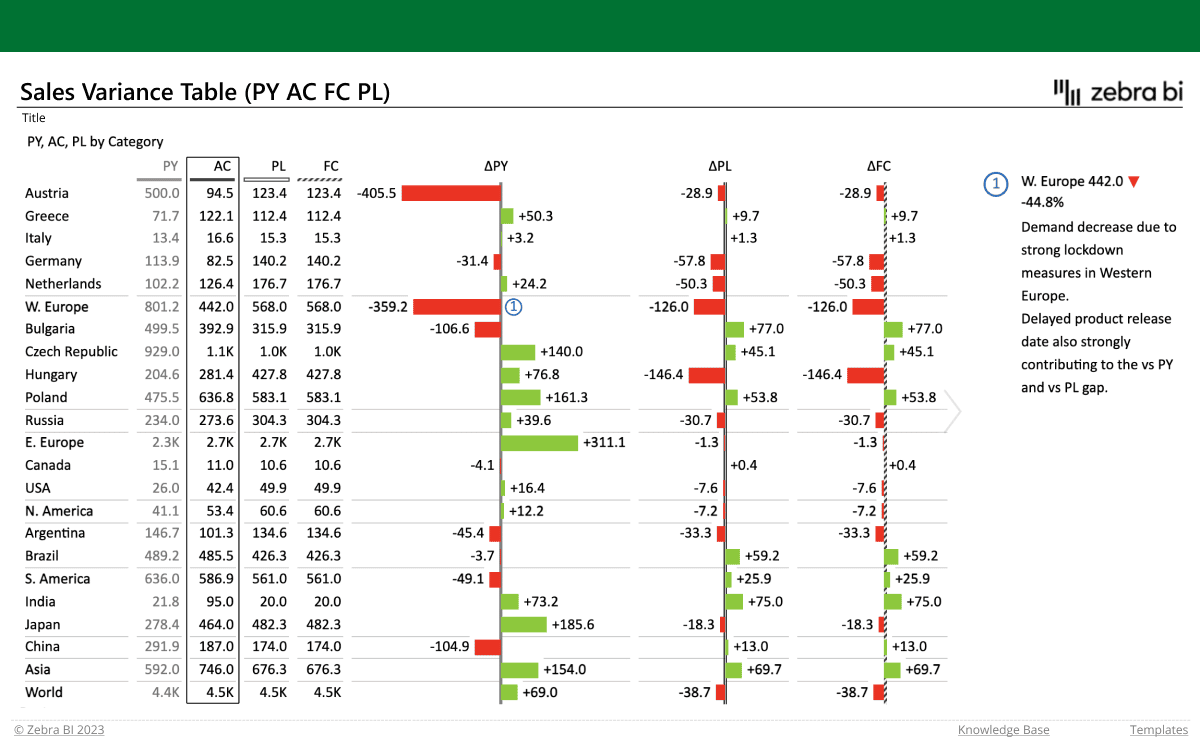
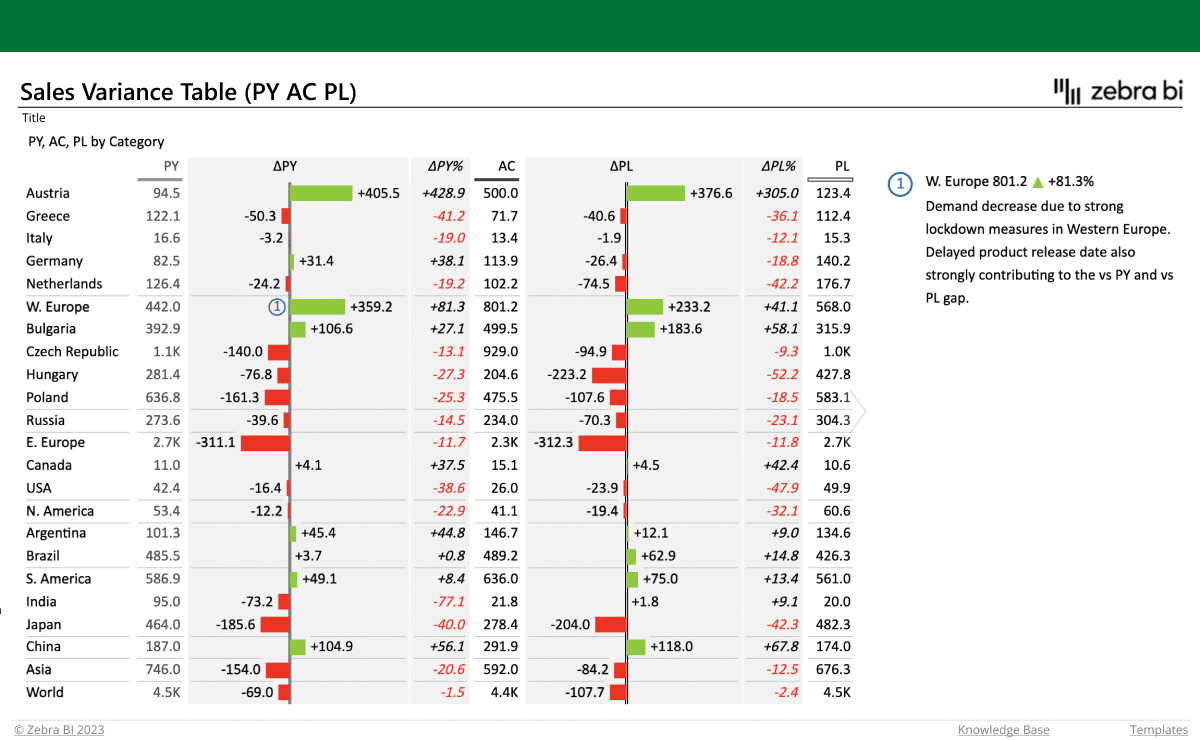
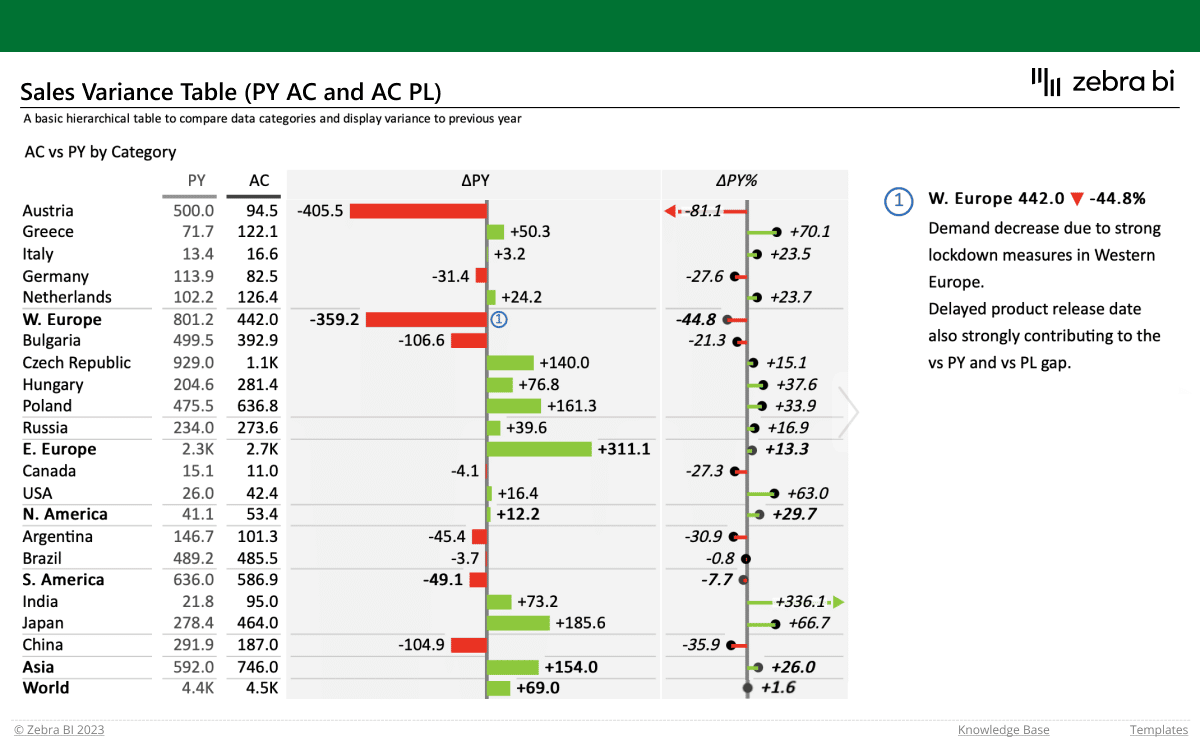
Below you’ll find sales variance report templates that let you show your actual results along with up to 3 comparisons (previous year, plan, and forecast). Use them to visualize your data via hierarchical tables with integrated charts and automatically calculated variances, so you can get a comprehensive insight into your sales performance.

Take advantage of the formula manager to calculate new data elements, and custom calculations (invert/result) to display negative accounts or mark others as result. Want to explain the numbers further? Add dynamic comments to give them some more context.

Sales variance report template with multiple levels

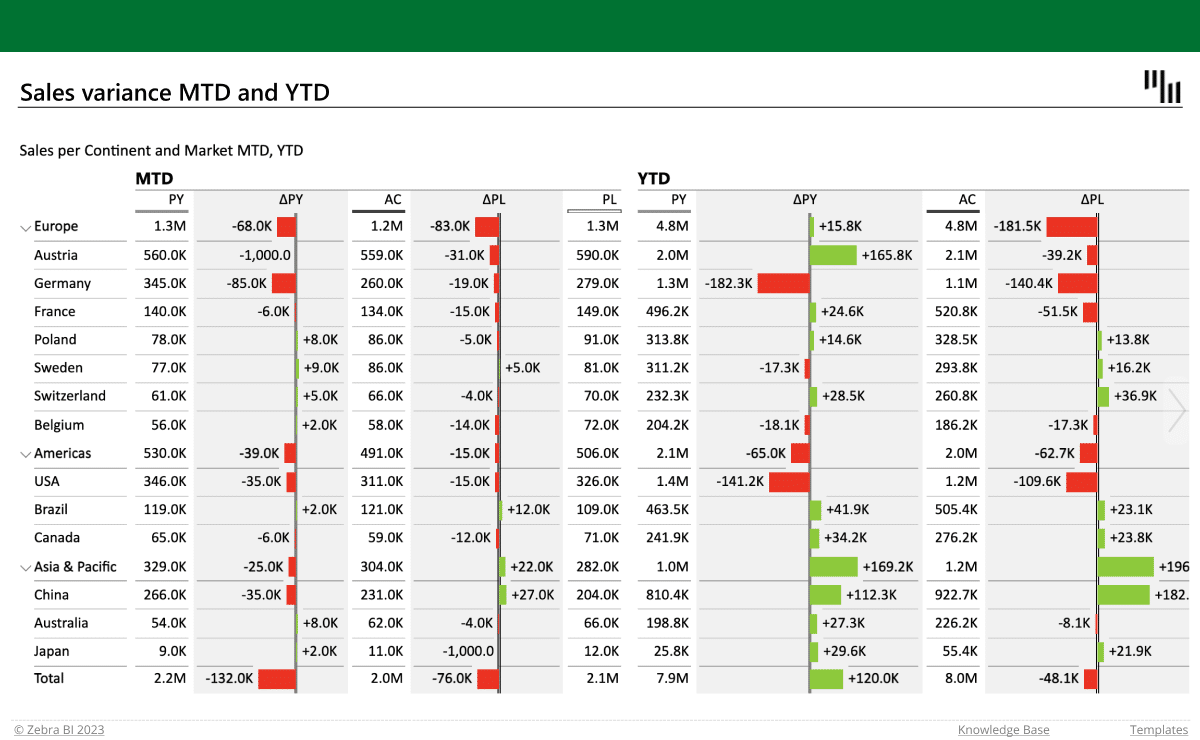
To get more detailed insights into your sales performance, use the multi-level report template. This one presents the data by individual regions and countries, and compares it to the previous year’s results and plan. It also automatically calculates the variances and enables you to easily analyze the data using the year-to-date and month-to-date views.

On top of that, you can calculate new data elements with the formula manager and use custom calculations (invert/result) to accurately present your accounts. You can even filter them using Top & bottom N, and show or hide your overall grand total. And there’s more still! Take advantage of the highlighting options to draw attention to specific rows or columns that need immediate attention and make them stand out with a border.

A wealth of features for next-level reports. And you wouldn’t believe how easy they are to use! Take a look at the quick video below and see for yourself.
Features used
Advanced table visual with integrated charts
Actual data display with up to 3 comparisons (PY, PL and FC)
Formula manager for calculating new data elements
Automatically calculated variances
Custom calculations
Dynamic comments
Expand & collapse for more/less detail
Highlighting options
Top/Bottom N
Grand total
Keep track of your sales performance at just a glance with these sales variance analysis report templates for Excel. Enjoy the preview of how Zebra BI for Office turns your data into concise and compelling insights.
Download this template
Download templates

More professionally-designed templates to use

variance analysis report template excel
Intermediate
Sales variance analysis report templates for Excel
Intermediate
Basic
Income statement templates for Excel
Advanced
Consolidated financials dashboard in Excel
Intermediate
Sales variance report with multiple levels
Intermediate
Sales overview report in Excel
Advanced
Sales dashboard in Excel
Intermediate
Revenue-cost-profit analysis
Intermediate
Inventory report
Intermediate
Quarterly income statement
Basic
Income statement with multiple levels
balance sheet template Excel
Basic
Balance sheet template for Excel
Basic
Subscription business model analysis in Excel
Basic
Marketing budget variance analysis in Excel
Basic
Income statement (bridge chart) in Excel
Intermediate
Price-Volume-Mix variance analysis in Excel
EBIT contribution analysis Excel Template
Basic
EBIT contribution analysis in Excel
Basic
Cash Flow Statement template
Income statement Excel Template
Basic
Income statement in Excel (PY-AC-PL-FC)
Income statement (PY-AC-PL) Excel Template
Basic
Income statement in Excel (PY-AC-PL)
Basic
Income Statement in Excel (PY-AC)
Basic
Cost Variance Table in Excel (PY-AC-FC-PL)
Basic
Cost Variance Table in Excel (PY-AC-PL)
Basic
Cost Variance Table in Excel (PY-AC_and_AC-PL)
Intermediate
Monthly Sales Variances in Excel (PY-AC-FC-PL)
Intermediate
Monthly Sales Variances in Excel (AC-FC-PL)
Intermediate
Monthly Sales Variances in Excel (AC-PY-PL)
Intermediate
Monthly Sales Variances in Excel (PY-AC_and_AC-PL)
Basic
Sales Variance Table in Excel (PY-AC-FC-PL)
Basic
Sales Variance Table in Excel (PY-AC-PL)
Basic
Sales variance table in Excel (PY vs. AC and AC vs. PL)