September 8th
 February 22nd
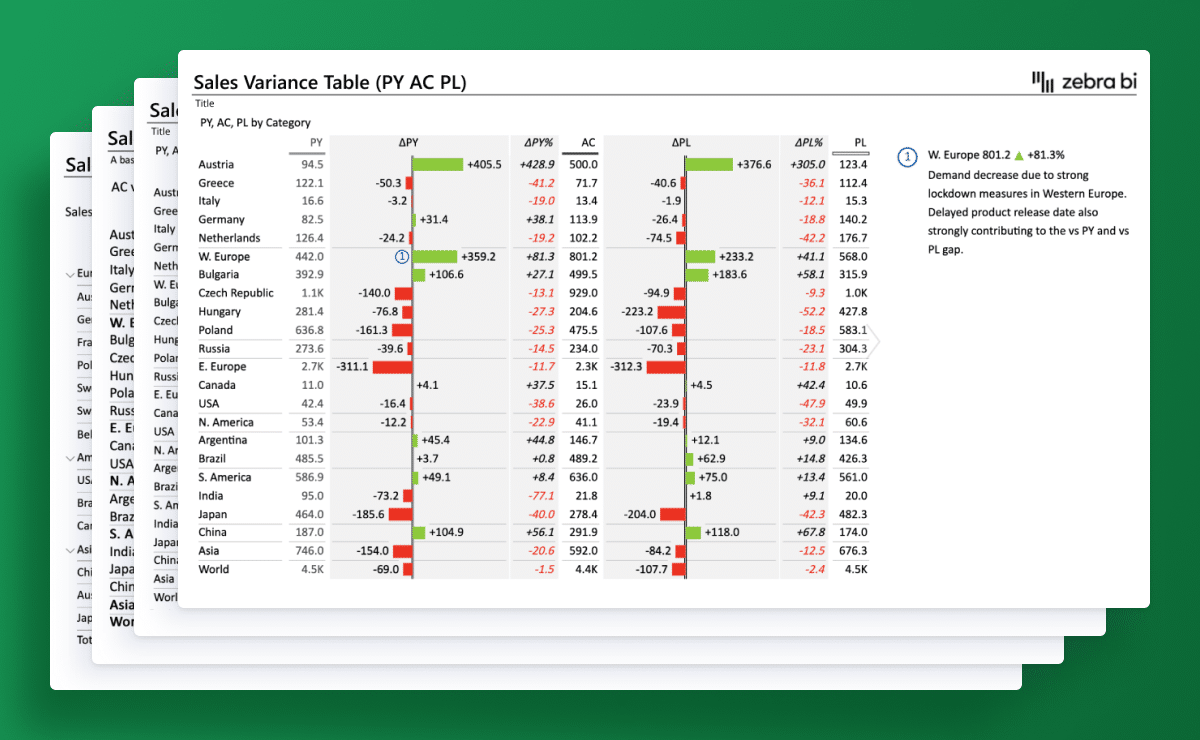
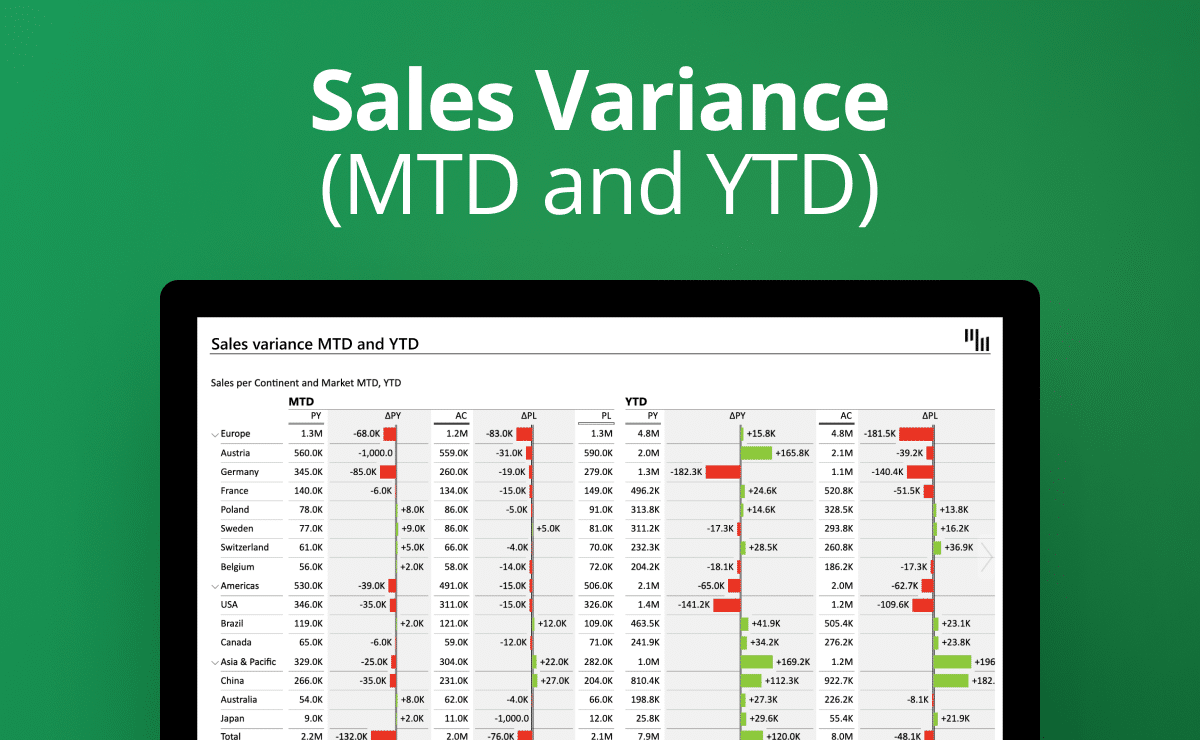
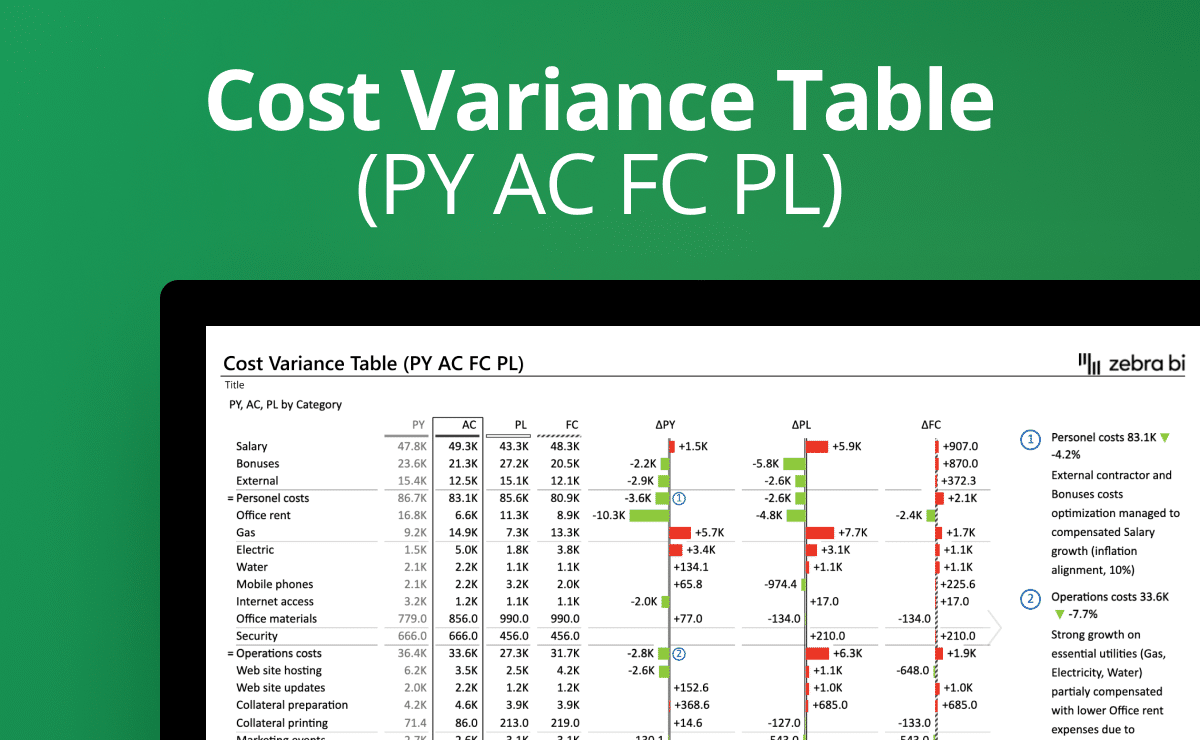
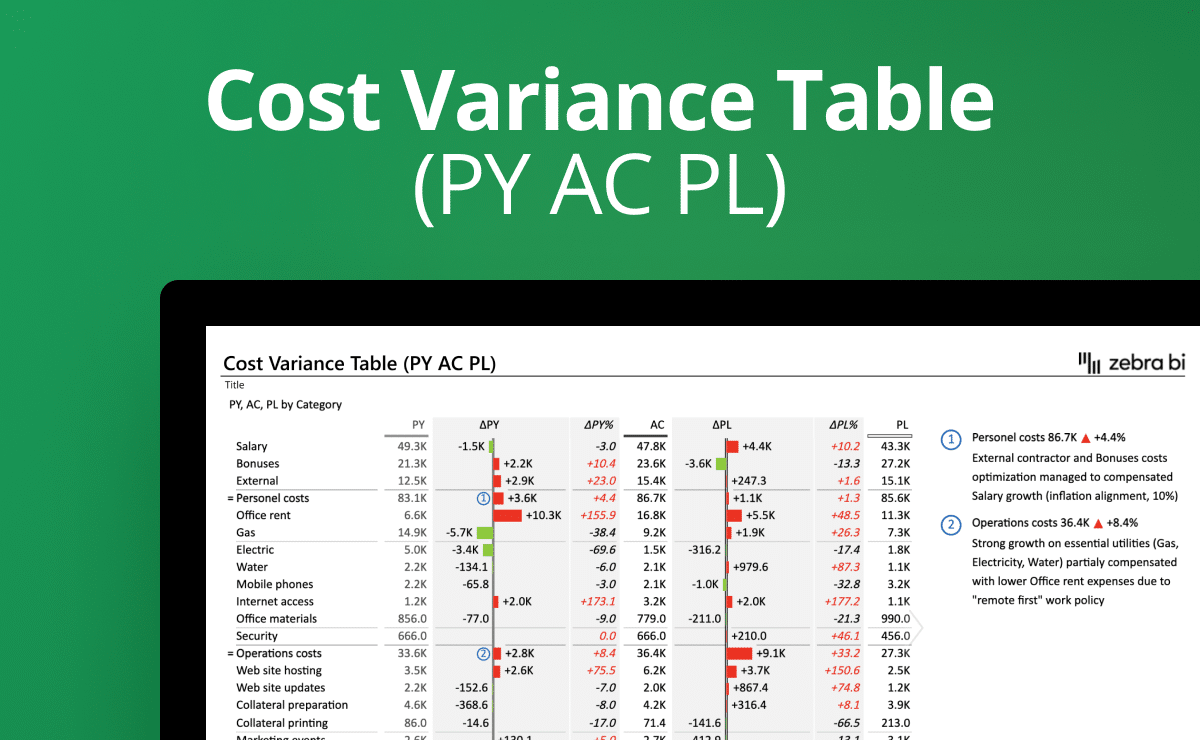
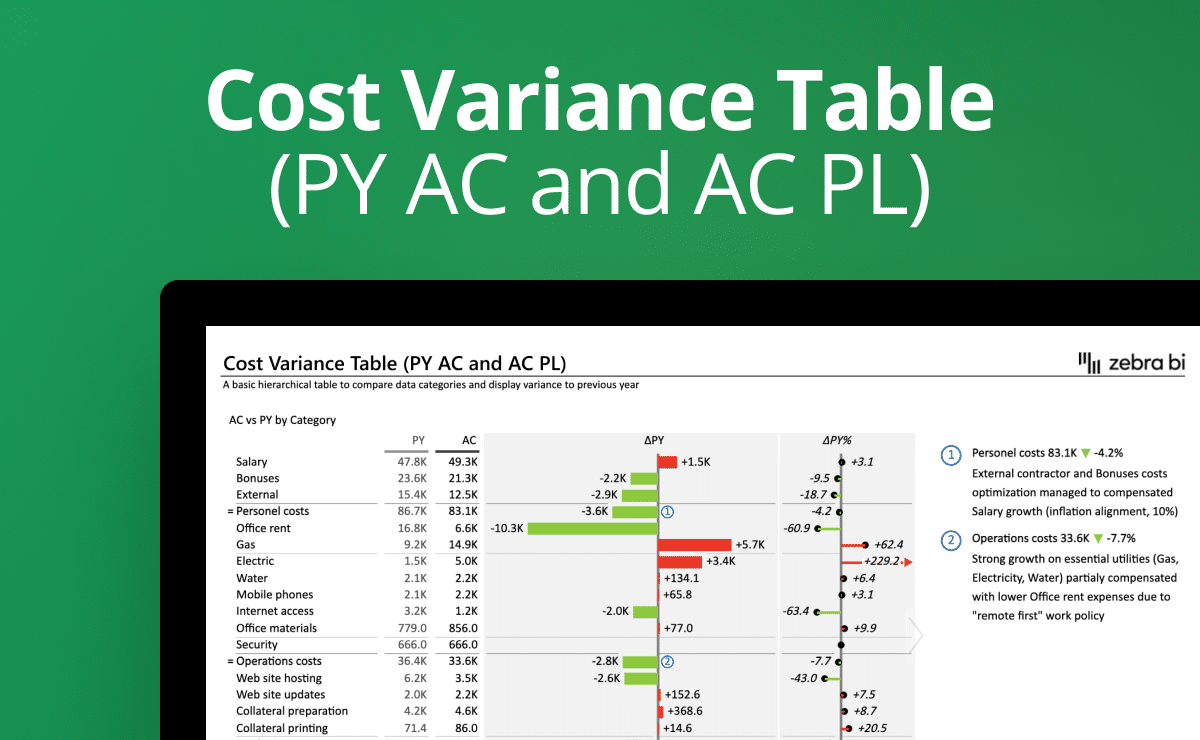
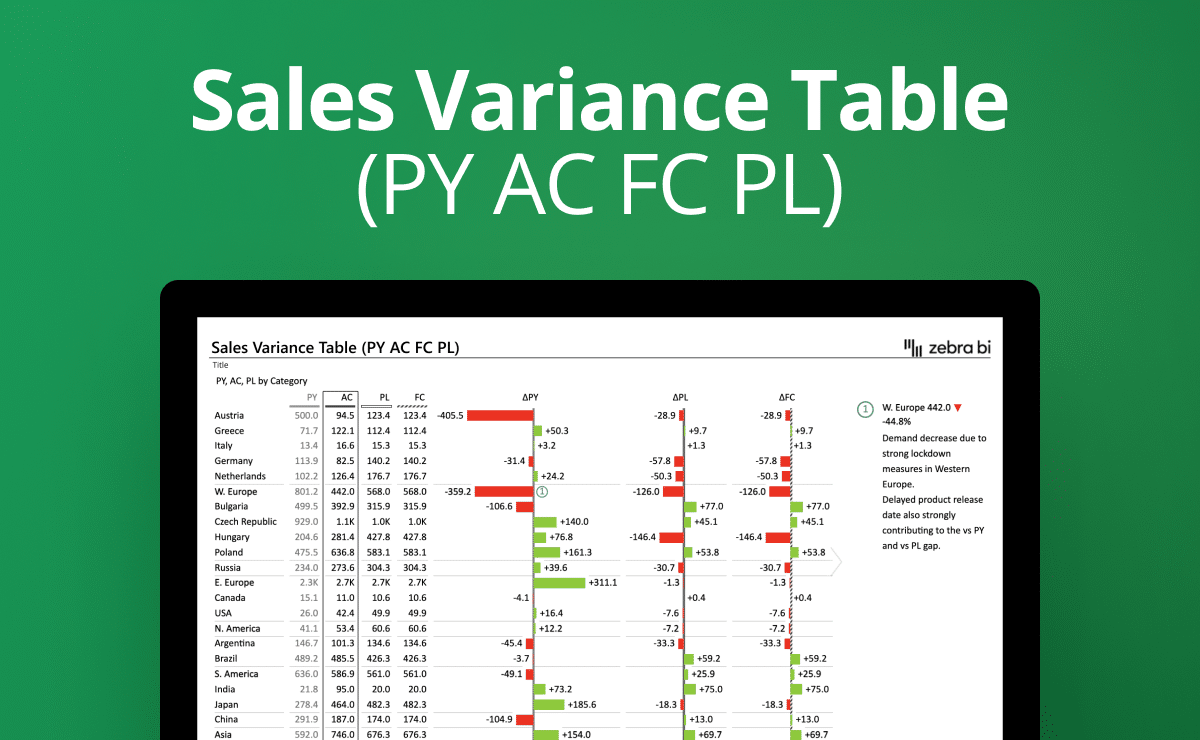
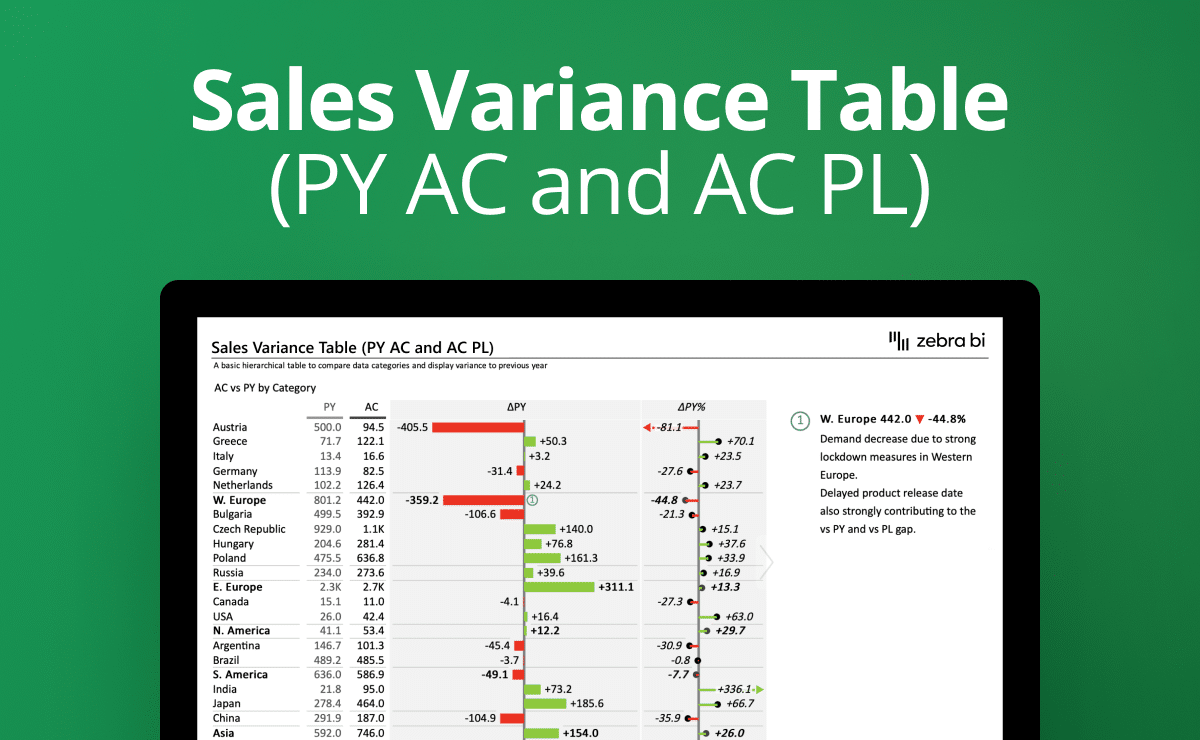
This sales variance table features a hierarchical table showing Market/Country performance. It enables you to compare the actual performance (AC) with the plan (PL) and previous year's numbers (PY) within one table. The absolute and relative variances are calculated automatically, and you can add dynamic comments to explain the numbers further.