🔥 Black Friday Offer at Zebra BI
Explore the offer

Webinar recording
Master Cost Management: Elevate Reporting, Tracking, and Efficiency

In today's business world, financial and operational decision-makers are not just crunching numbers; you are leading cost management and strategic decision-making. In this webinar, we tackle the key challenges you face in cost management, including inaccurate cost tracking, unengaging reports, lack of standardization, complex and static reporting, time-consuming insight sharing, manual data handling, and fragmented data systems.

Watch this recording to learn how to:

  • Create actionable reports: Make detailed and useful cost reports that will help you make better decisions.
  • Manage costs efficiently: Analyze, track, and control costs to optimize your resources and drive profitability.
  • Visualize data better: Adopt best practices in data visualization, create interactive reports that provide deeper insights
  • Communicate effectively: Explain complex cost data to your team and stakeholders to boost your influence and drive strategy

What's included

Full video recording
PBIX example used in the webinar
Enjoy & thank you for watching! Don't hesitate to reach out if you have any questions — write to us at support@zebrabi.com!

Presenter

Andrej Lapajne

Founder & CEO at Zebra BI

Watch the Video

Download PBIX example
Try it on your own! Download our report templates and add dynamic comments with ease.
Access the materials
Share this

Your Questions

Here are some of the questions that came up during our live session. Thank you for being such a proactive audience. Have more questions? Drop us a note at support@zebrabi.com!
I belive that the pivot tables are in the same page for demostrative purposes only. Best practice will we to have the pivot tables in another sheet and side by side, not one under the other. Am I right?

You could have pivot table on separate page and then copy paste ZBI visuals to new dedicated page. Both options are OK, depends on your preference. I also typicaly put Pivot tables side by side, but i guess it depends in which direction pivot table might expand, verticaly or horizontaly

Are you able to Drill through in Zebra BI visuals?

Yes, Drill-through is fully supported.

Are there detailed materials to better understand your models and application?

Hello, we recommend checking: https://help.zebrabi.com/

Is it possible to link directly from Quickbooks?

You could have pivot table on separate page and then copy paste ZBI visuals to new dedicated page. Both options are OK, depends on your preference. I also typicaly put Pivot tables side by side, but i guess it depends in which direction pivot table might expand, verticaly or horizontaly.

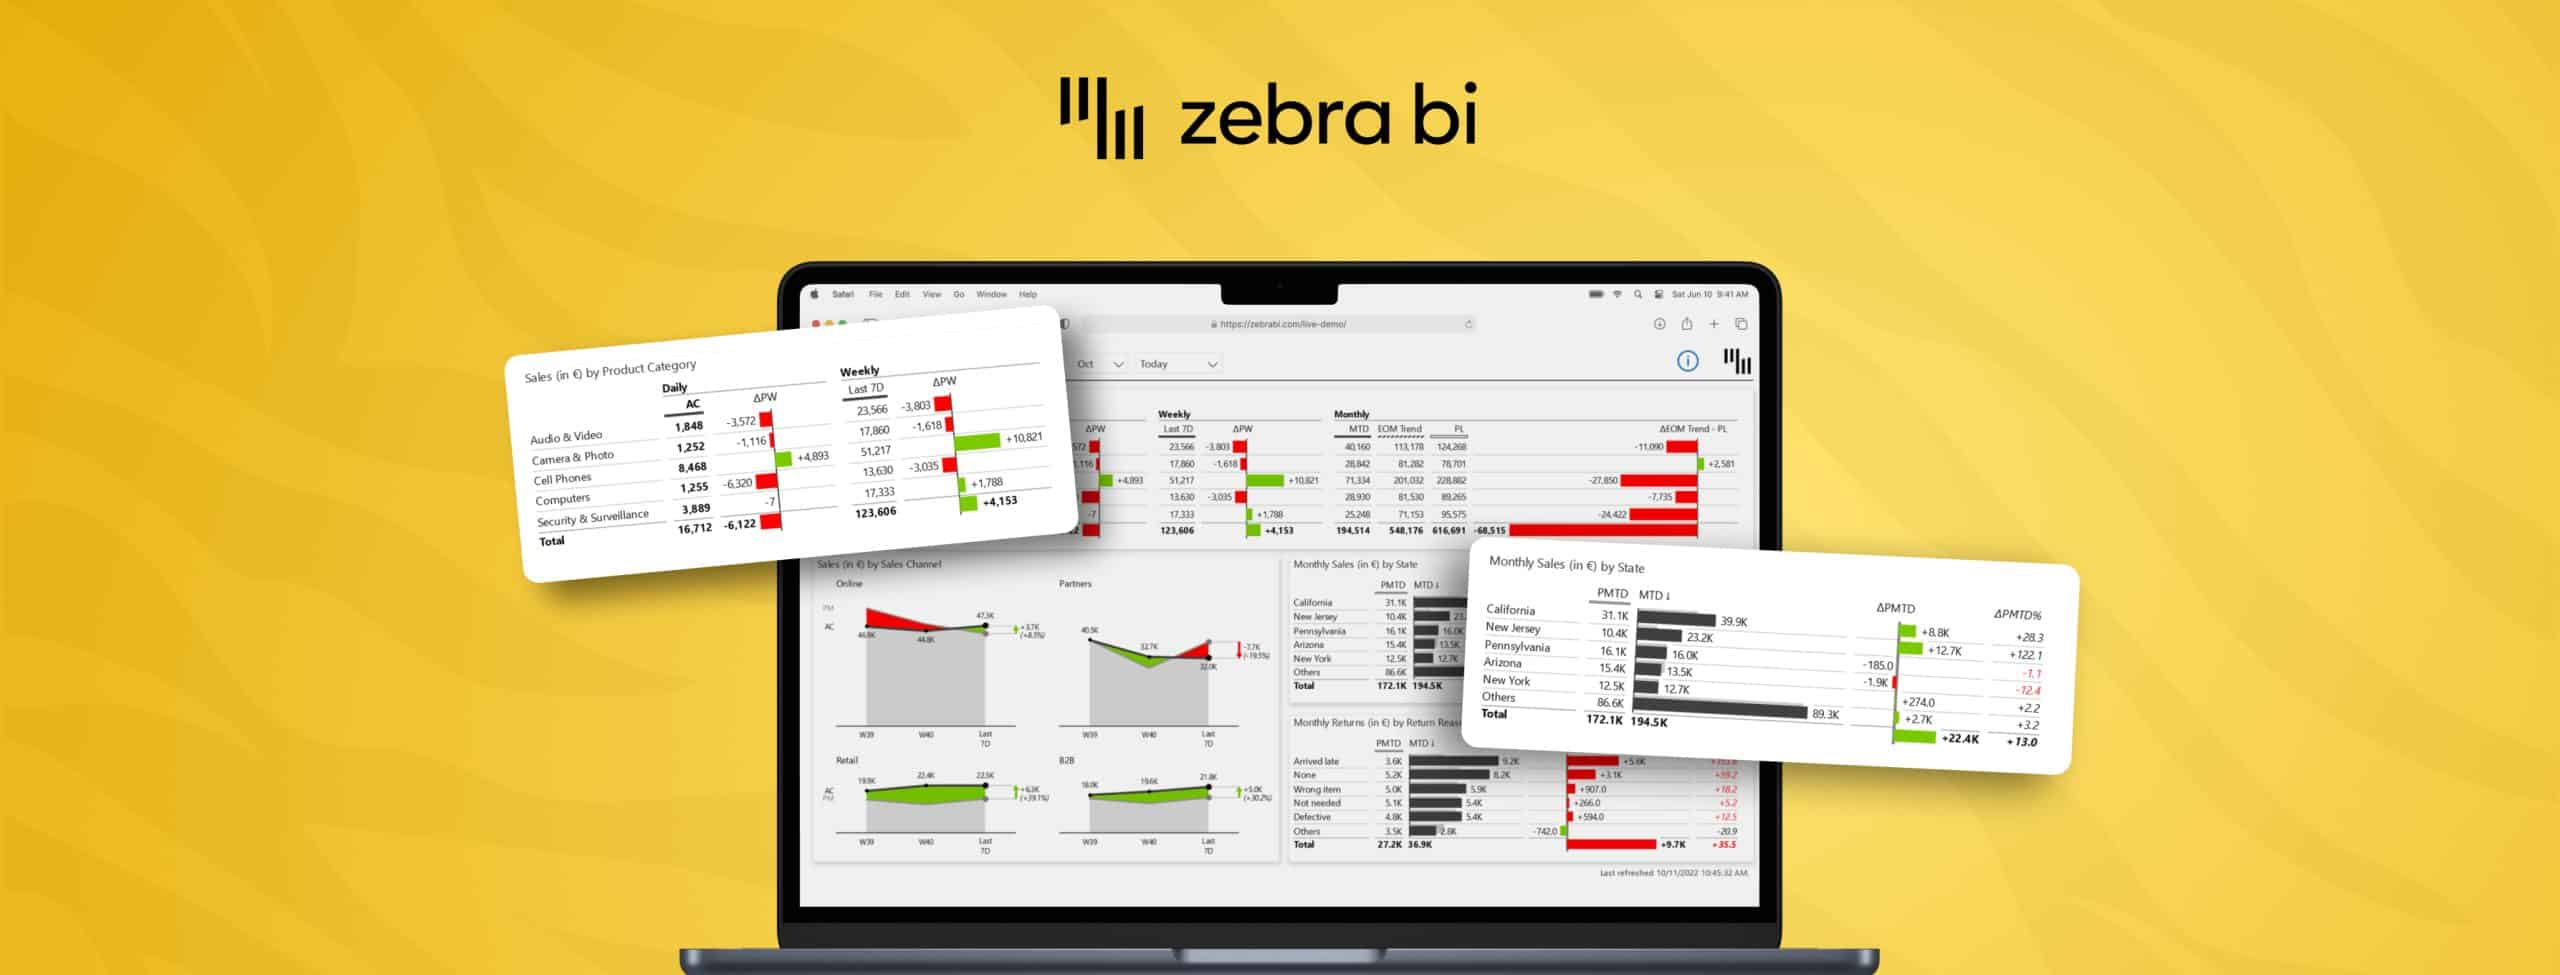
Ready to start uncovering actionable insights from your data?

Explore Zebra BI for Office and Power BI, or start a trial instantly and test our tools on your data. You can also contact us to help you build your first test report and create a custom package for your business.

More Trending Webinars

December 3, 2025
The 5-Second Sales Performance Dashboard: From Data to Decisions
Discover how to build a sales dashboard that shows real results in context — spotlighting top performers, uncovering gaps, and driving action with clear, trusted data.
Watch now
December 3, 2025
The 5-Second Sales Performance Dashboard: From Data to Decisions
Discover how to build a sales dashboard that shows real results in context — spotlighting top performers, uncovering gaps, and driving action with clear, trusted data.
Watch now
November 6, 2025
Zebra BI Partner Pulse Webinar
A new webinar series for Zebra BI partners — get the latest updates, explore new tools, and stay closely connected with the Zebra BI team.
Watch now
October 30, 2025
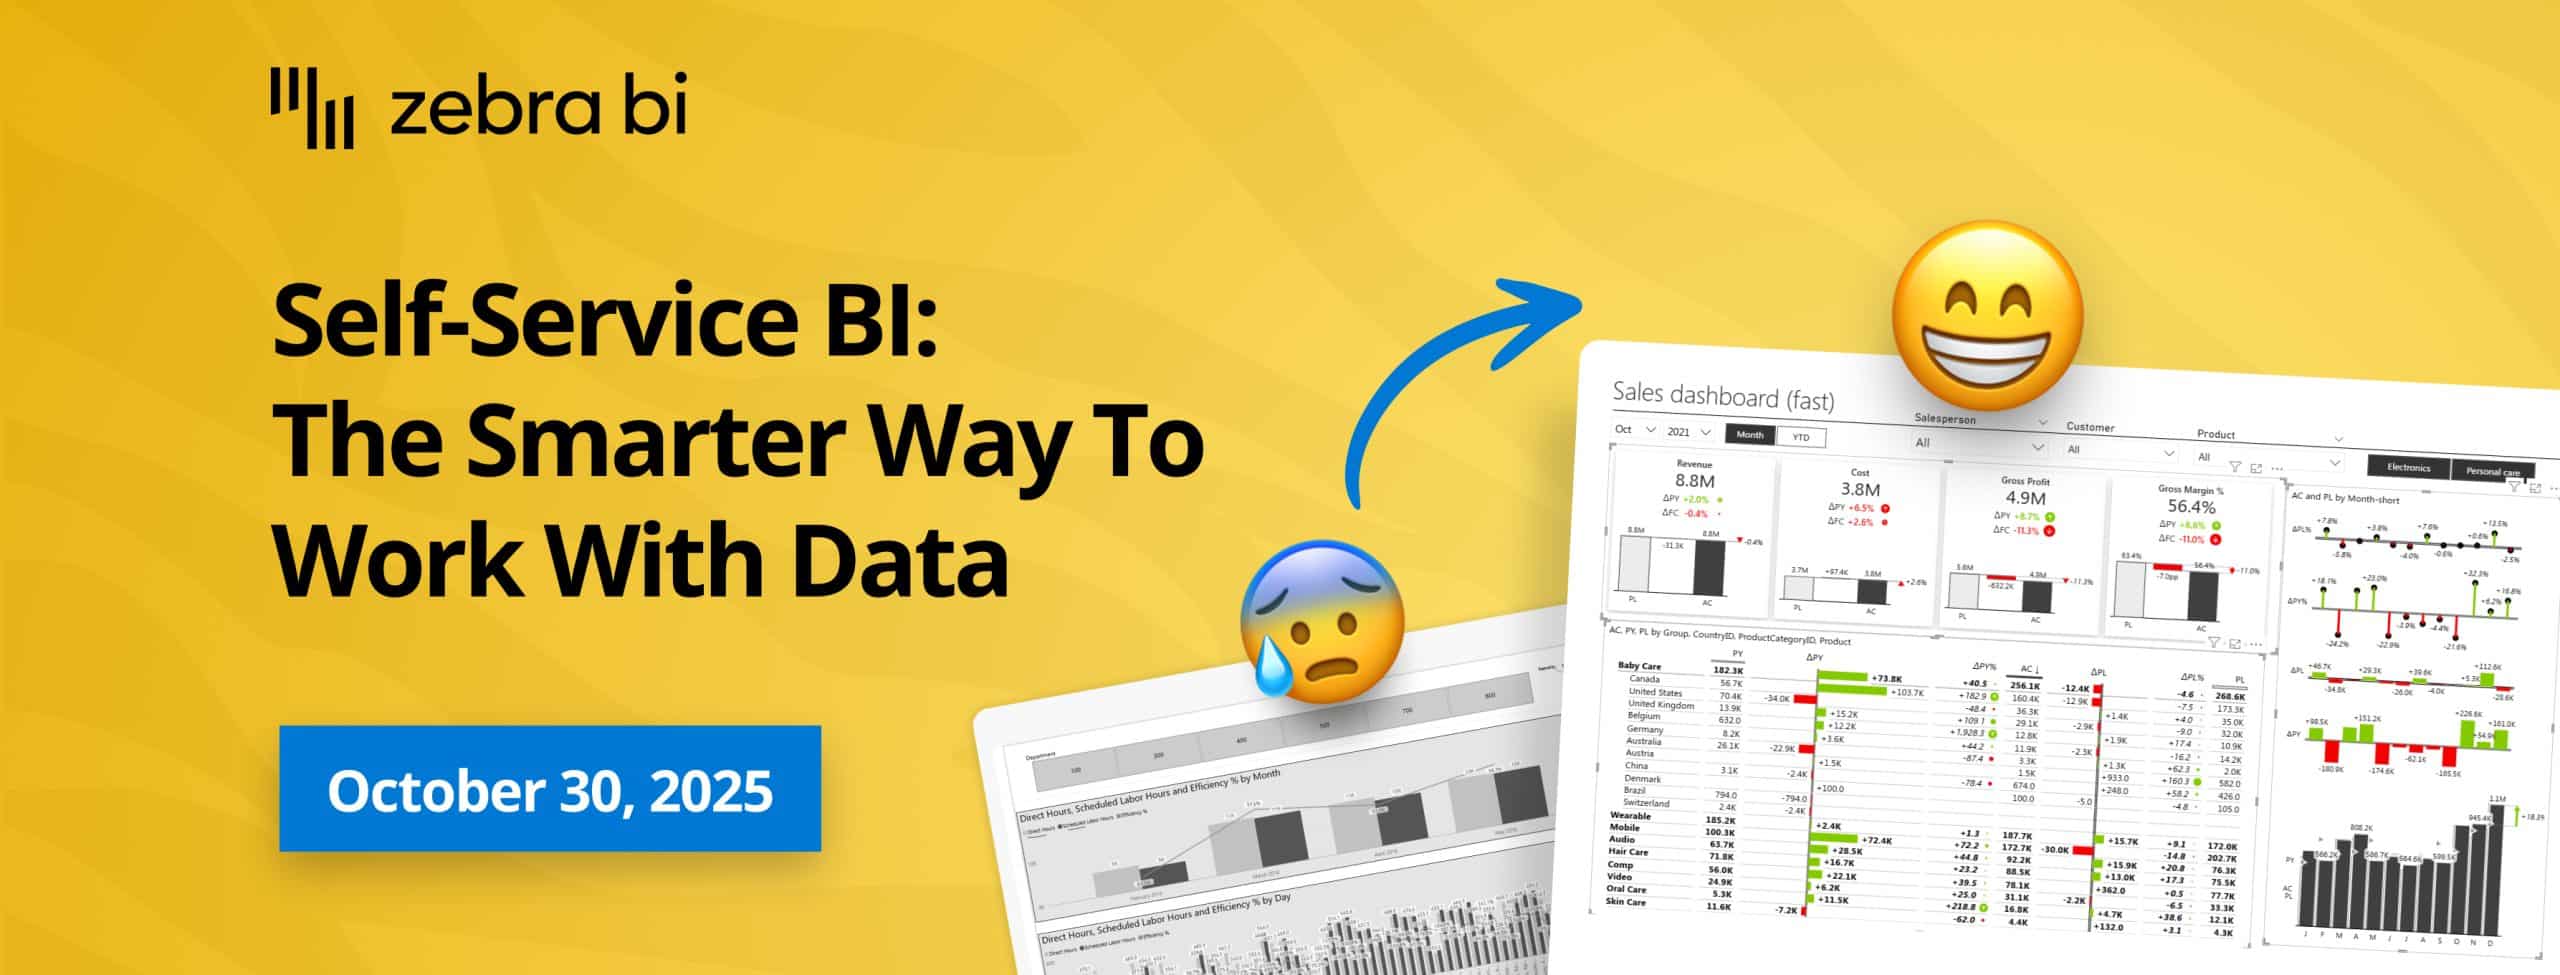
Self-Service BI: The Smarter Way to Work with Data
Join our live webinar to learn how to build a self-service BI environment that combines flexibility with a single source of truth. Discover how to balance freedom and governance, ensure data accuracy, and scale trusted, decision-ready analytics across your organization.
Watch now
September 30, 2025
Stop Creating Standard Reports: Build Dashboards that Drive Action
Discover how to speed up your Power BI reports and dashboards using proven best practices. In this free webinar, Zebra BI’s experts will show you how to optimize your data model, streamline visuals, and cut report load time from 15 seconds to under 1. Join us and learn how to build faster, smarter reports that scale.
Watch now
September 3, 2025
Best Practices for Power BI Report Optimization: Build Faster, Smarter Power BI Reports
Discover how to speed up your Power BI reports and dashboards using proven best practices. In this free webinar, Zebra BI’s experts will show you how to optimize your data model, streamline visuals, and cut report load time from 15 seconds to under 1. Join us and learn how to build faster, smarter reports that scale.
Watch now
Browse All Resources