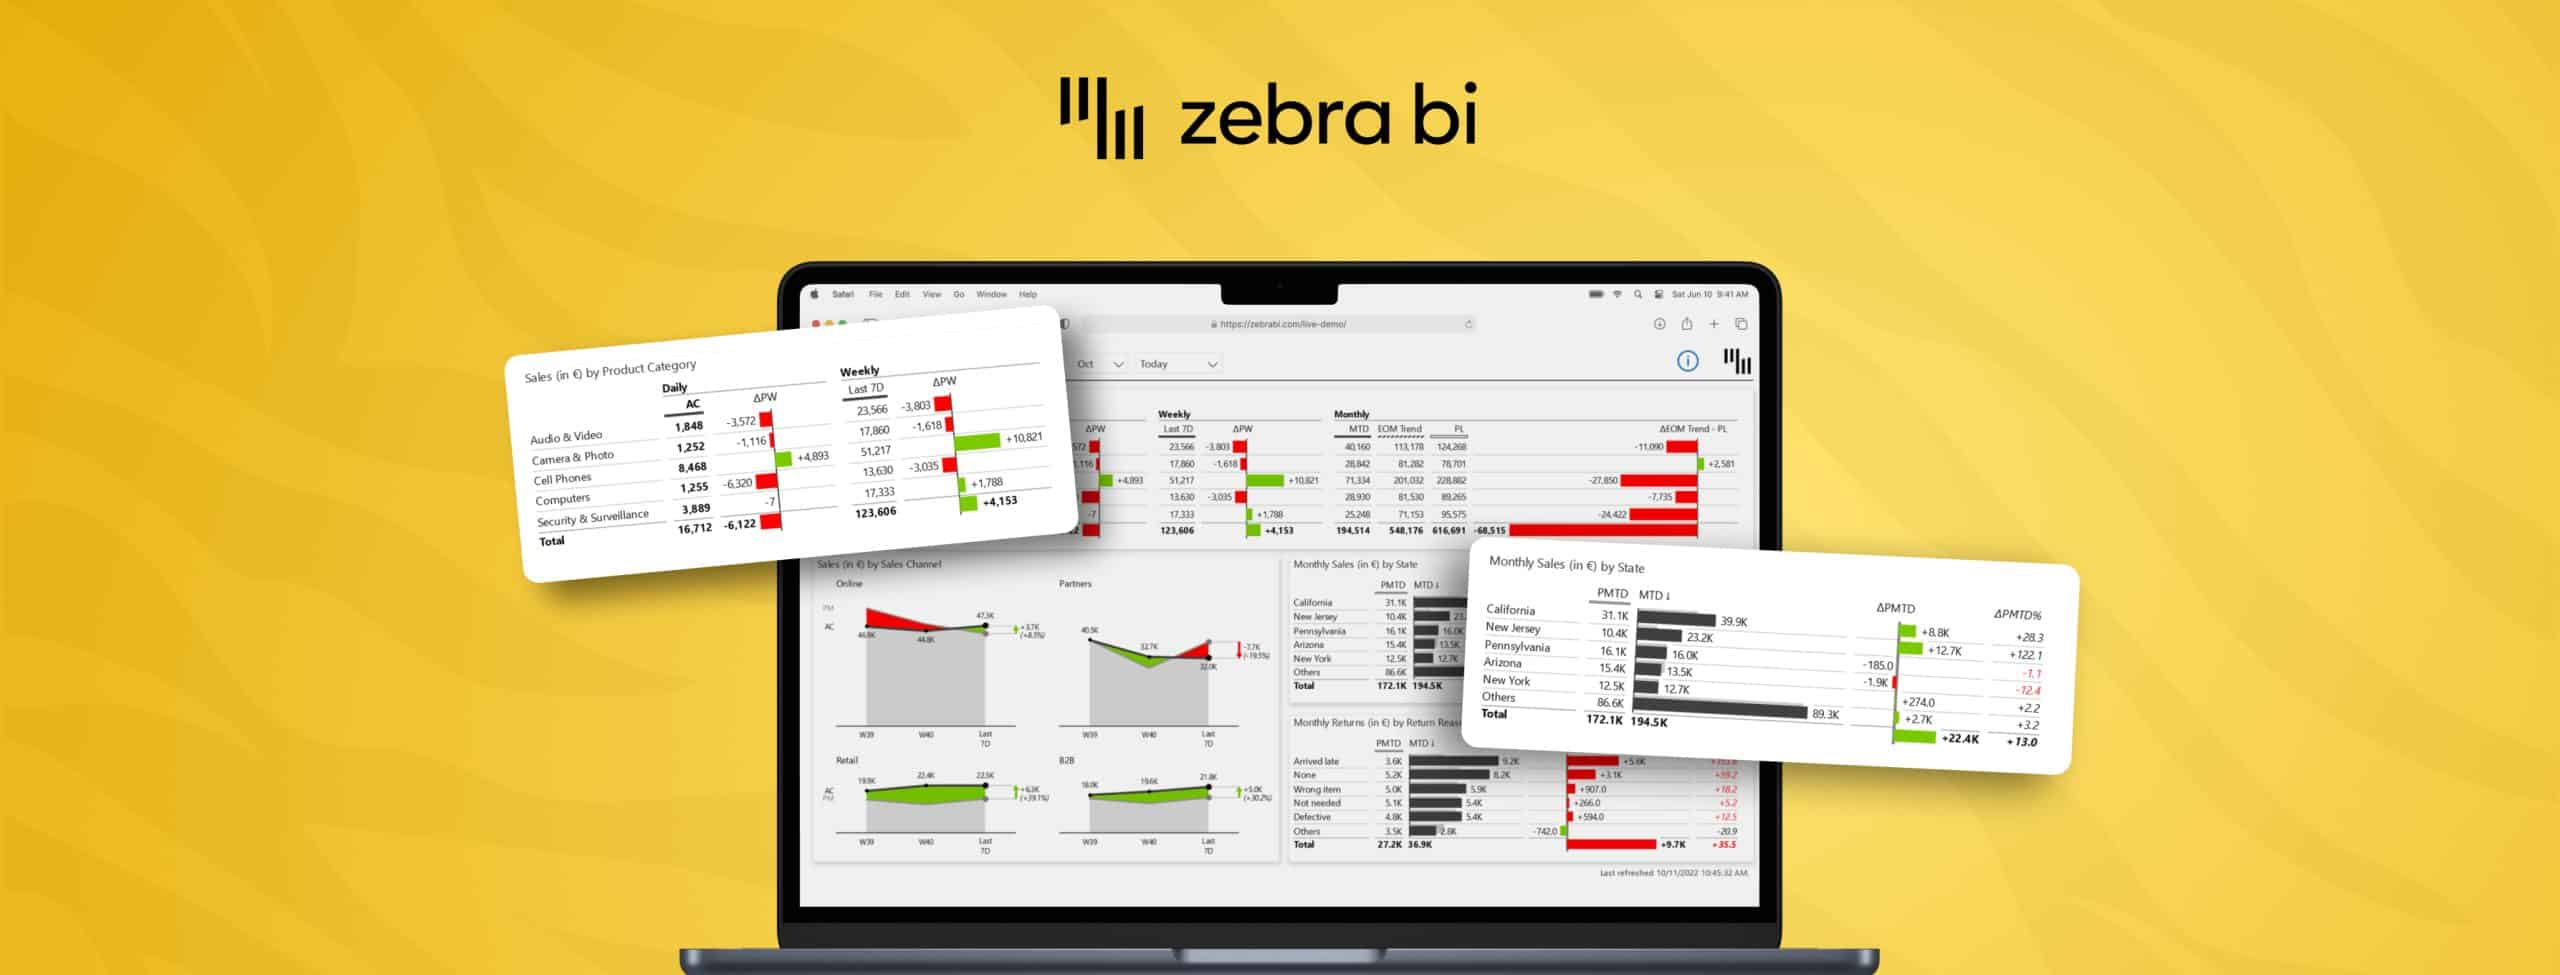
🔥 Black Friday Offer at Zebra BI
Explore the offer

Webinar recording
Zebra BI for Office 2.0 is now available!

Discover the future of Actionable Reporting in Excel and PowerPoint with Zebra BI for Office 2.0!

This game-changing upgrade is raising the bar once again, now bringing:

  • a never-before-seen feature for cross-filtering the visuals in Excel 🔥
  • an easy way to apply corporate branding to Excel dashboards & PowerPoint presentations across your entire organization
  • and enhanced productivity and reporting automation with data linking between Excel and PowerPoint

Watch this webinar to learn all about the ground-breaking new features.

What's included

Full video recording
Demo files used in Webinar
Enjoy & thank you for watching! Don't hesitate to reach out if you have any questions — write to us at support@zebrabi.com!

Presenter

Andrej Lapajne

Founder & CEO at Zebra BI

Watch the Video

Get demo files used in webinar
You can download Demo files used in webinar.
Access the materials
00:00:00 Intro
00:10:06 Styling / Corporate branding
00:23:40 Visual filtering in Excel
00:32:26 Linking PowerPoint slides to Excel
00:51:31 Getting started with Zebra BI for Office for free
00:52:55 Q&A session
01:14:55 Wrap-up
Share this

Your Questions

Here are some of the questions that came up during our live session. Thank you for being such a proactive audience. Have more questions? Drop us a note at support@zebrabi.com!
Is it possible to connect a presentation with a Pivot table?

Not yet unfortunately. At the moment it is possible to link Zebra BI visuals to ranges in Excel and to Excel tables. But not to pivot tables. At the moment this is simply not supported by Microsoft. But we are working together with Microsoft to solve this problem.

What if a user wants to use their own theme and not the corporate brand that is set? Can they import a JSON file versus to the predefined theme?

At the moment, we only support one corporate theme. So it's one theme for the whole company, basically for the whole domain. However, with the next releases we are planning to support multiple styles.

Is it better for reports to have a unifed style or own theme?

The idea is unification of reports so that they're legible for everyone and just doing this once for as much users as possible. Because this is actually solving the problem of reporting.

If you connect to an Excel file that has a connection to a Power BI data set with row level security enabled, would opening the PowerPoint then force Excel to refresh and use the row level security?
Because currently we can not support Pivot tables this fails. However, that's why we would love to directly access Pivot tables, and we are working along with Microsoft to solve this problem in the next updates.

Ready to start uncovering actionable insights from your data?

Explore Zebra BI for Office and Power BI, or start a trial instantly and test our tools on your data. You can also contact us to help you build your first test report and create a custom package for your business.

More Trending Webinars

November 6, 2025
Zebra BI Partner Pulse Webinar
A new webinar series for Zebra BI partners — get the latest updates, explore new tools, and stay closely connected with the Zebra BI team.
Watch now
October 30, 2025
Self-Service BI: The Smarter Way to Work with Data
Join our live webinar to learn how to build a self-service BI environment that combines flexibility with a single source of truth. Discover how to balance freedom and governance, ensure data accuracy, and scale trusted, decision-ready analytics across your organization.
Watch now
September 30, 2025
Stop Creating Standard Reports: Build Dashboards that Drive Action
Discover how to speed up your Power BI reports and dashboards using proven best practices. In this free webinar, Zebra BI’s experts will show you how to optimize your data model, streamline visuals, and cut report load time from 15 seconds to under 1. Join us and learn how to build faster, smarter reports that scale.
Watch now
September 3, 2025
Best Practices for Power BI Report Optimization: Build Faster, Smarter Power BI Reports
Discover how to speed up your Power BI reports and dashboards using proven best practices. In this free webinar, Zebra BI’s experts will show you how to optimize your data model, streamline visuals, and cut report load time from 15 seconds to under 1. Join us and learn how to build faster, smarter reports that scale.
Watch now
July 10, 2025
Future-Proof Financial Reporting: Automate, Standardize, and Scale with Power BI
Learn how to automate and standardize P&L, BS & CF reports in Power BI with Zebra BI — no copy-paste, broken links, or inconsistent KPIs.
Watch now
May 28, 2025
Beyond Excel: How Modern CFOs Leverage Power BI and AI for Better Insights
Modern CFOs are moving beyond spreadsheets to lead with data. In this webinar, you’ll learn how Power BI and AI are transforming financial reporting—turning static numbers into strategic insights.
Watch now
Browse All Resources