Financial Analysis & Benchmark Power BI Template (100 Companies)

Overview
Get a complete view of how the world's biggest companies perform, and how your own numbers compare. Analyze 5 years of reported financials for 100 companies, benchmarked across competitors and industries. Already modeled, so you don't have to pull filings or rebuild comparison tables by hand.
- Analyze real, reported financials, not sample data
- Benchmark competitors and industry leaders side by side
- See how your own results stack up against the leaders
- Rebuild the same analysis for your own competitors, with your own data
Inside this template
Compare companies, industries, and years in one report
This Financial Analysis and Benchmarking template is a ready-to-use dashboard in Power BI, built on the real, reported financials of 100 of the world's biggest companies. It helps you understand not just how a company performed, but how it compares across competitors, industries, and five years of results.
Instead of scraping filings and rebuilding models by hand, this Power BI financial analysis dashboard brings real company financials into one clear, interactive report, a financial analysis dashboard example you can benchmark against and reuse as a template for your own competitive analysis.
Questions this template helps you answer:
The financial benchmarking template connects the full picture, from revenue and margins to EBITDA, returns, and cash flow, and shows how those numbers differ across companies and industries.
By combining metrics, KPIs, variances, and 5-year trends, you can quickly answer questions like:
-
Are we outperforming the industry leaders, or just spending more to keep up?
-
Which competitors run the tightest margins, and where does the gap come from?
-
How does our cost structure compare with the benchmark?
-
Is our growth keeping pace with the industry, or quietly falling behind?
-
Are the performance gaps short-term swings or structural over five years?
The dataset supports company-vs-company comparison, industry benchmarking, and five-year trend analysis (2021 to 2025), so you can tell one-off movements apart from lasting shifts.
Who is this financial benchmarking template for?
Designed to support both strategic and hands-on financial analysis in one shared view:
- CFOs & finance leaders
Benchmark your company's performance against the industry leaders using margins, EBITDA, ROIC, and growth, with clear variances to peers and prior years. - FP&A Analysts & controllers
Compare competitors side by side, find where your cost structure or margins diverge from the benchmark, and fold the analysis into your own reporting. - BI analysts & consultants
Start from a real, fully modeled dataset. Prototype a benchmarking report on companies everyone knows, then rebuild it for your own competitive set or your clients' data.
Benchmarking insights this template provides:
Using this financial benchmarking dashboard, you can:
-
Compare competitors across revenue, gross margin, EBITDA, returns, and cash flow
-
Benchmark your own results against the industry leaders
-
Track 5-year trends (2021 to 2025) by company and by industry
-
See how the same metric behaves across all 6 industries
-
Test AI on a real P&L, safely, using Zebra AI on data that isn't yours
-
Rebuild the whole analysis for your own competitors, with your own data
Built-in variances, difference highlights, and annotations make it easy to explain why the numbers differ, not just that they do.
Inside the report: a page-by-page breakdown:
The template ships as a multi-page Power BI report, each focused on a core benchmarking question:
-
Financials
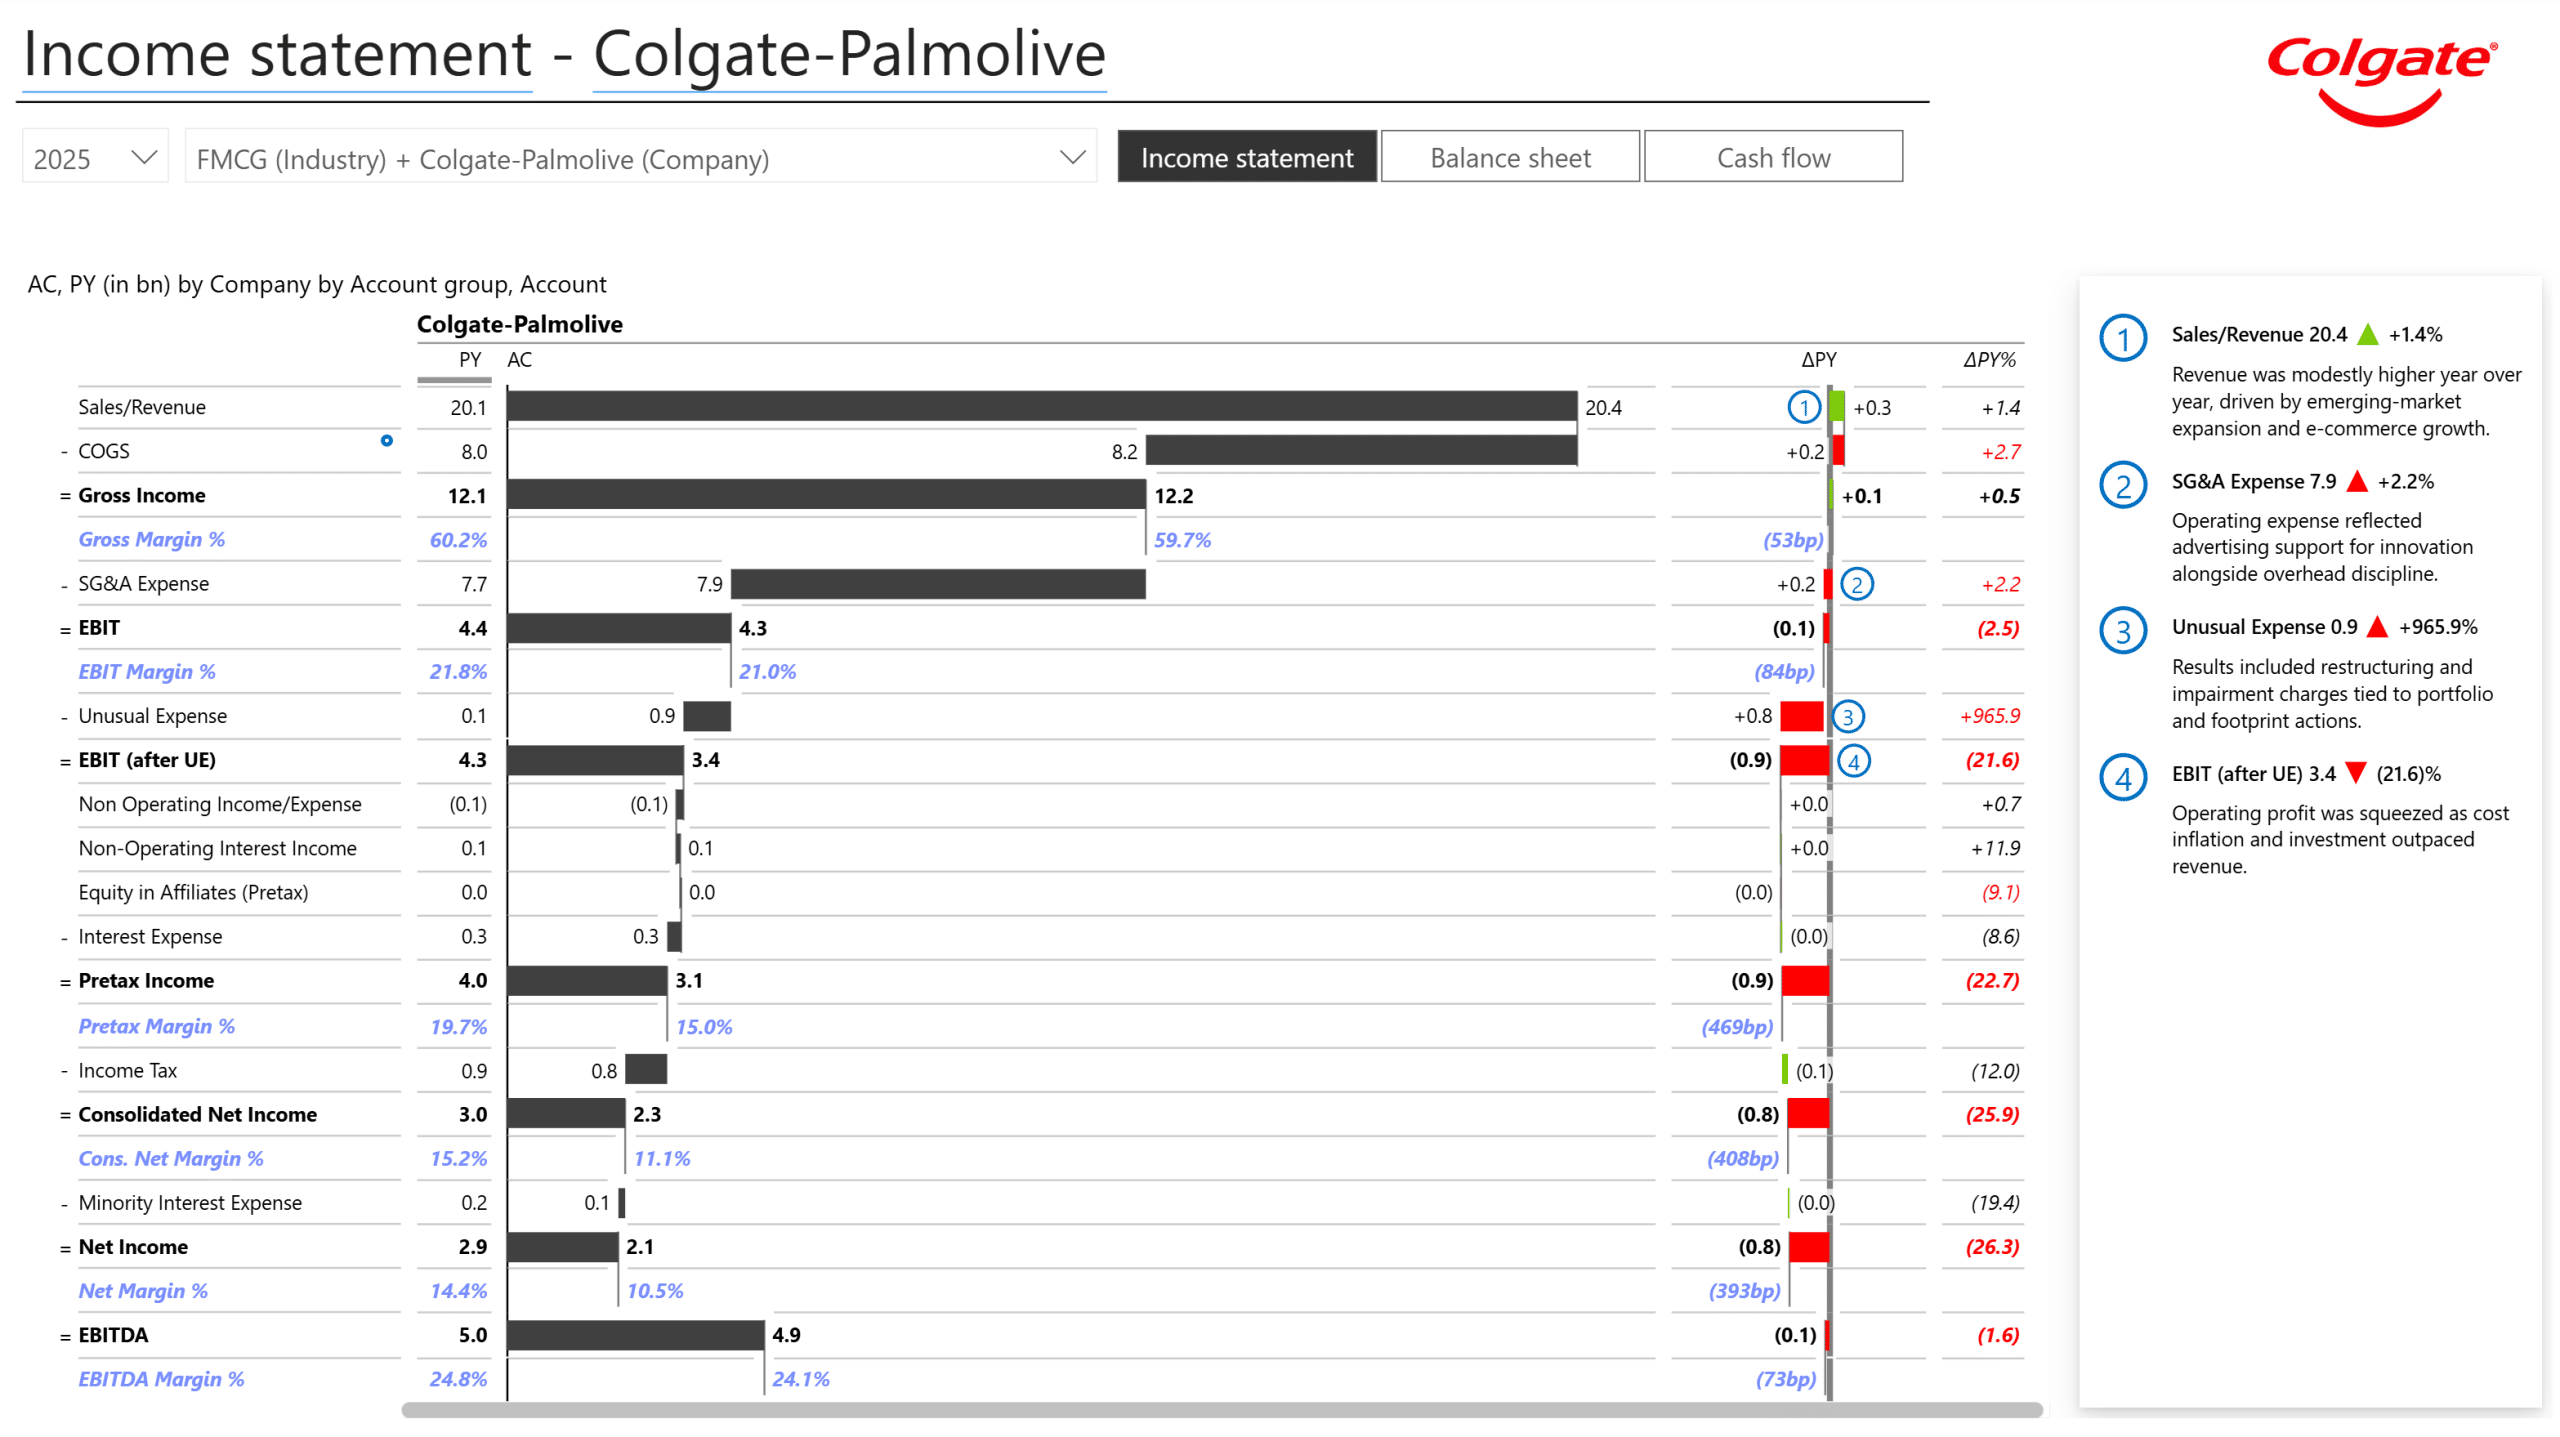
It shows one company's full income statement, balance sheet, and cash flow in an IBCS-standard table, with an integrated waterfall chart and a written commentary panel explaining the key moves in plain language, and hover tooltips that pop up a multi-year trend for any line. - Comparison tab
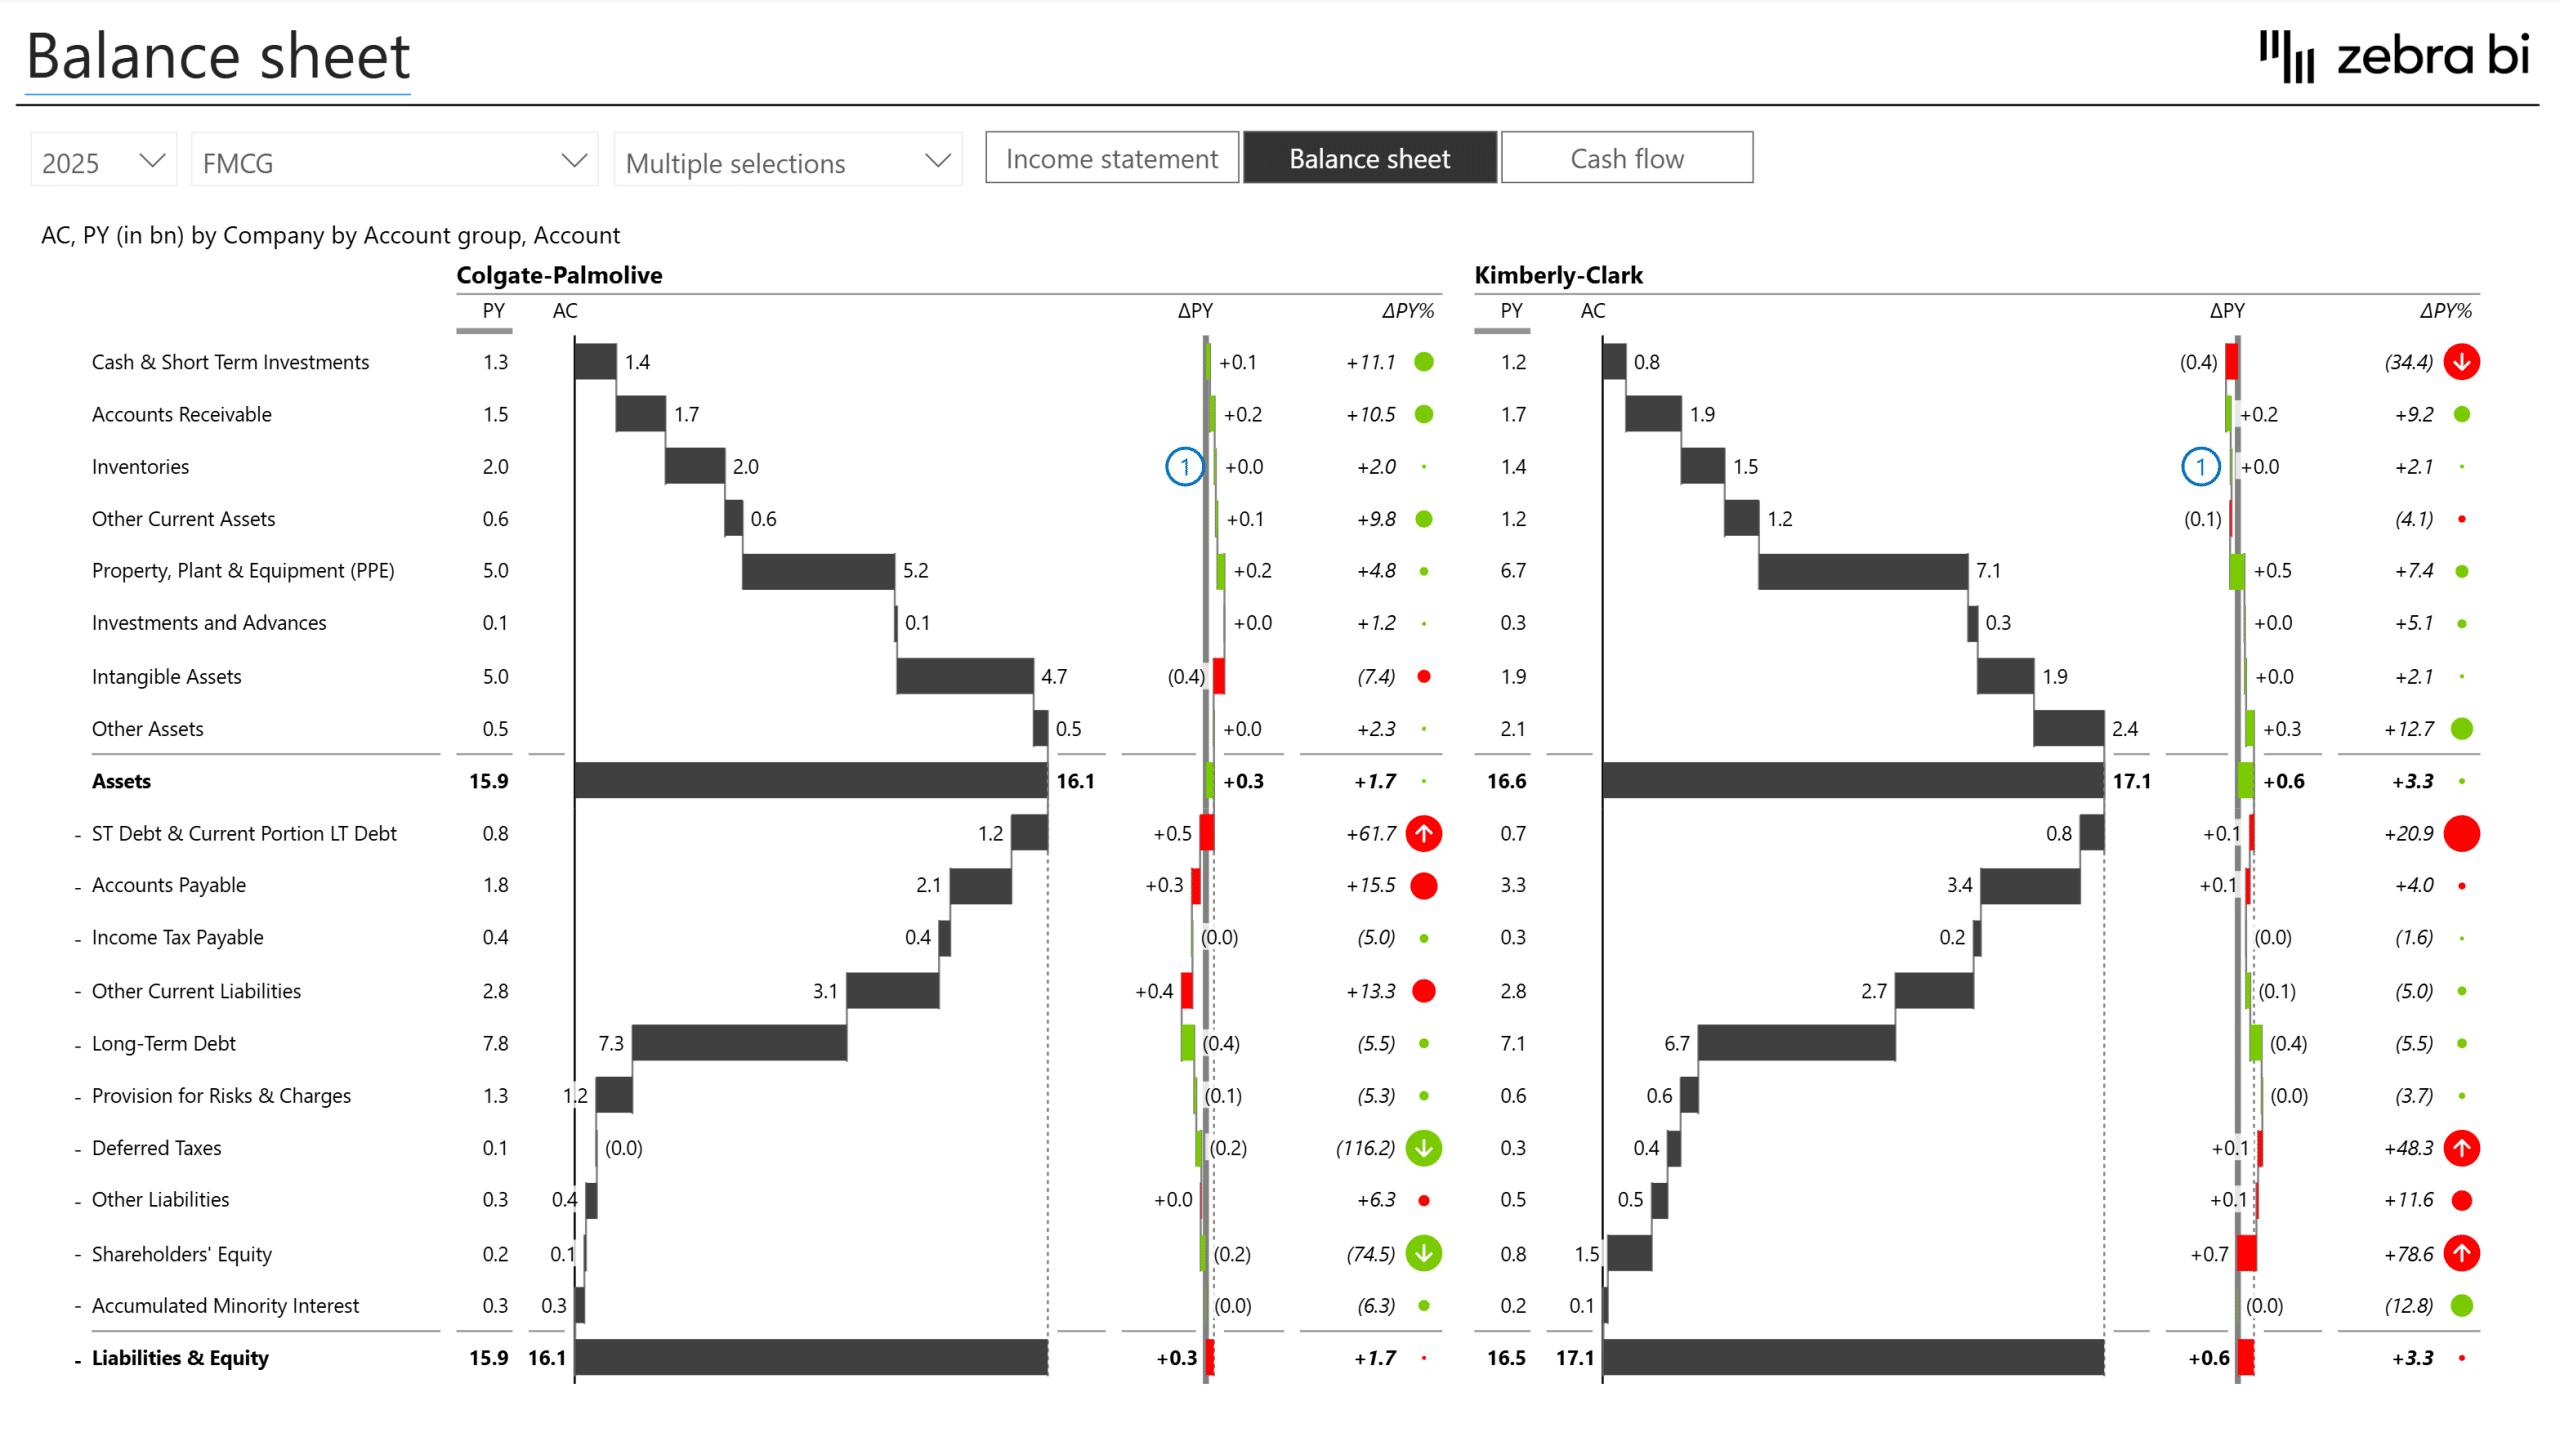
Put two or more companies' full statements side by side, line for line, each with its own variance to the prior year. Compare peers (Colgate against Kimberly-Clark, say) at the account level, not just on headline numbers. -
Annual statements
Read the trajectory line by line, with margins and EBITDA already built in. It's the same full statements for one company across multiple years, side by side, each year against the prior one. -
Account trends
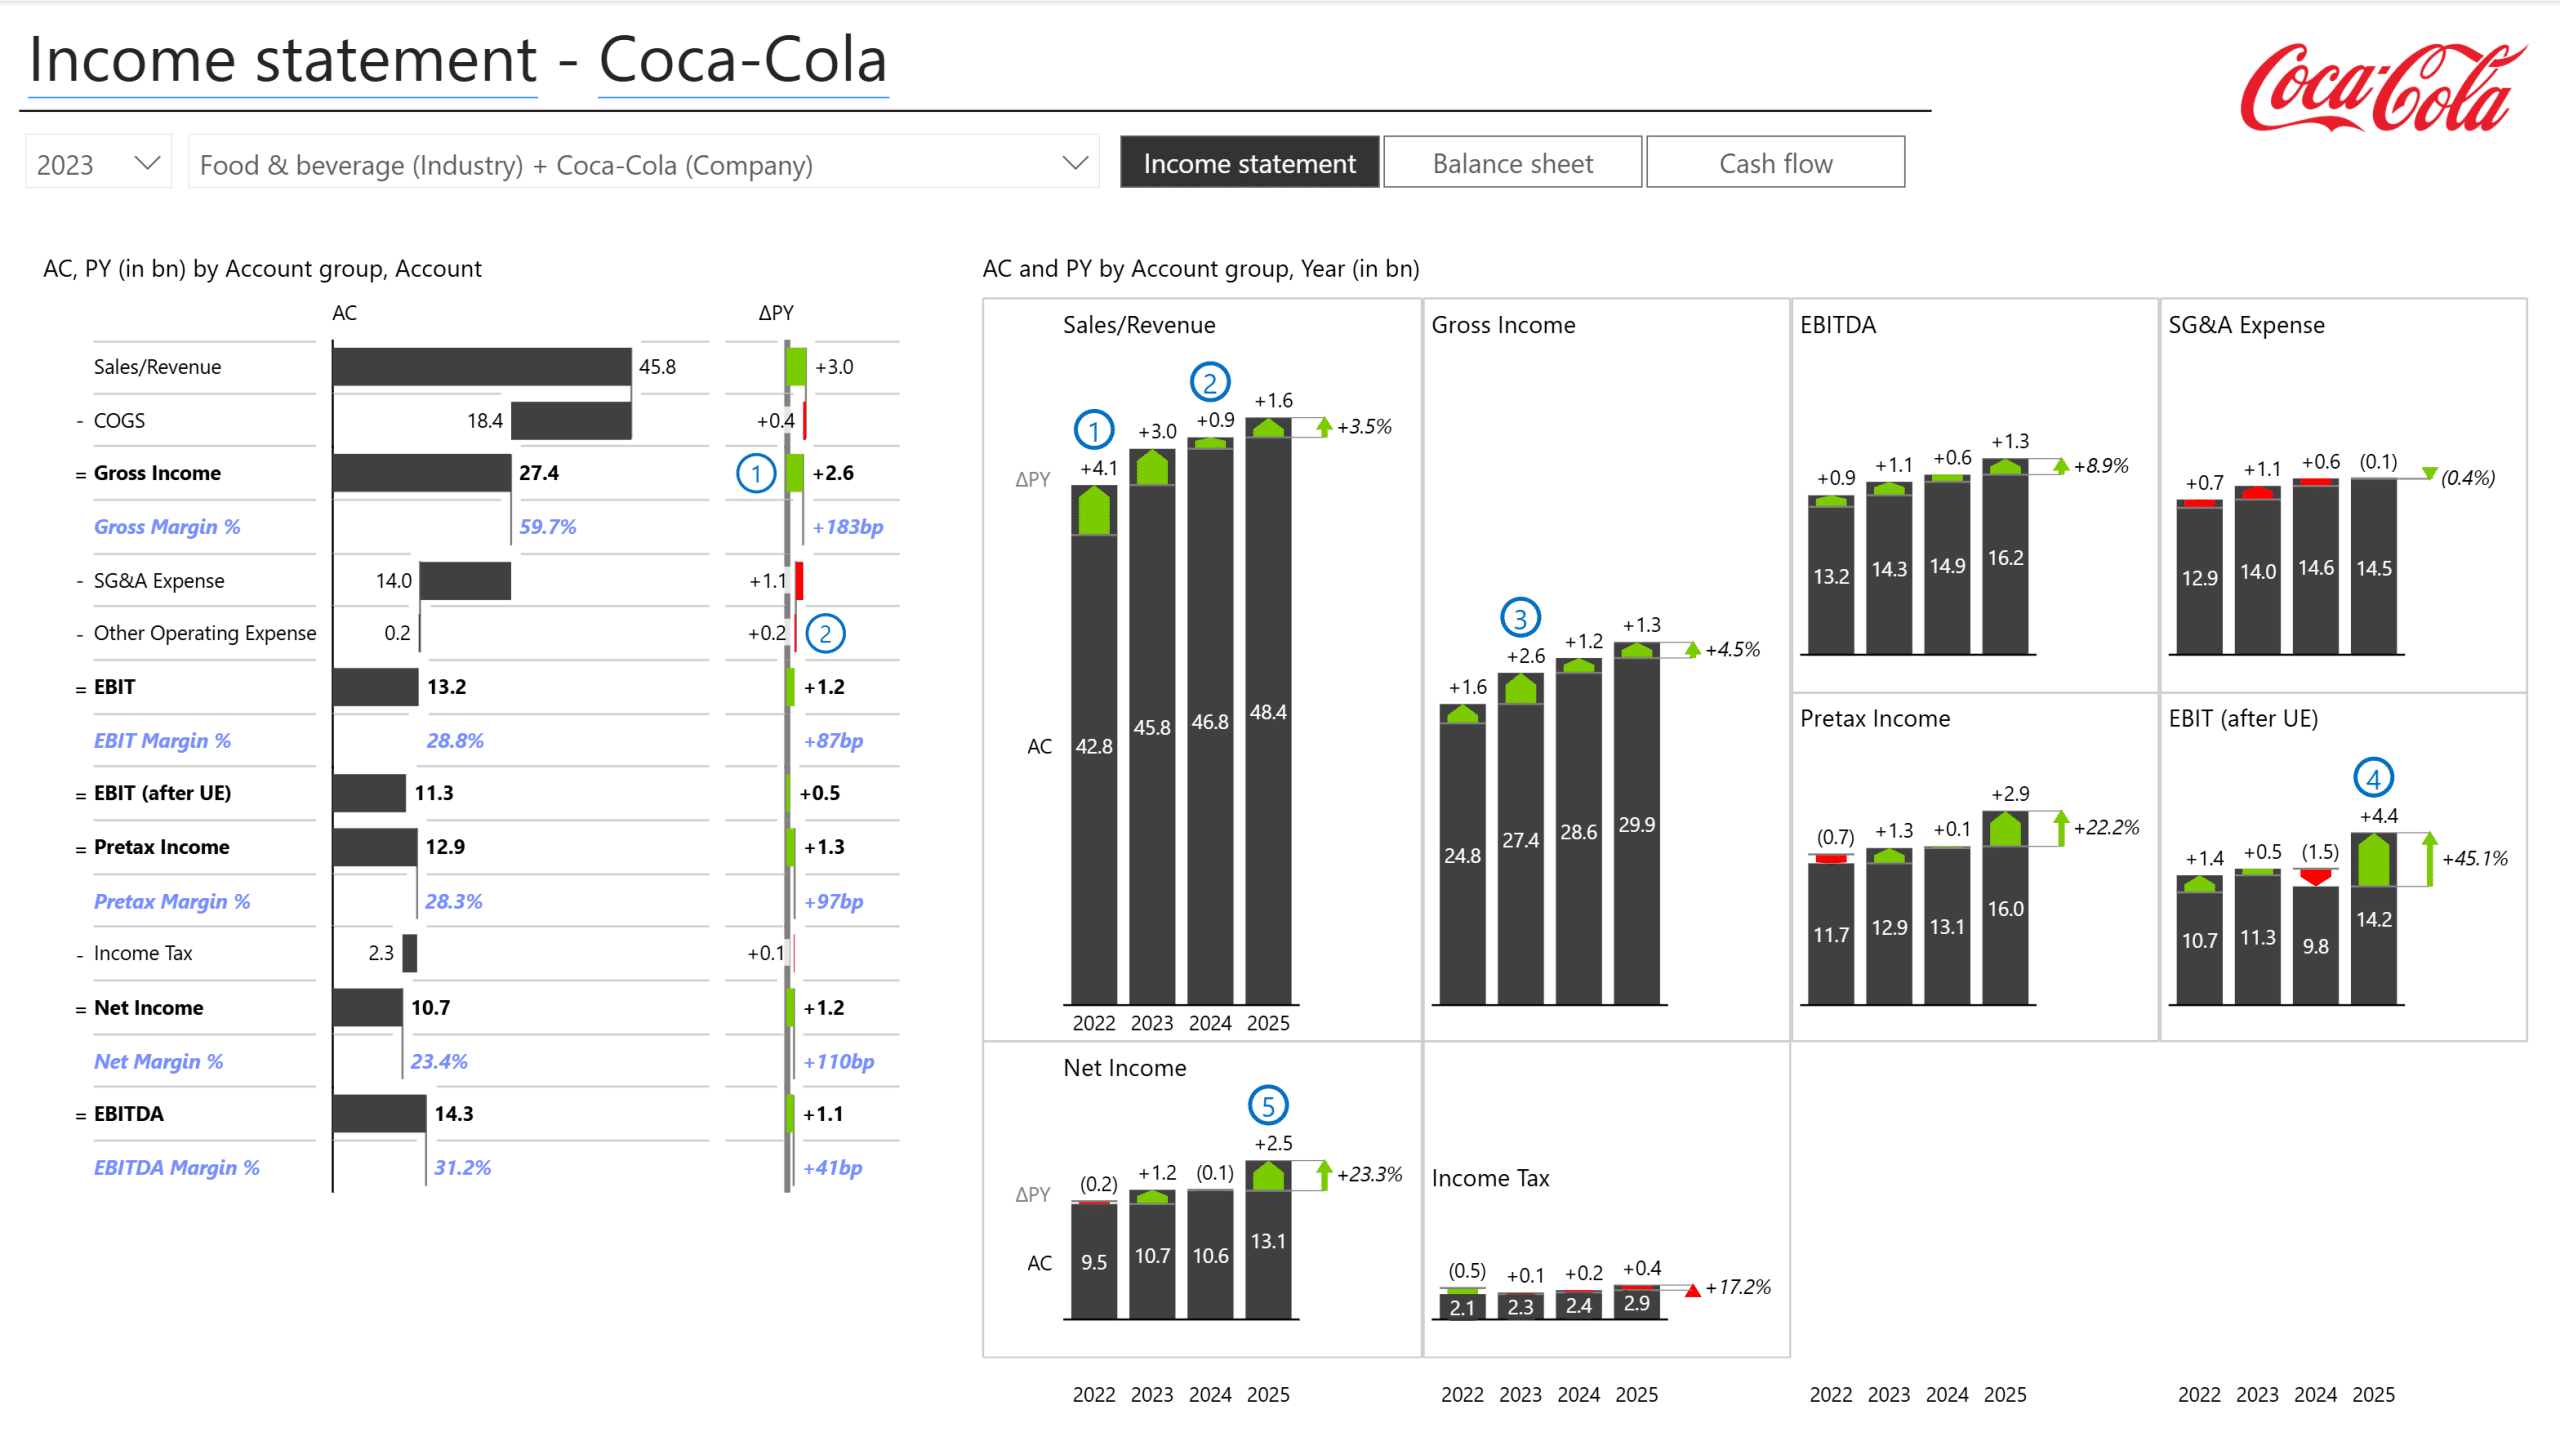
See how each line of the statement developed, not just where it landed. Take a single company and trend every account, revenue, gross income, SG&A, EBIT, EBITDA, and net income, as small multiples across the years. -
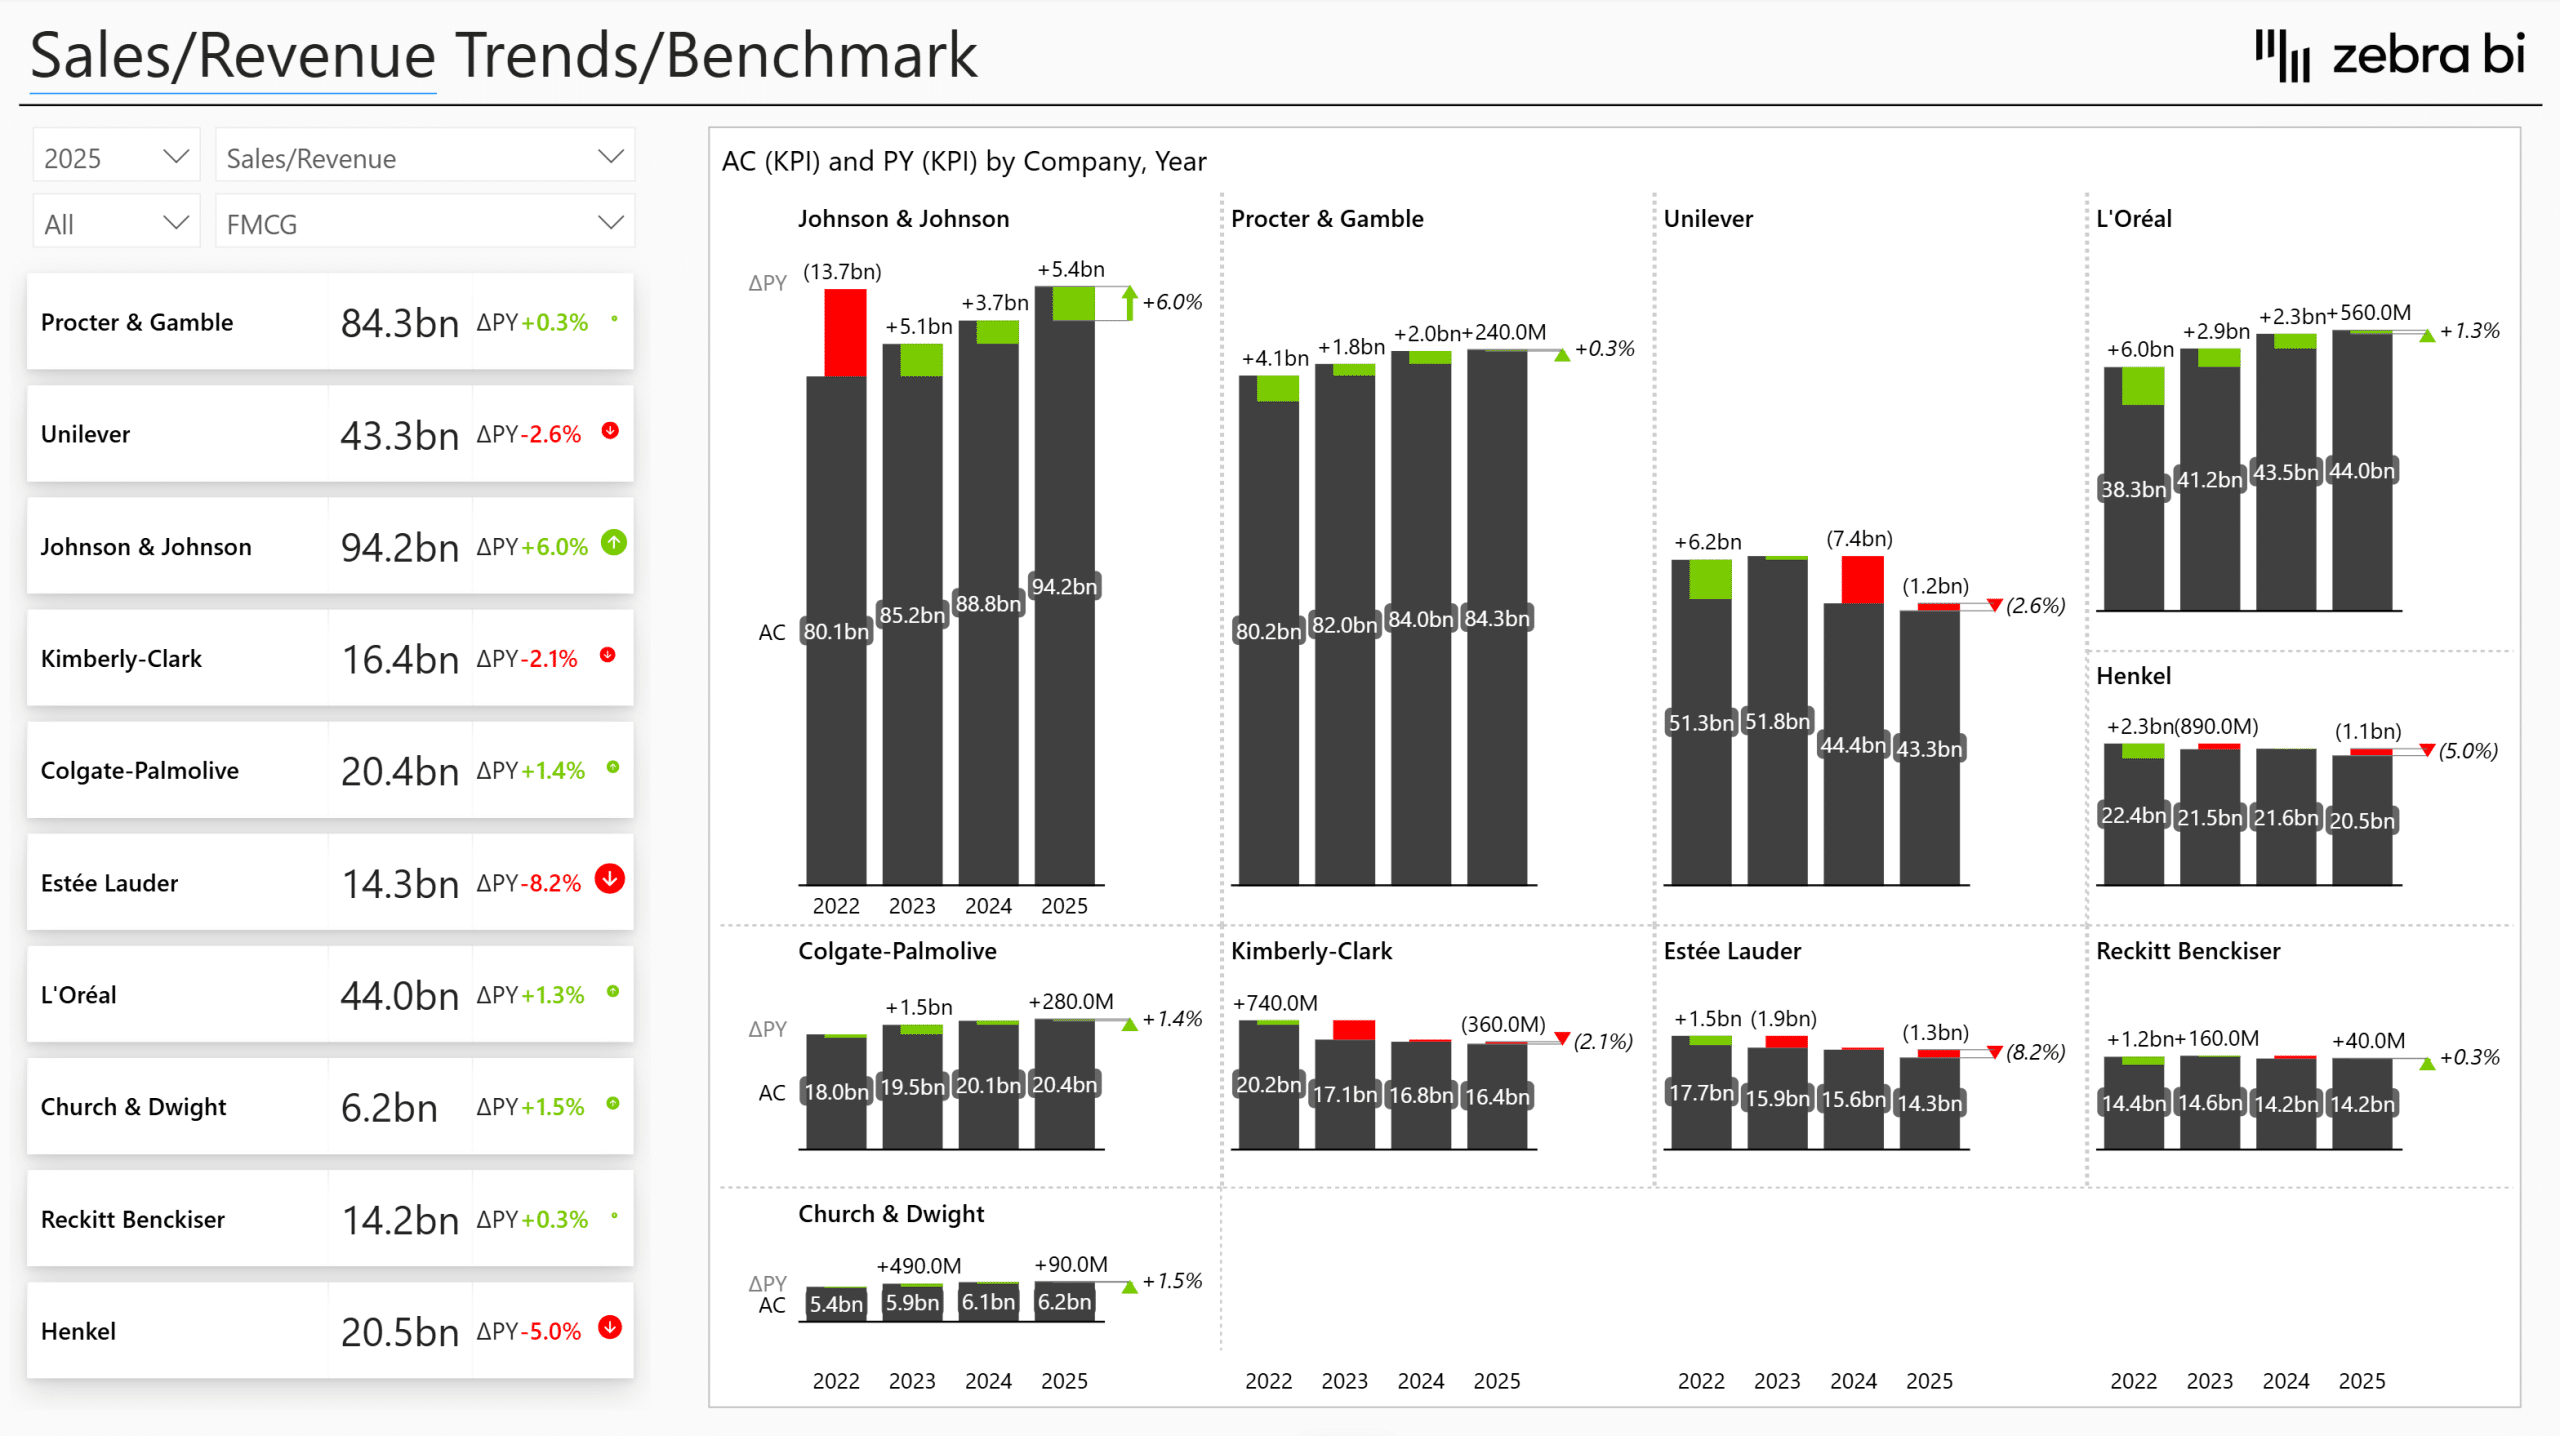
Comparison trends
Every company in an industry across the core metrics, as a small-multiples grid. Differences in revenue, gross income, EBITDA, EBIT, and net income jump out at a glance. -
KPI trends
Pick any KPI and rank the whole peer set by it. A card per company shows the latest value and change to prior year, with a small-multiple trend beside each. The fastest way to benchmark one metric across every competitor. -
KPI % trends
Compare profitability across companies as percentages, each with its own multi-year trend. It's the same benchmark view, but for ratio KPIs like EBITDA margin, gross margin, and net margin. -
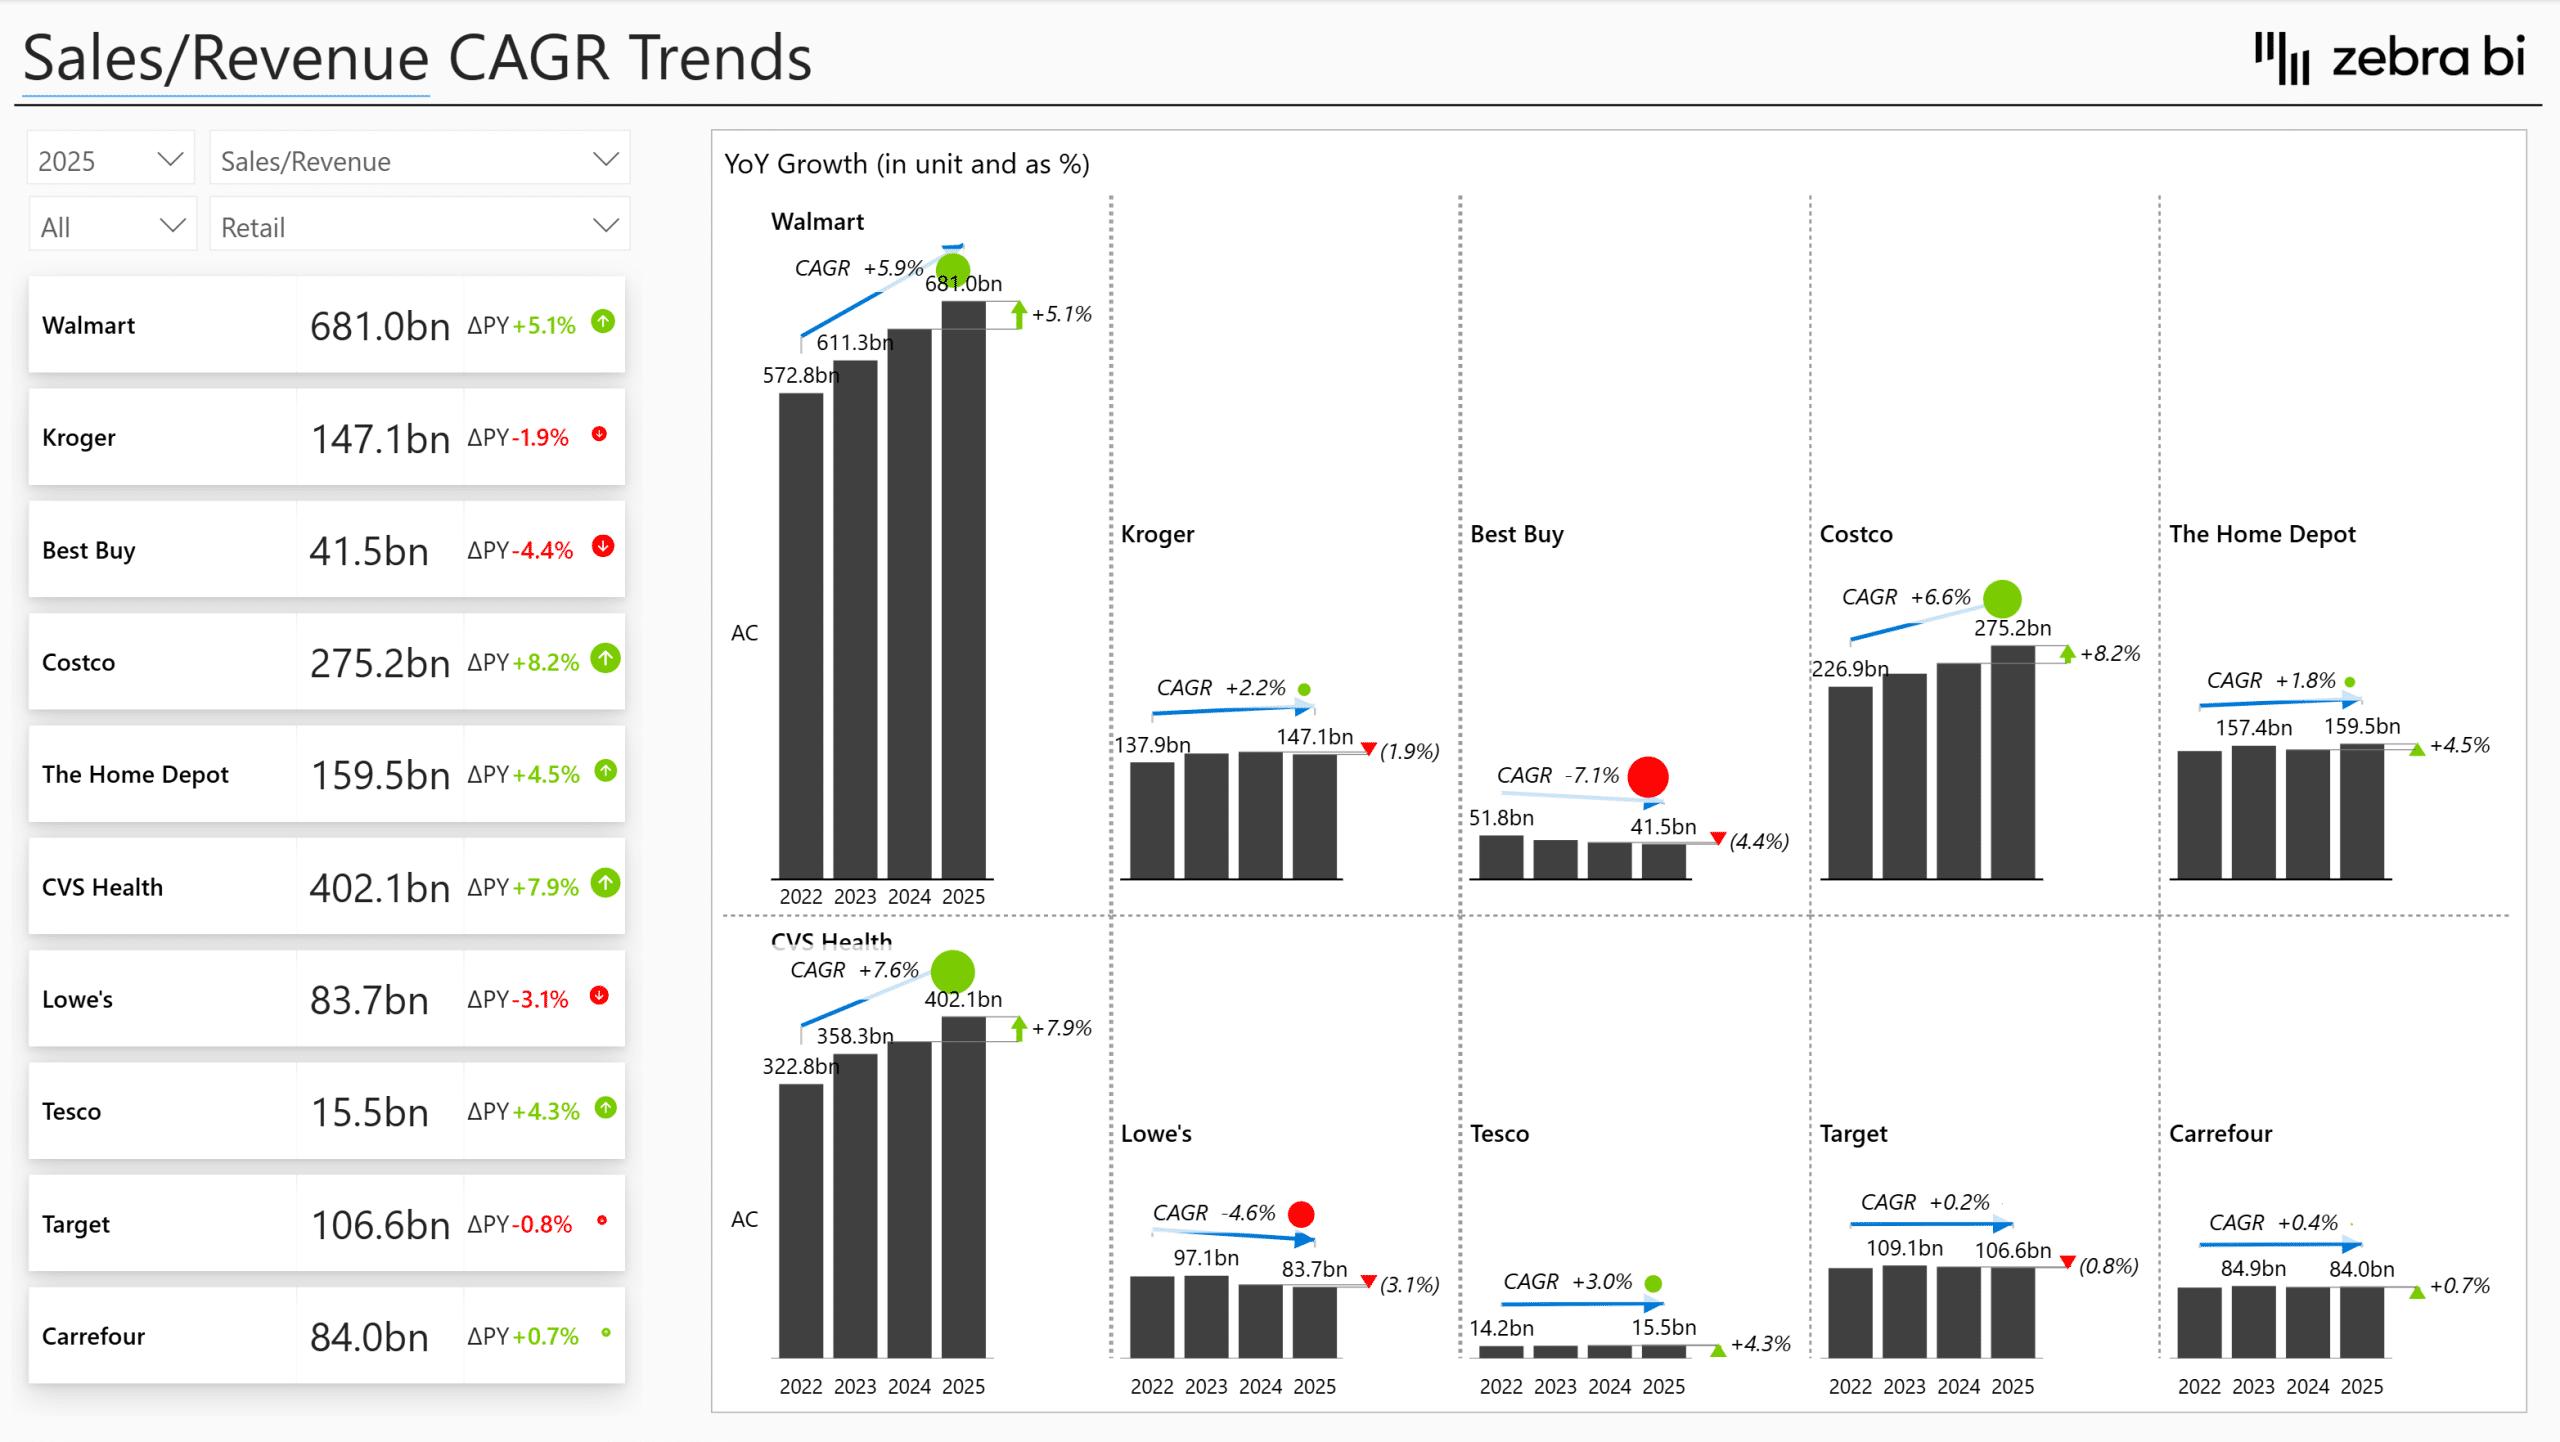
CAGR trends
Cut through the year-to-year noise and see each competitor's underlying trajectory. This report page shows the compound annual growth rate for the selected metric across the full window for each company. -
KPI Comparison
A single-company scorecard of every top-level KPI at once, across the income statement, balance sheet, and cash flow, from revenue and margins to net debt to EBITDA, working capital, inventory turnover, and free cash flow, each with its variance to the prior year in value and percent.
Built with Zebra BI visuals for Power BI
This Power BI marketing dashboard template is built using Zebra BI Tables, Charts, and Cards so you can create:
-
Automatic variance analysis (plan, prior period, prior year) with no custom DAX
-
See clear P&L waterfalls, bridges, and small multiples across companies
-
Track five-year rolling trends and compare industries at a glance
-
Trust transparent KPI calculations (margins, EBITDA, ROIC) you can inspect
-
Annotations and commentary for insight sharing
-
Filter interactively by company, industry, and year
- Connect Zebra AI (via Microsoft Fabric) to ask the data questions in plain language and get a finance-ready narrative, with the numbers calculated by deterministic tools, not guessed
You focus on the comparison and the decision, not on formatting or manual calculations.
Download the Financial Analysis & Benchmarking template
If you want a practical way to benchmark against real company financials in Power BI, compare competitors, and reuse the analysis for your own market, this template gives you a ready-made, fully modeled foundation to work from.
Download the Financial Analysis & Benchmarking template in Power BI and start comparing your numbers against the companies that set the standard.
Get started in 3 steps
Fill out the form and get the Power BI template