Modern CFOs are moving beyond spreadsheets to lead with data. In this webinar, you’ll learn how Power BI and AI are transforming financial reporting—turning static numbers into strategic insights.
Artificial Intelligence is transforming Business Intelligence and data analysis, offering powerful tools for data-driven decision-making. But where does AI fall short, and how can we bridge these gaps to maximize its potential?
Power BI can be a true game-changer for organizations looking to turn their data into actionable insights. But how do you leverage it to achieve its max potential -- and how do you make handling dashboards easier, more user-friendly, and more efficient? Join our FREE webinar and find out!
Master cost management with Zebra BI. Discover advanced techniques to optimize financial reporting, enhance budgeting accuracy, and make smarter, data-driven business decisions for long-term success.
Unlock the power of product portfolio analysis with Zebra BI in Power BI. Learn to visualize and analyze product performance, identify growth opportunities, and drive strategic business decisions with data-driven insights.
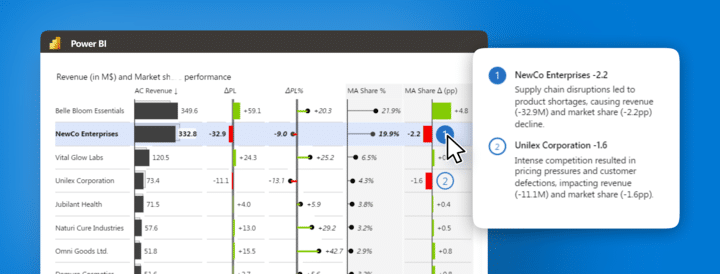
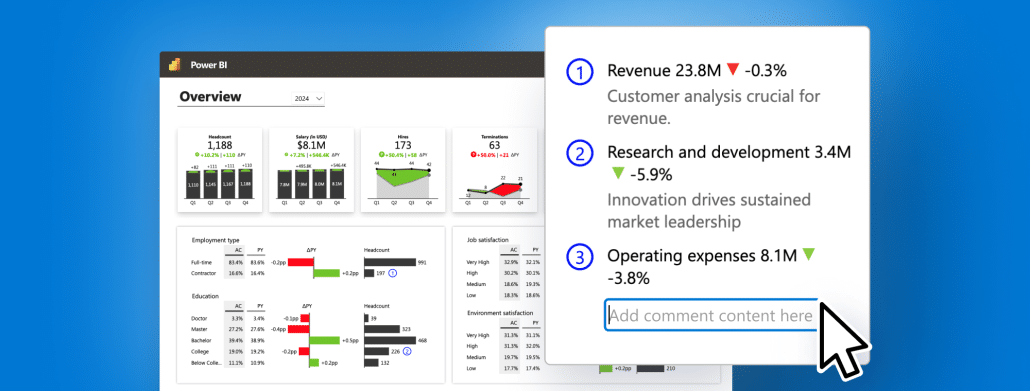
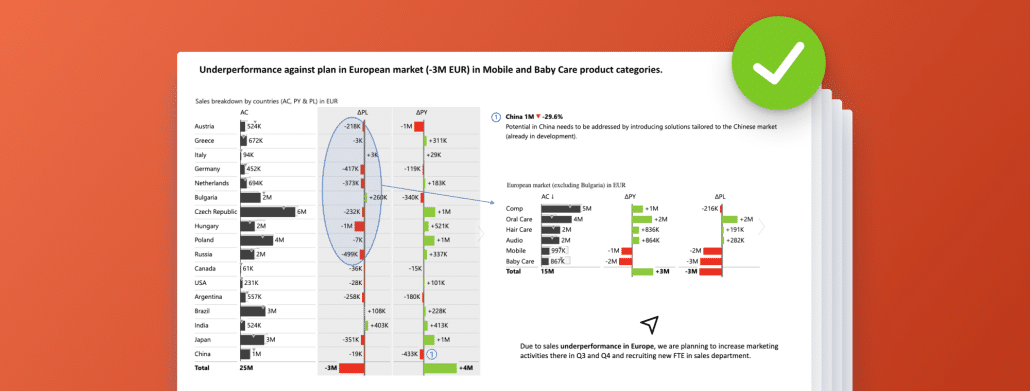
Join our webinar to explore the easiest way so far to do dynamic commentary in Power BI for clearer insights, quicker decisions, and smoother meetings.
Explore expert tips for creating professional PowerPoint for FP&A analysts. Learn to create consultant-level, visually engaging presentations efficiently.
 September 8th
 February 22nd