 September 8th
 February 22nd
 26 Feb 2026

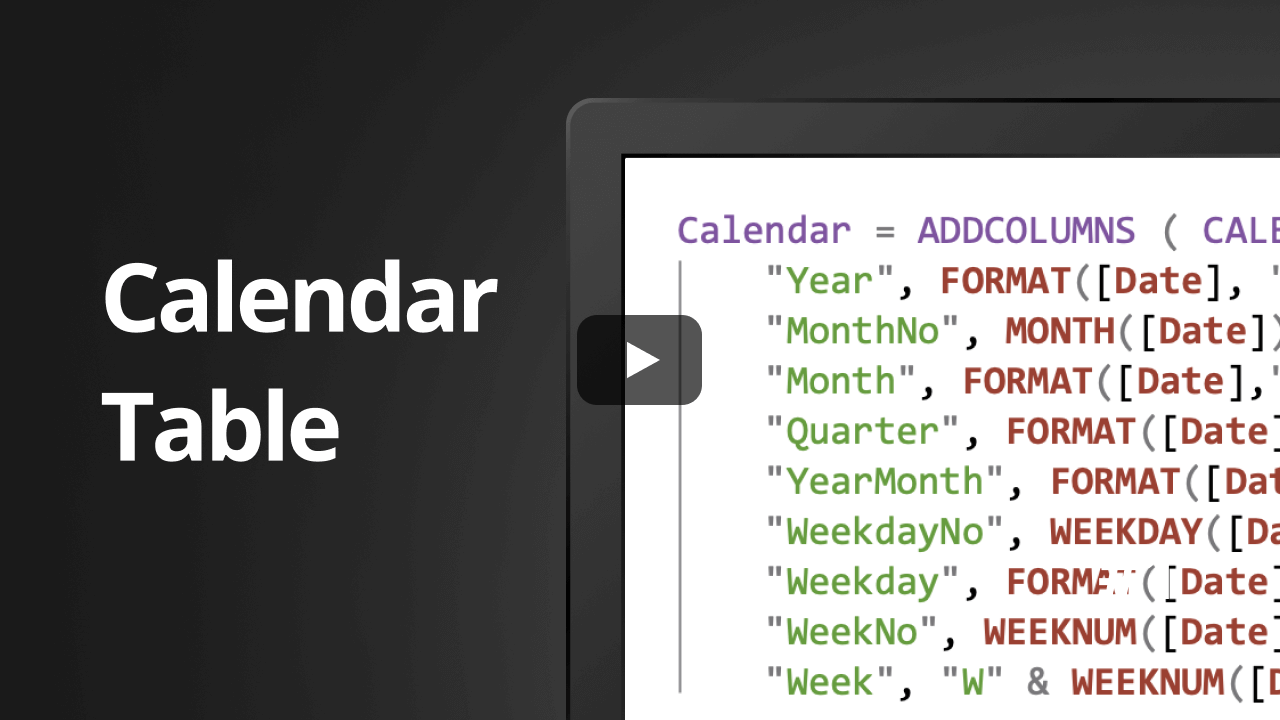
DAX code for creating the table:
Calendar = ADDCOLUMNS ( CALENDARAUTO (),
    "Year", YEAR([Date]),
    "MonthNo", MONTH([Date]),
    "Month", FORMAT([Date],"mmm"),
    "Quarter", FORMAT([Date],"QQ"),
    "YearMonth", FORMAT([Date],"YYYY-MM"),
    "WeekdayNo", WEEKDAY([Date],2), //1-Sun..Sat, 2-Mon..Sat
    "Weekday", FORMAT([Date],"ddd") )
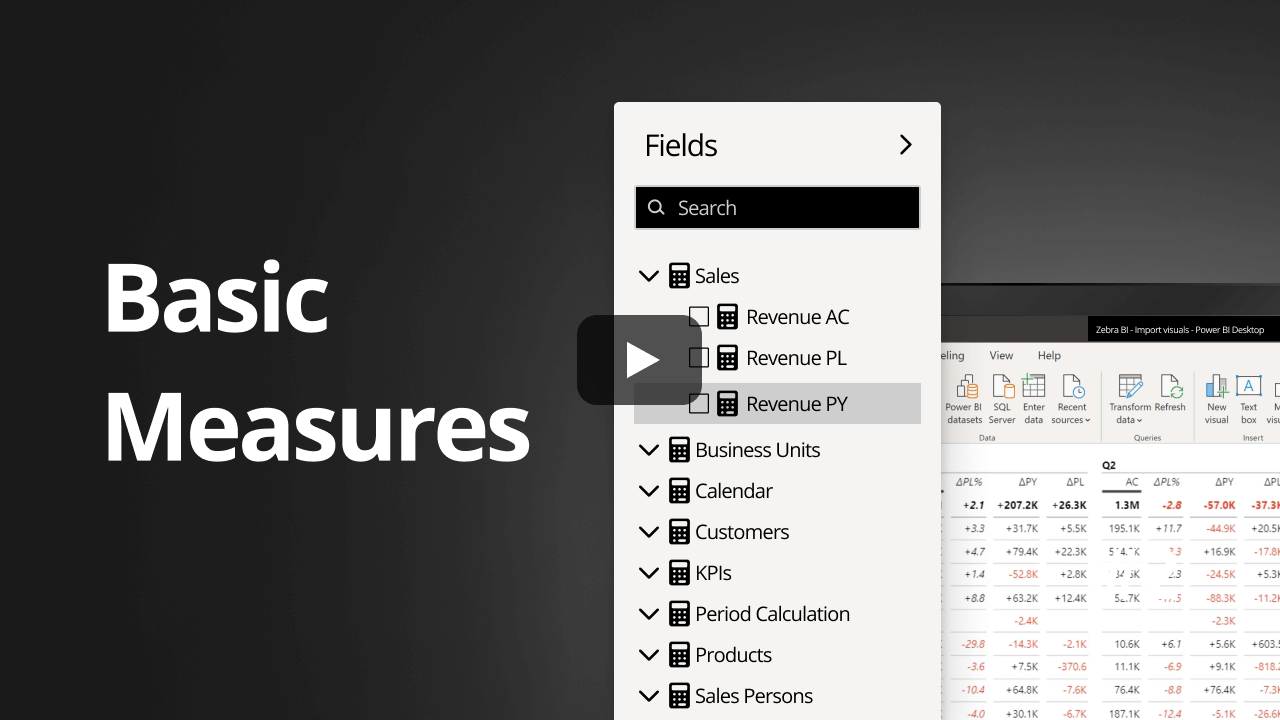
Zebra BI visuals are very flexible when trying to create different insights into your data, however, the true power is shown once we add in some comparison measures. Watch the video to learn how to create the basic measures needed for supercharging your dashboards with Zebra BI visuals.
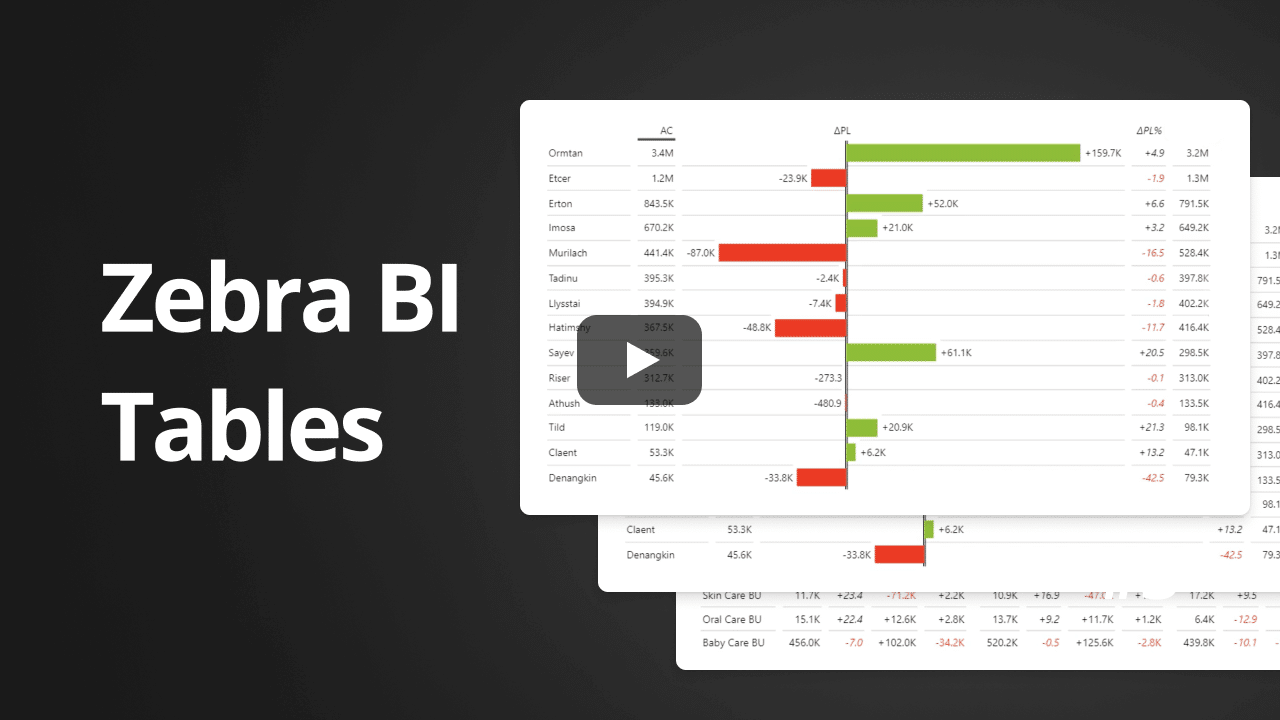
Zebra BI Tables is the most powerful and simple to use table visual available in Power BI Explore its primary features and see how you can use them to build the first part of your sales dashboard.
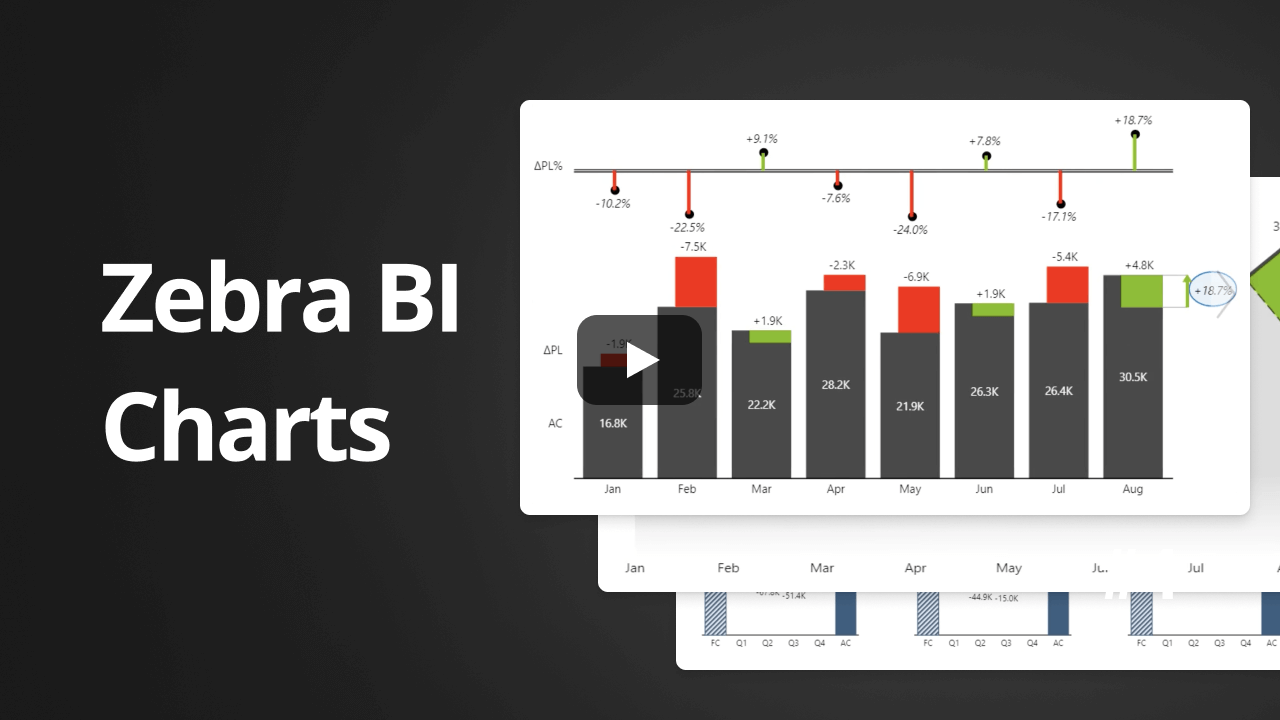
Complete the second part of your sales dashboard with the most versatile chart visual in Power BI - Zebra BI Charts.
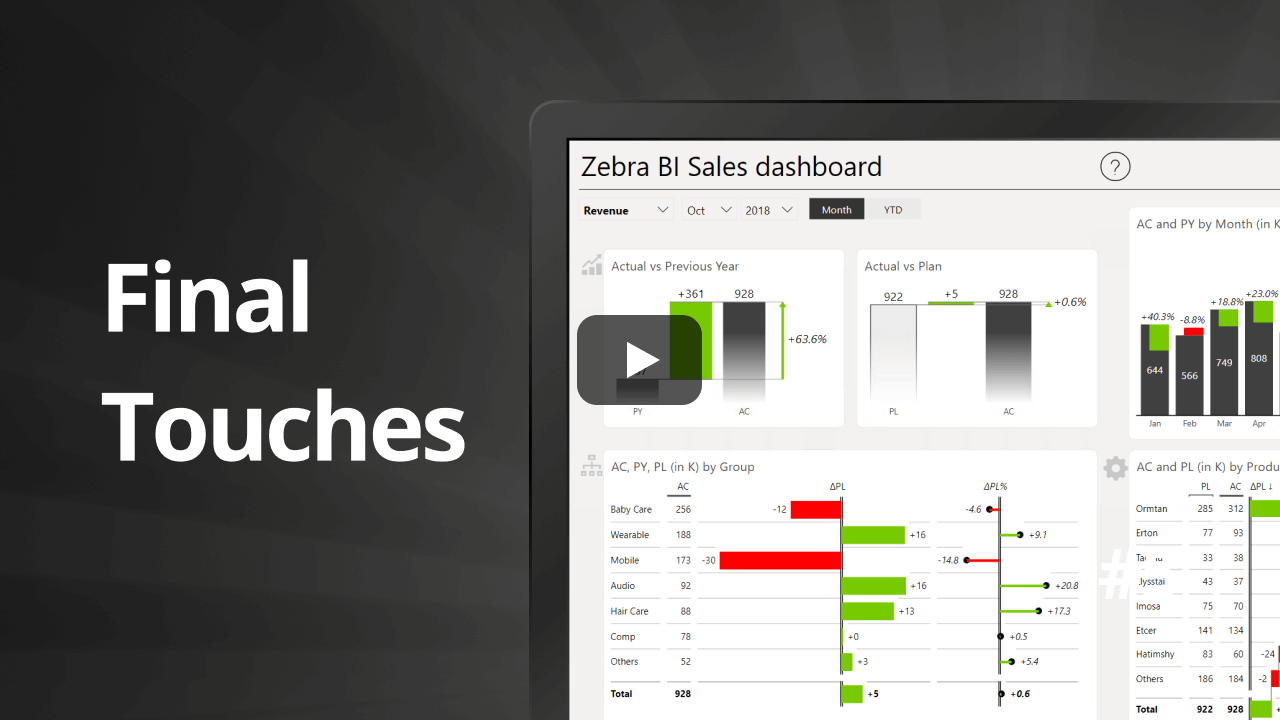
Finish up your dashboard in a few quick steps to give your dashboard an added design layout which you can then use for consistency across the entire report.
