 September 8th
 February 22nd
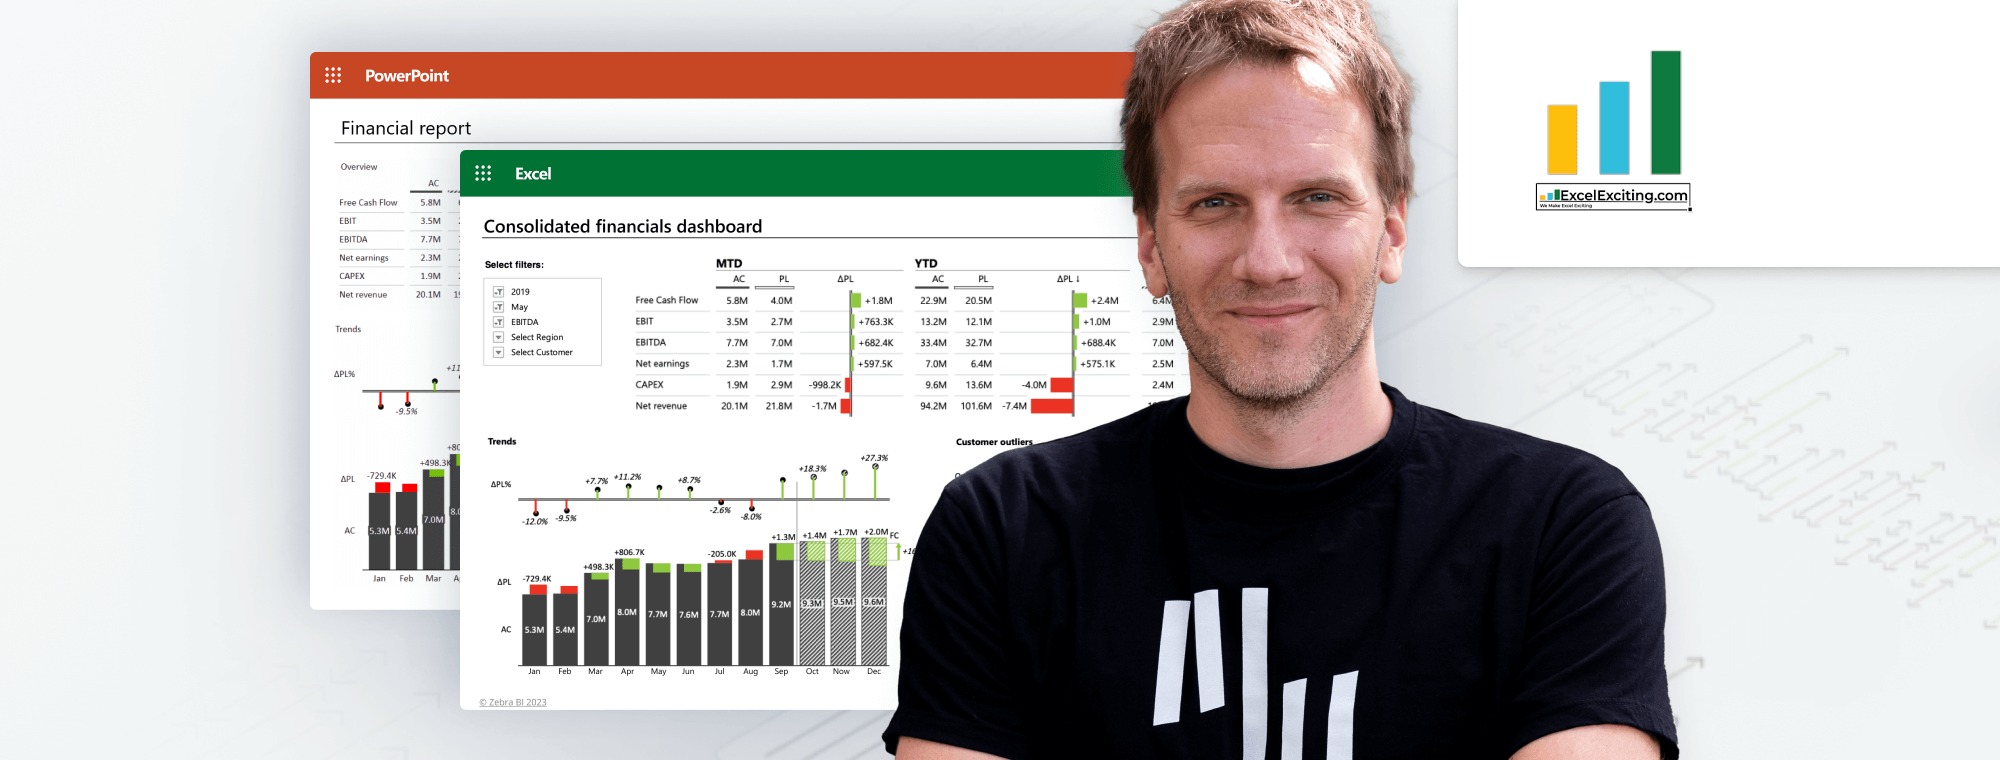
Actionable reporting in Excel and PowerPoint at the Excel Exciting Meetup
Excel Exciting Meetup is a community dedicated to providing the easiest exciting solutions with Microsoft Applications, which can make any user's daily tasks quicker & easier. It is a place to share knowledge, experience, and fun tips, while also providing training and consulting services.
Ran by Faraz Shaikh, Microsoft MVP (Most Valuable Professional), Microsoft Certified Trainer, and Certified Excel Expert.
This week we are very excited to let you know our own Head of Empowerment - Tine Ozimic will present a session on "How to create Actionable reports in Excel, PowerPoint, and Power BI."
"Join Tine and Faraz and learn how to create eye-catching, easy-to-understand visual reports that unlock invaluable business insights within seconds!"
About the Session
Excel is an indispensable tool, found in every corner of the business world. Its flexibility, user-friendly interface, and widespread adoption have made it a 'here-to-stay tool'. Yet, we can all agree that dealing with messy spreadsheets and bad visualizations is a headache we'd rather leave in the past. It's time to revolutionize the way we create reports and presentations.
The latest addition to the Actionable Reporting toolkit, the Zebra BI for Office, can help you establish a single source of truth across your entire BI stack, seamlessly integrating with Excel and PowerPoint. At the same time, it has the same look and feel as Zebra BI visuals for Power BI which empowers all users to create actionable reports no matter how much Bi knowledge they have. Tailored for data professionals and enthusiasts who are ready to take their reports to a new level.
Say goodbye to wasted hours spent on hacking Excel or PowerPoint to make your charts look actionable.
Join Zebra BI's Head of Empowerment, Tine Ozimič, to unlock the secrets to crafting eye-catching, easy-to-understand visual reports. Don't miss this opportunity to transform the way you visualize data with Zebra BI for Office.
Save the date - June 15th!
What to expect
- How to create small multiples from a simple pivot table in Excel
- How to easily create advanced P&L, variance analysis, cash flow analysis, and more!
- How to add additional context to your data using automatically calculated variances & dynamic comments
- How to combine Power BI, Excel & PowerPoint to get the most out of your data.
When and where
Date: Thursday, June 15, 2023
Time: 7.00 PM – 9.00 PM CEST
Language: English
Location: Online
Organizer: Excel Exciting Meetup
For more information and to register for the conference, visit the Excel Exciting website.