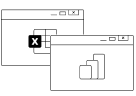
Charting in Excel doesn’t have to be a nightmare anymore. Let Zebra BI automatically turn numbers into instant insights with advanced charts & tables. Right in your Excel.
Simply slide between waterfall, variance, column, area, line, dot, lollipop, and ‘hills&valleys’ charts, or even create small multiples from your pivot table!
 September 8th
 February 22nd