 September 8th
 February 22nd
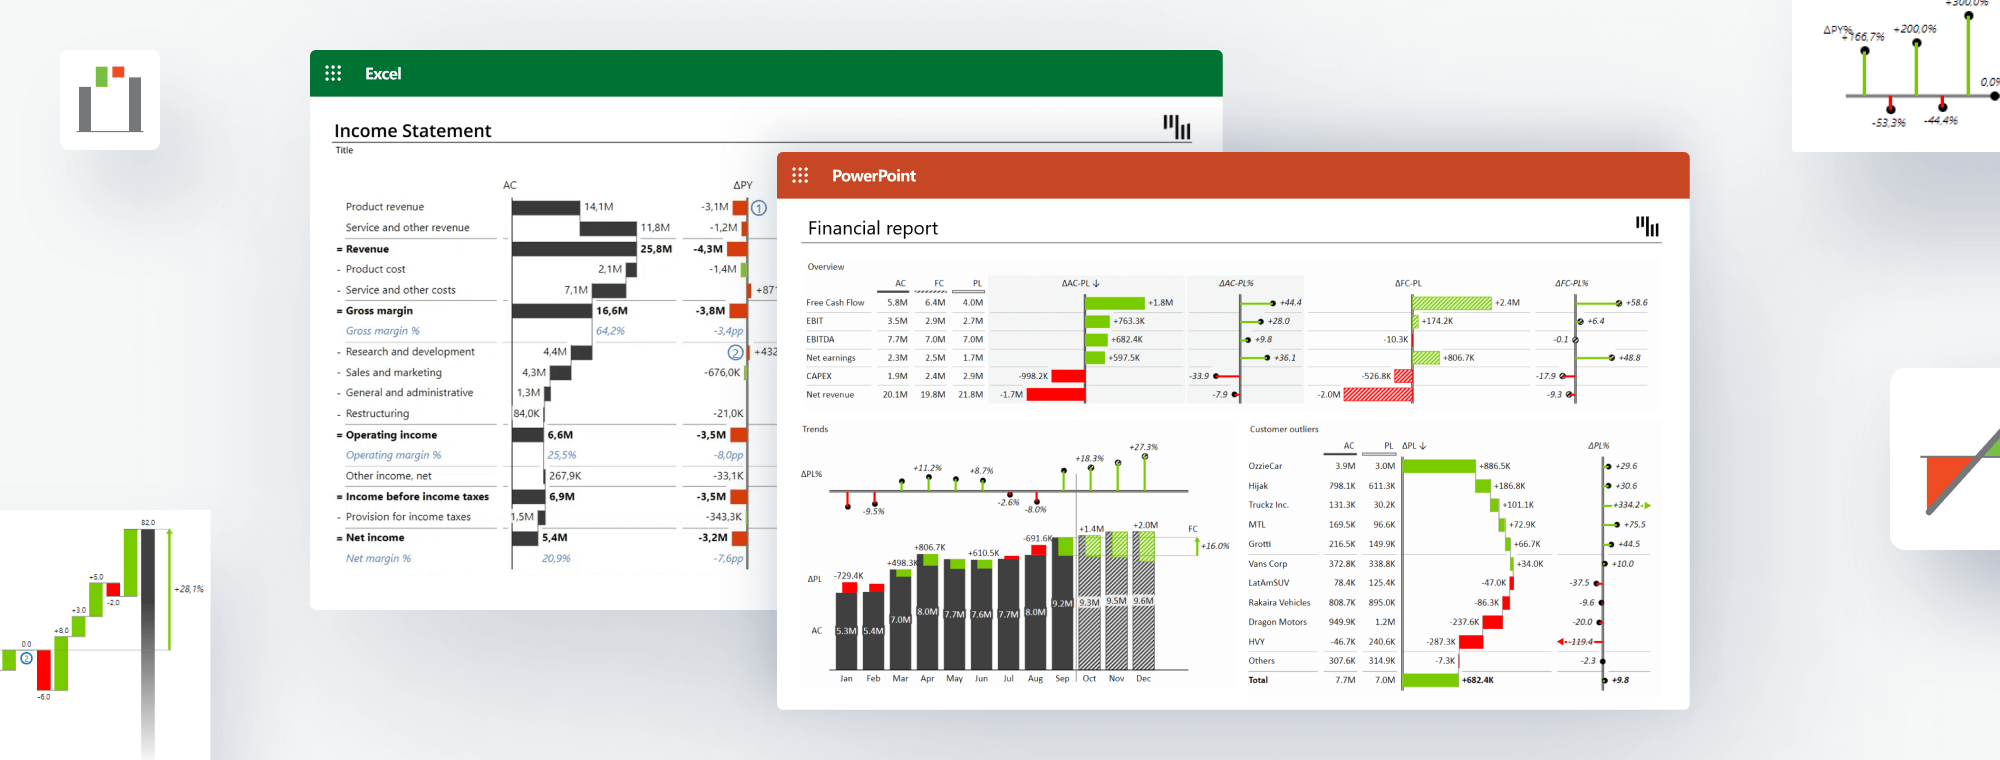
Looking for ways to create insightful & actionable reports, dashboards, and presentations in Excel and PowerPoint? You're in the right place.
Because of both platforms' flexibility, millions of business users use them globally daily. However, this can often result in poor data visualization practices like illegible tables and fancy, colorful charts. Stop wasting hours creating reports and presentations that don't deliver insights immediately.
Our BI expert will guide you through a step-by-step live demo of Zebra BI for Office to visualize your data effectively. Right on your favorite platform.After this 30-minute presentation, you will know how to put data into the right context and impress your colleagues.
Skip the long research and scheduling calls and get all your questions answered.


