 September 8th
 February 22nd
By the end of this 8-minute tutorial, you'll learn how to create your first report in Power BI with Zebra BI and leave with a solid understanding of how to build actionable reports — by simply dragging & dropping your data into the visuals.
If you want to develop your report design skills, we highly recommend you check out resources below:
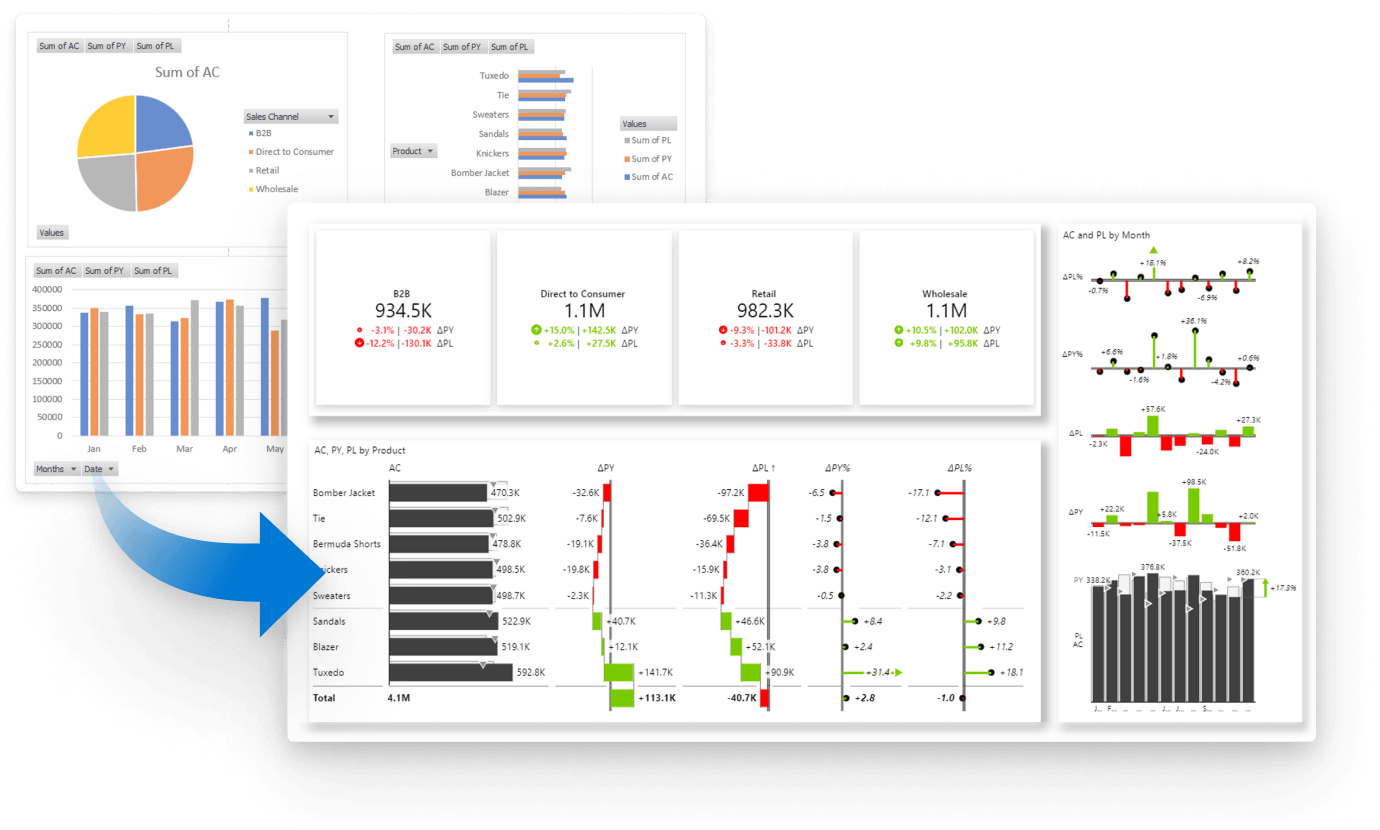
Zebra BI is a complete toolkit for creating understandable and actionable reports. It consists of three visuals that cover all business reporting needs: Tables, Charts, and Cards.
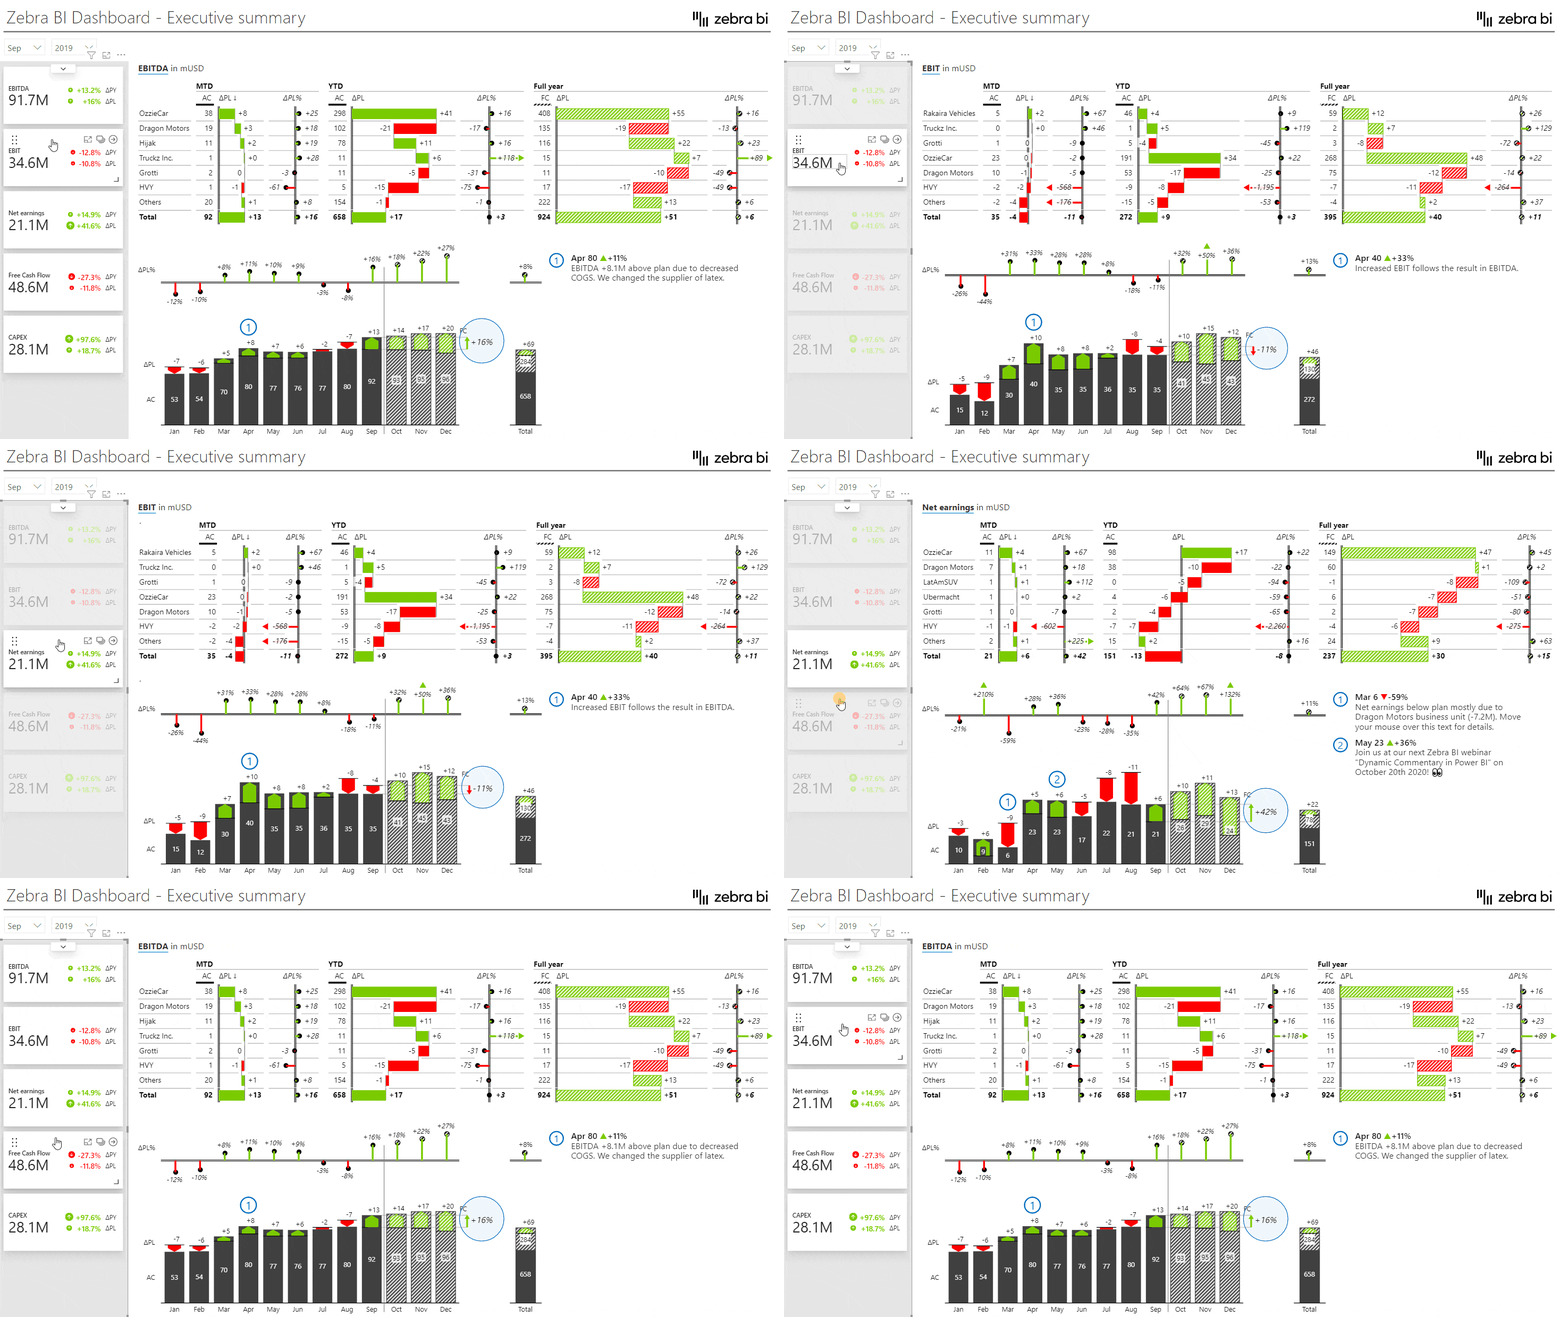
Each functionality of Zebra BI is designed to support best practices in modern BI, such as showing variances and comparisons, adding dynamic comments to explain the context, using advanced charts, and much more. By leveraging the unified design of all elements, you'll be able to create clear and consistent reports that everyone in the company will understand.
If you approach Zebra BI with the mindset of data storytelling, you'll be able to learn it very quickly. And as a result, you'll end up creating reports that your colleagues and managers will love.
Not the other way around. Zebra BI visualizes your data to save you serious time and help you focus on interpretation and discussion.

