Getting started 
with Zebra BI is easy!

Follow these easy steps to import Zebra BI visuals into your Power BI.

1. Import Zebra BI visuals

In your Power BI:

  • Click on (...) in the Visualizations pane
  • Select Get more visuals
  • Search for "zebra" in AppSource

After you import visuals, you should receive a notification and see the new icons in the Visualizations pane.

2. Add some data

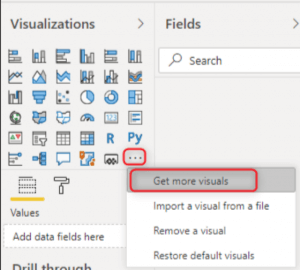
Click on the icon in the Visualization pane to insert the visual into the report page and display a blank landing page.

Select any data field on the right side to create your first Zebra BI table or chart.

3. Get inspired

Visit our Help Center for tutorial videos, examples, tips&tricks, and more!

Make sure to repeat the process for all the visuals (Tables, Charts & Cards). 🙂

Get support:
If you need help with anything, please write us an email at support@zebra.bi.

Unlock Professional features 

To experience the full power of Zebra BI visuals and create more advanced reports, try out the Professional version. The first 30 days are completely free! 

Try  Pro version

Resources

July 10, 2025
Future-Proof Financial Reporting: Automate, Standardize, and Scale with Power BI
Learn how to automate and standardize P&L, BS & CF reports in Power BI with Zebra BI — no copy-paste, broken links, or inconsistent KPIs.
May 28, 2025
Beyond Excel: How Modern CFOs Leverage Power BI and AI for Better Insights
Modern CFOs are moving beyond spreadsheets to lead with data. In this webinar, you’ll learn how Power BI and AI are transforming financial reporting—turning static numbers into strategic insights.
April 16, 2025
Power BI Made Easy – 5 Steps to Actionable Reports
We’ll show you how to reduce complexity and create reports that provide immediate insights— without in-depth Power BI knowledge.
October 29, 2024
How Good Is AI-Driven Business Analysis (Really?) 
Can AI-driven business analysis really help your organization? Opinions may differ in the industry, but here's what you need to know to make the right choice for your business.
November 29, 2023
Leila Gharani x Zebra BI: How To Design A Perfect Excel Dashboard From Scratch
Discover key tips for Excel dashboard creation with Leila Gharani's tutorial and enhance your skills using Zebra BI's advanced tools for optimal analysis.
November 30, 2022
Your ultimate guide to Price Volume Mix analysis in Power BI 
Find out how to perform a Price Volume Mix Analysis in Power BI to see how price, volume and product mix changes affect your revenue.
Browse All Resources