 September 8th
 February 22nd
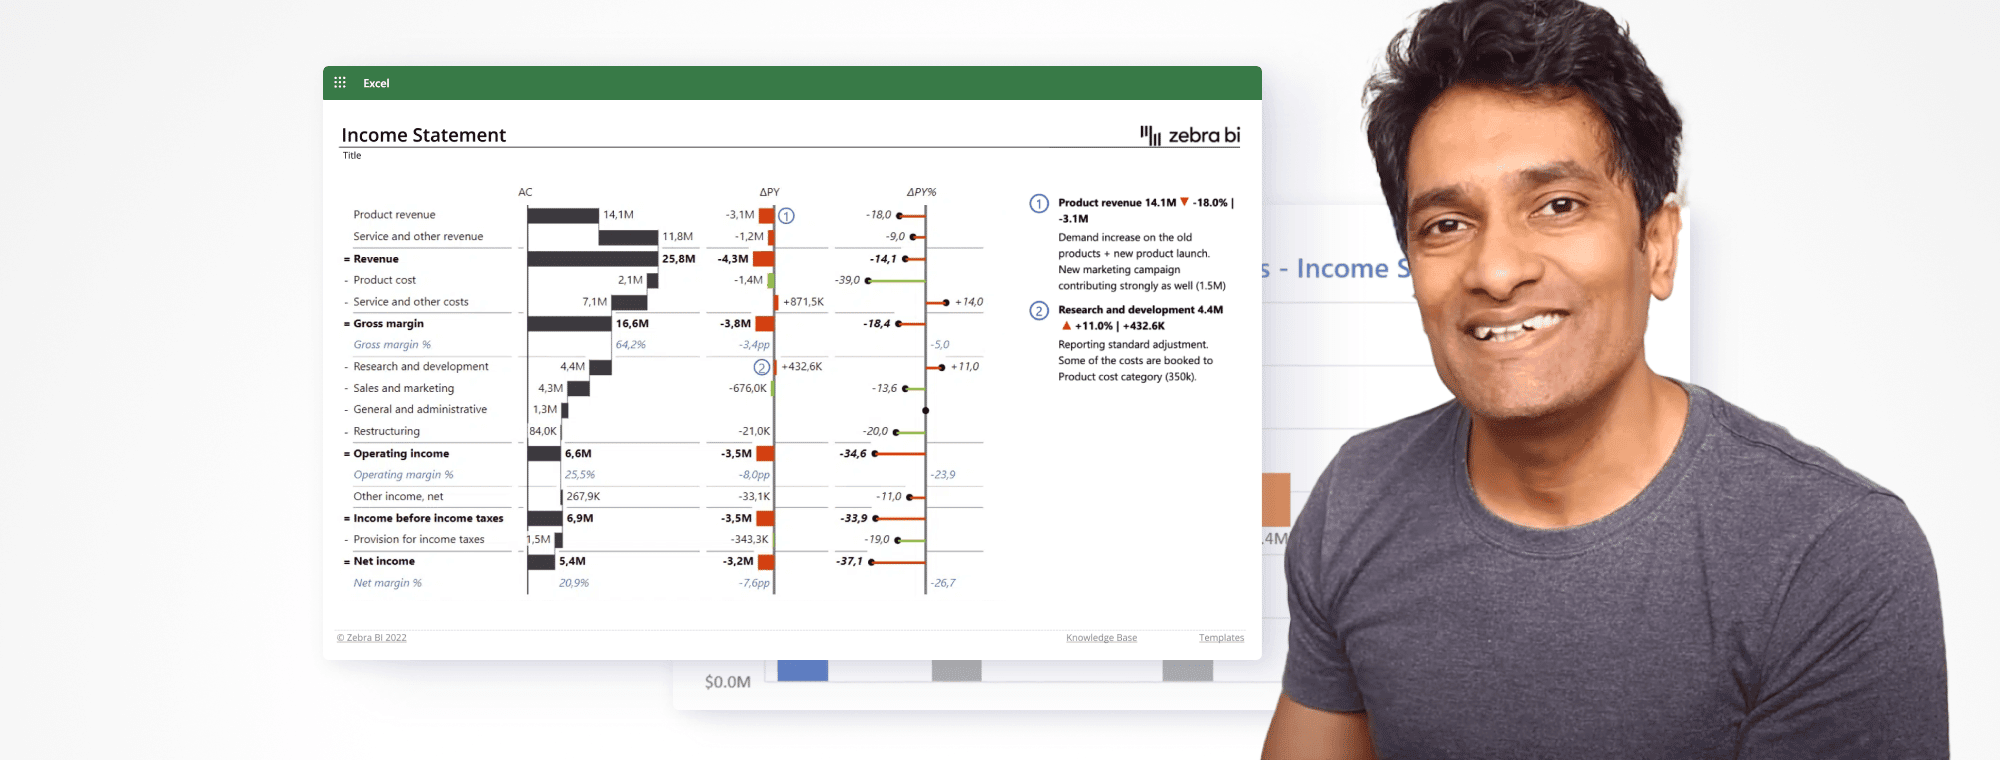
How Chandoo creates waterfall charts in Excel with Zebra BI for Office
Comparing your actual performance to the plan, previous year or forecast is crucial for the proper understanding of your data. Yet, it seems impossible to be done with the native waterfall chart in Excel. Zebra BI for Office offers the perfect solution.
Using Zebra BI Tables for Office, you can visualize your data with a waterfall chart and compare it with up to 3 measures at the same time! Chandoo shows just how easy it is on the example of an income statement in his latest video. See for yourself.
Waterfall charts are great for showing income statements, balance sheets and changes from one point in time to another, but it used to take up hours trying to make one. Well not anymore!
Advanced reports in the blink of an eye
Zebra BI for Office is the latest addition to the Actionable Reporting toolkit for data professionals and enthusiasts who want to take their reports to the next level – and fast. With the combination of two powerful add-ins, Zebra BI Tables and Zebra BI Charts, this innovative tool gives you an immediate understanding of your business performance.
Default waterfall charts are not compatible with pivot tables; that's why transfering the data automatically can take tons of work. With the help of Zebra BI, you can design eye-catching, easy-to-understand visual reports that will impress even the toughest managers. And all of that with just a few clicks. Give it a try and let the Zebra BI visuals automatically calculate & visualize your key business drivers for you!
No more time wasted on hacking Excel to make the charts look good. Create eye-catching, easy-to-understand visual reports that unlock invaluable business insights within seconds! Try it out with your data or download free templates to get inspired.
Let's hear all about it from Chandoo himself
Check out his video & see how you too can create a table with an awesome waterfall chart in just seconds. 👇
Who is Chandoo and how can he help you "become awesome"?
Purna Chandra Roa, known also by Chandoo is Microsoft's Most Valuable Professional (MVP) and the founder of Chandoo.org. His website helps people excel at Microsoft Excel. The website was launched in 2004 with the mission to share new ideas about Microsoft Excel, while also helping other people solve their daily problems. Now his site Chandoo.org is read by millions every year. It has over 500,000 monthly views and about 200,000 regular readers from all over the world. Chandoo's YouTube channel alone has more than 327,000 subscribers.
Alongside his YouTube channel and website, Chandoo has authored over 700 articles and three books, and trained more than 20,000 individuals in different courses on Excel, Power Query, Power Pivot, and VBA. His passion for Data Analytics and Visualization can be seen through all of his works.
What is Zebra BI and how does it help to elevate your reports?
Zebra BI delivers fast and advanced solutions developed to redefine the world of reporting and data visualization. As the number one solution for Actionable Reporting, Zebra BI's state-of-the-art technologies allow you to gain a deeper insight into your business operations and efficiency so that you can further improve the way you do business.
Simply put, Zebra BI automatically calculates & visualizes your key business drivers, ushering you into the world of self-service BI. By combining highly intuitive visualization tools, you can take your reports to the next level, be they in Excel or PowerPoint.