Every waterfall tells you what changed. A stacked waterfall chart shows you which segments drove the change and by how much in a single view.
With Zebra BI Charts, this is now available. Stop explaining the numbers. Start acting on them.
Share this
 September 8th
 February 22nd
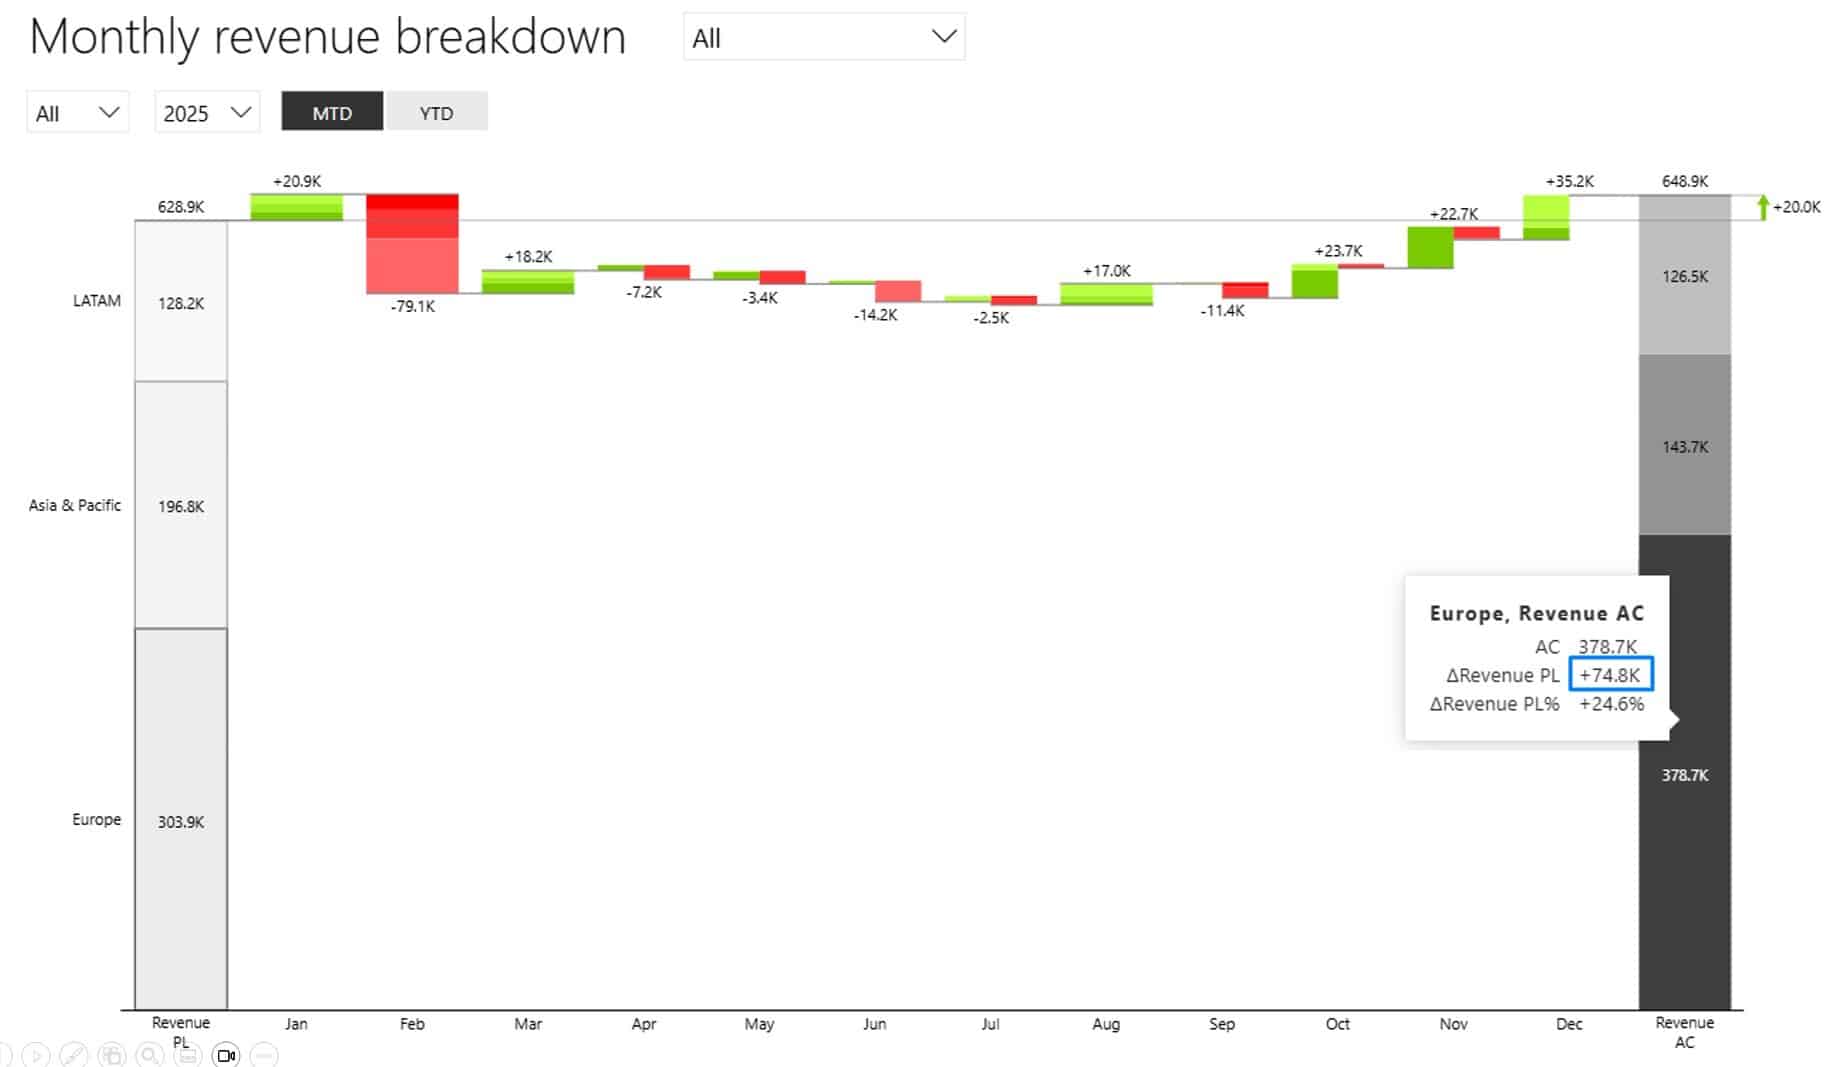
Revenue is up 20k. The CFO's first question is where it came from.
A stacked waterfall chart has the answer in the same column: LATAM down 1,7k, Europe up 74,8k, APAC down 53,1k.
Focus on the issue, not the explanation.
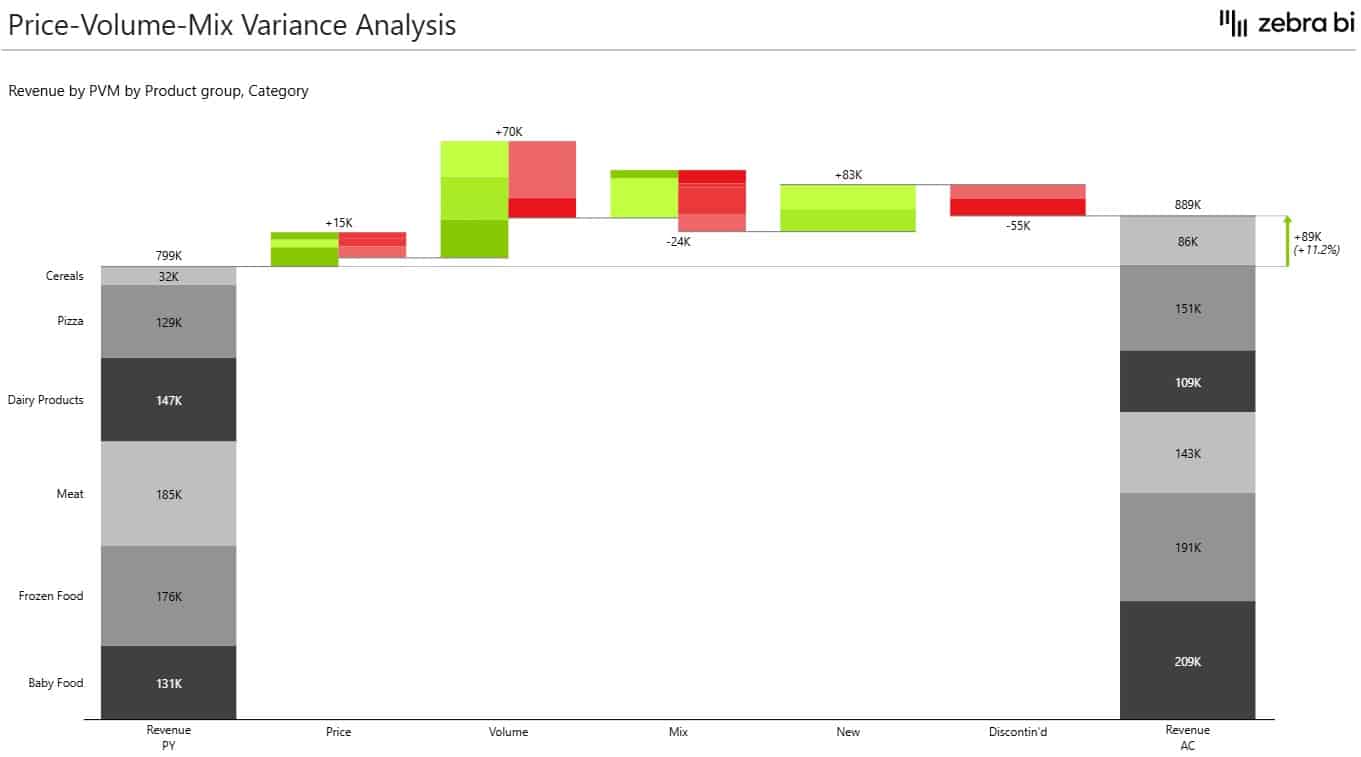
Drag your segment dimension into the Groups field to create Small Multiples.
Then click 'stacked' in the top-right chart controls, and voila. No DAX, no extra measures.
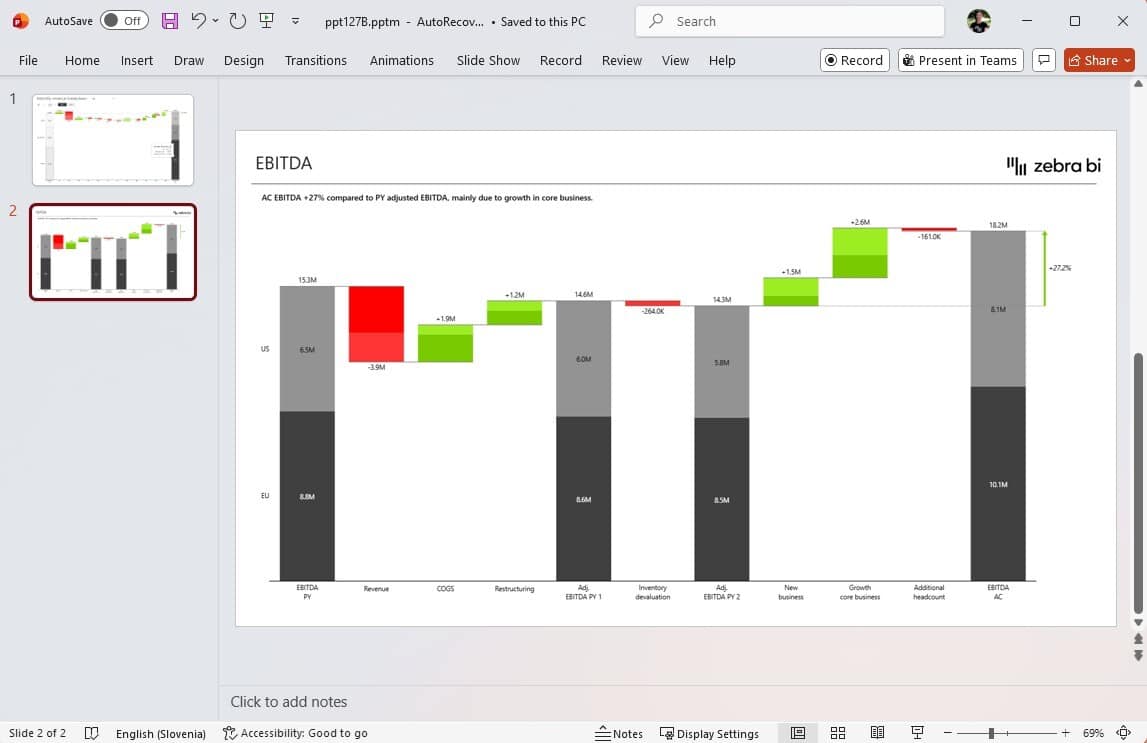
Tooltips disappear on export.
Stacked Waterfall places the breakdown directly on the bars, so the PDF, screenshot, or board deck shows the full picture.
Nothing to rebuild on a separate slide.

If you're using the AppSource version of Zebra BI (version 4.0.0 or higher), then your Zebra BI will be updated via Microsoft's AppSource marketplace automatically once processed.
If you're using an older (private) version of Zebra BI (e.g. 3.x.x or older), then this is a perfect opportunity to update your Zebra BI! When ready, just shoot us an email at support@zebrabi.com and we'll help you migrate to the latest version.
Haven't tried Zebra BI before? Opt in for our free trial here: