"Every month I rebuild the same slides from scratch."
"The CFO asked for changes. Again."
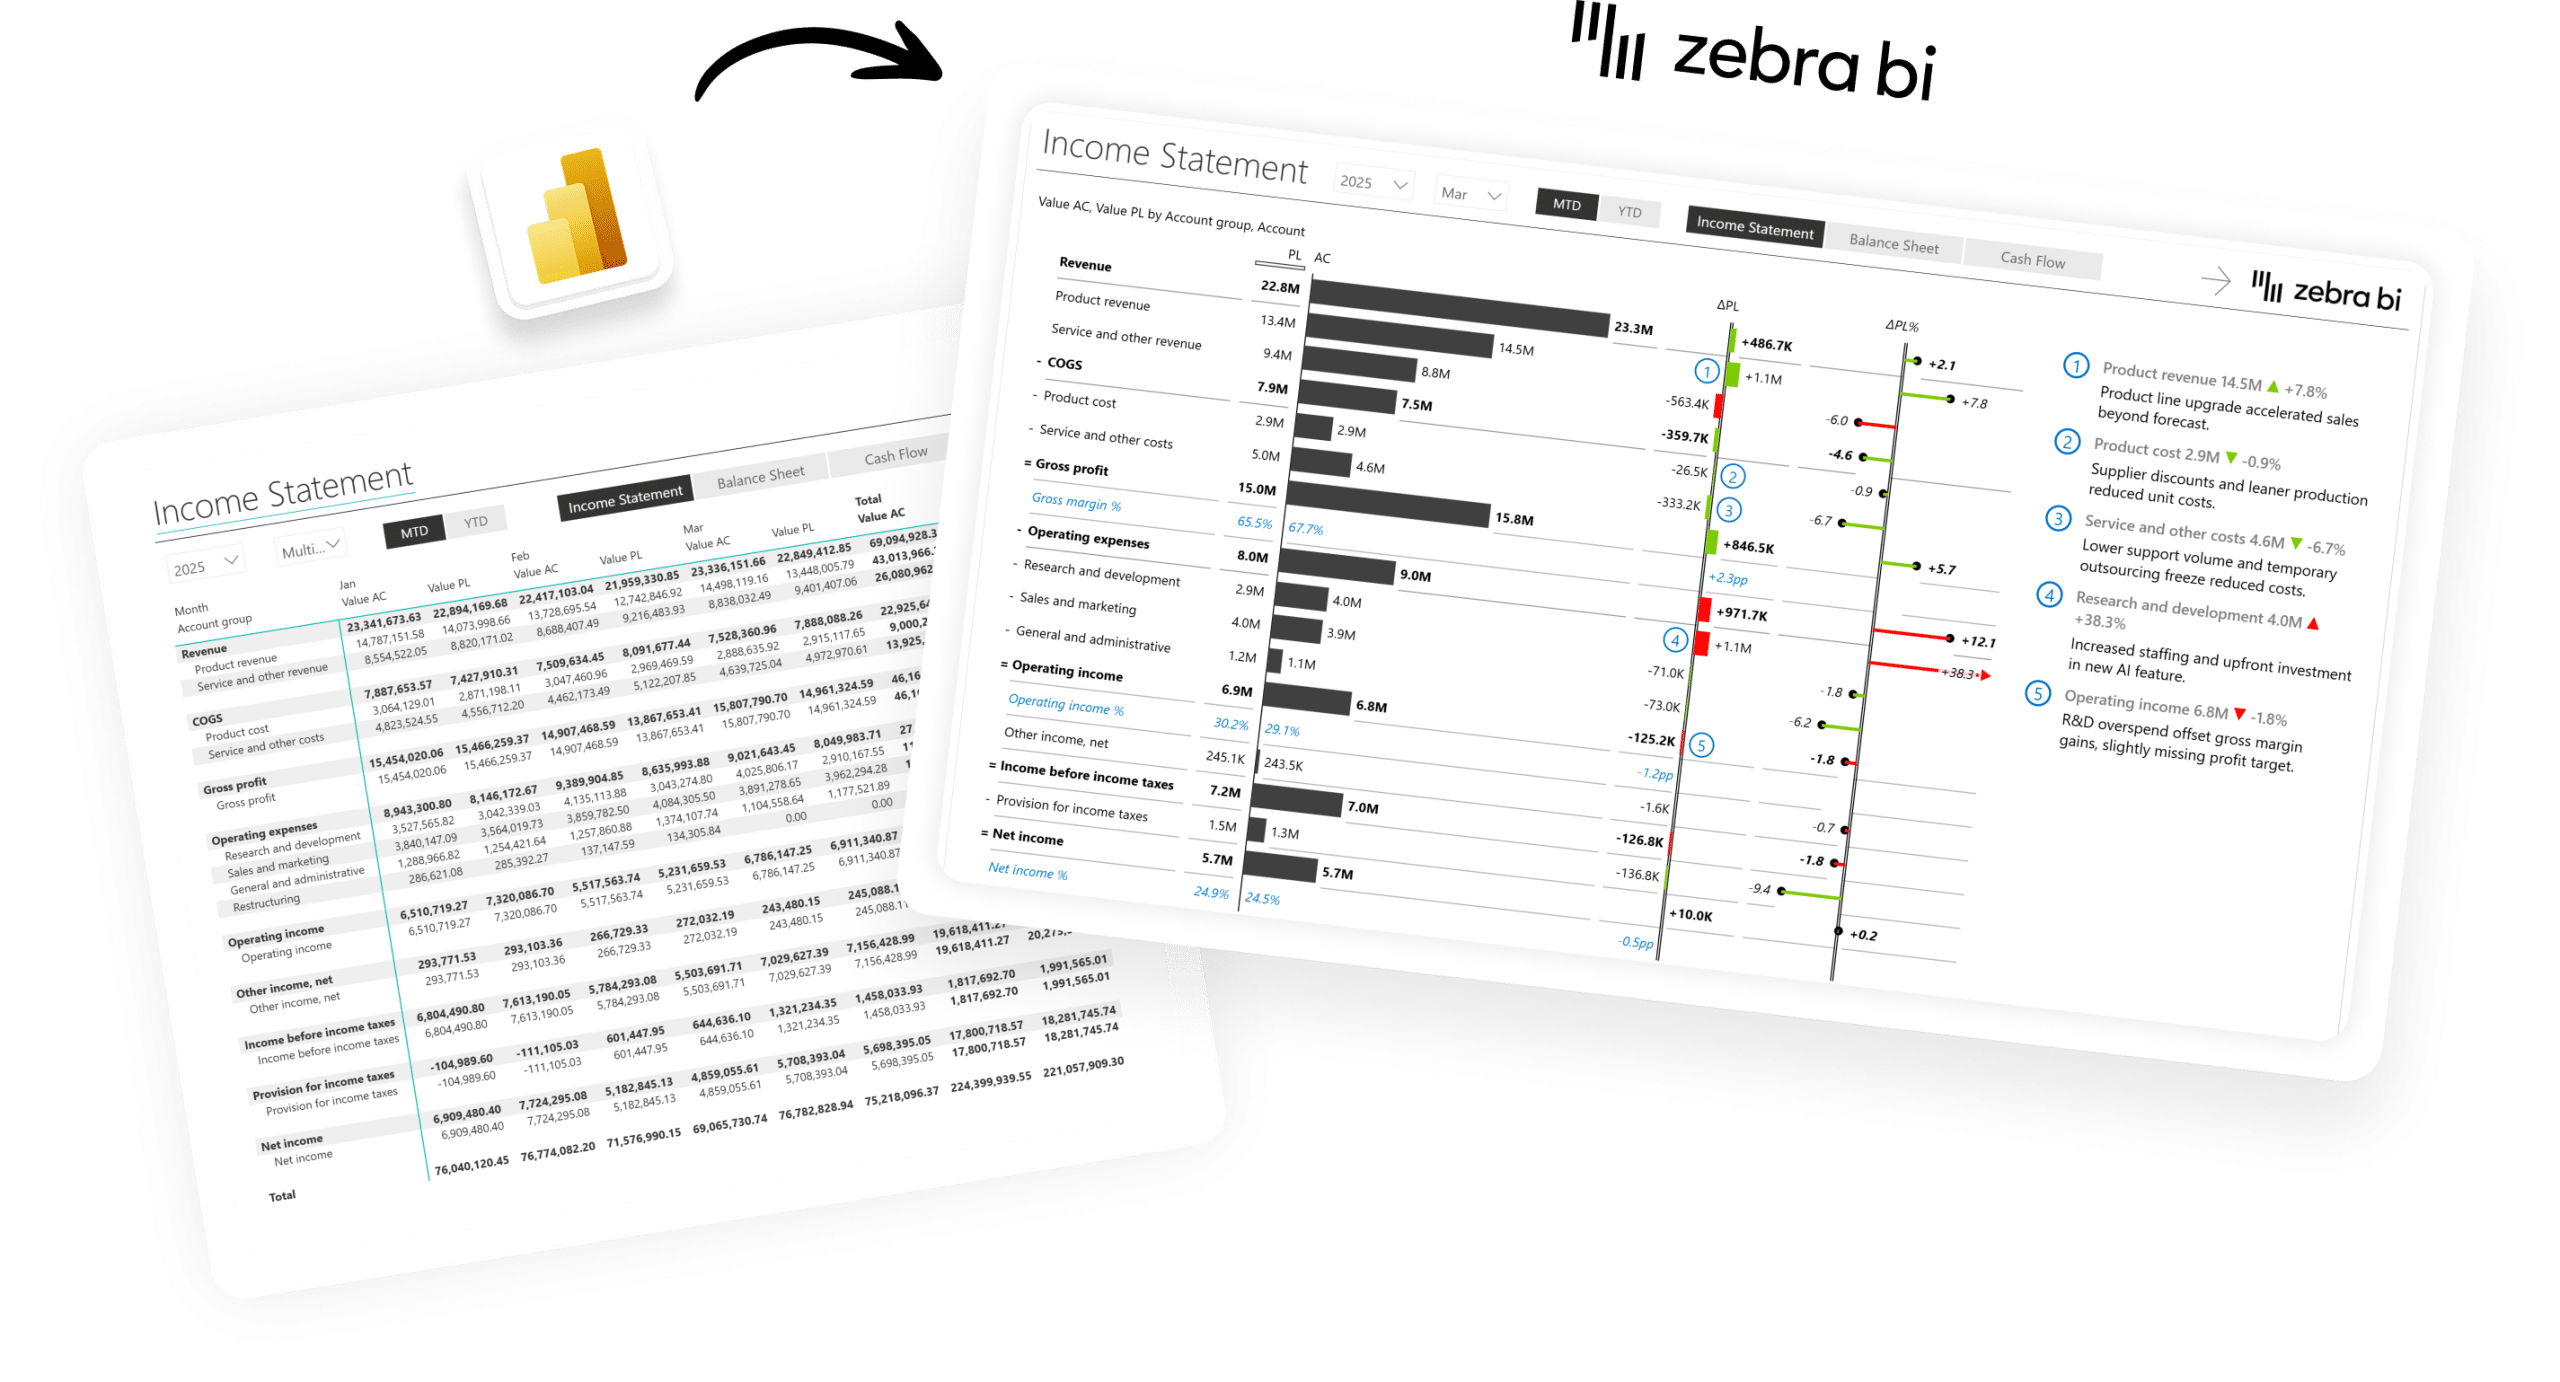
"Showing financial reports in Power BI is always a struggle."
Finance teams are stuck in a cycle that shouldn't exist. The data is in Power BI. The model is solid. But turning it into a P&L executives actually read still takes days of manual work every close.
Then the questions arrive. "Can you explain the variance?" "Can you add prior year?" "Can you make this look more like what the board expects?"
It's not a data problem. It's a platform problem. Zebra BI closes that gap.
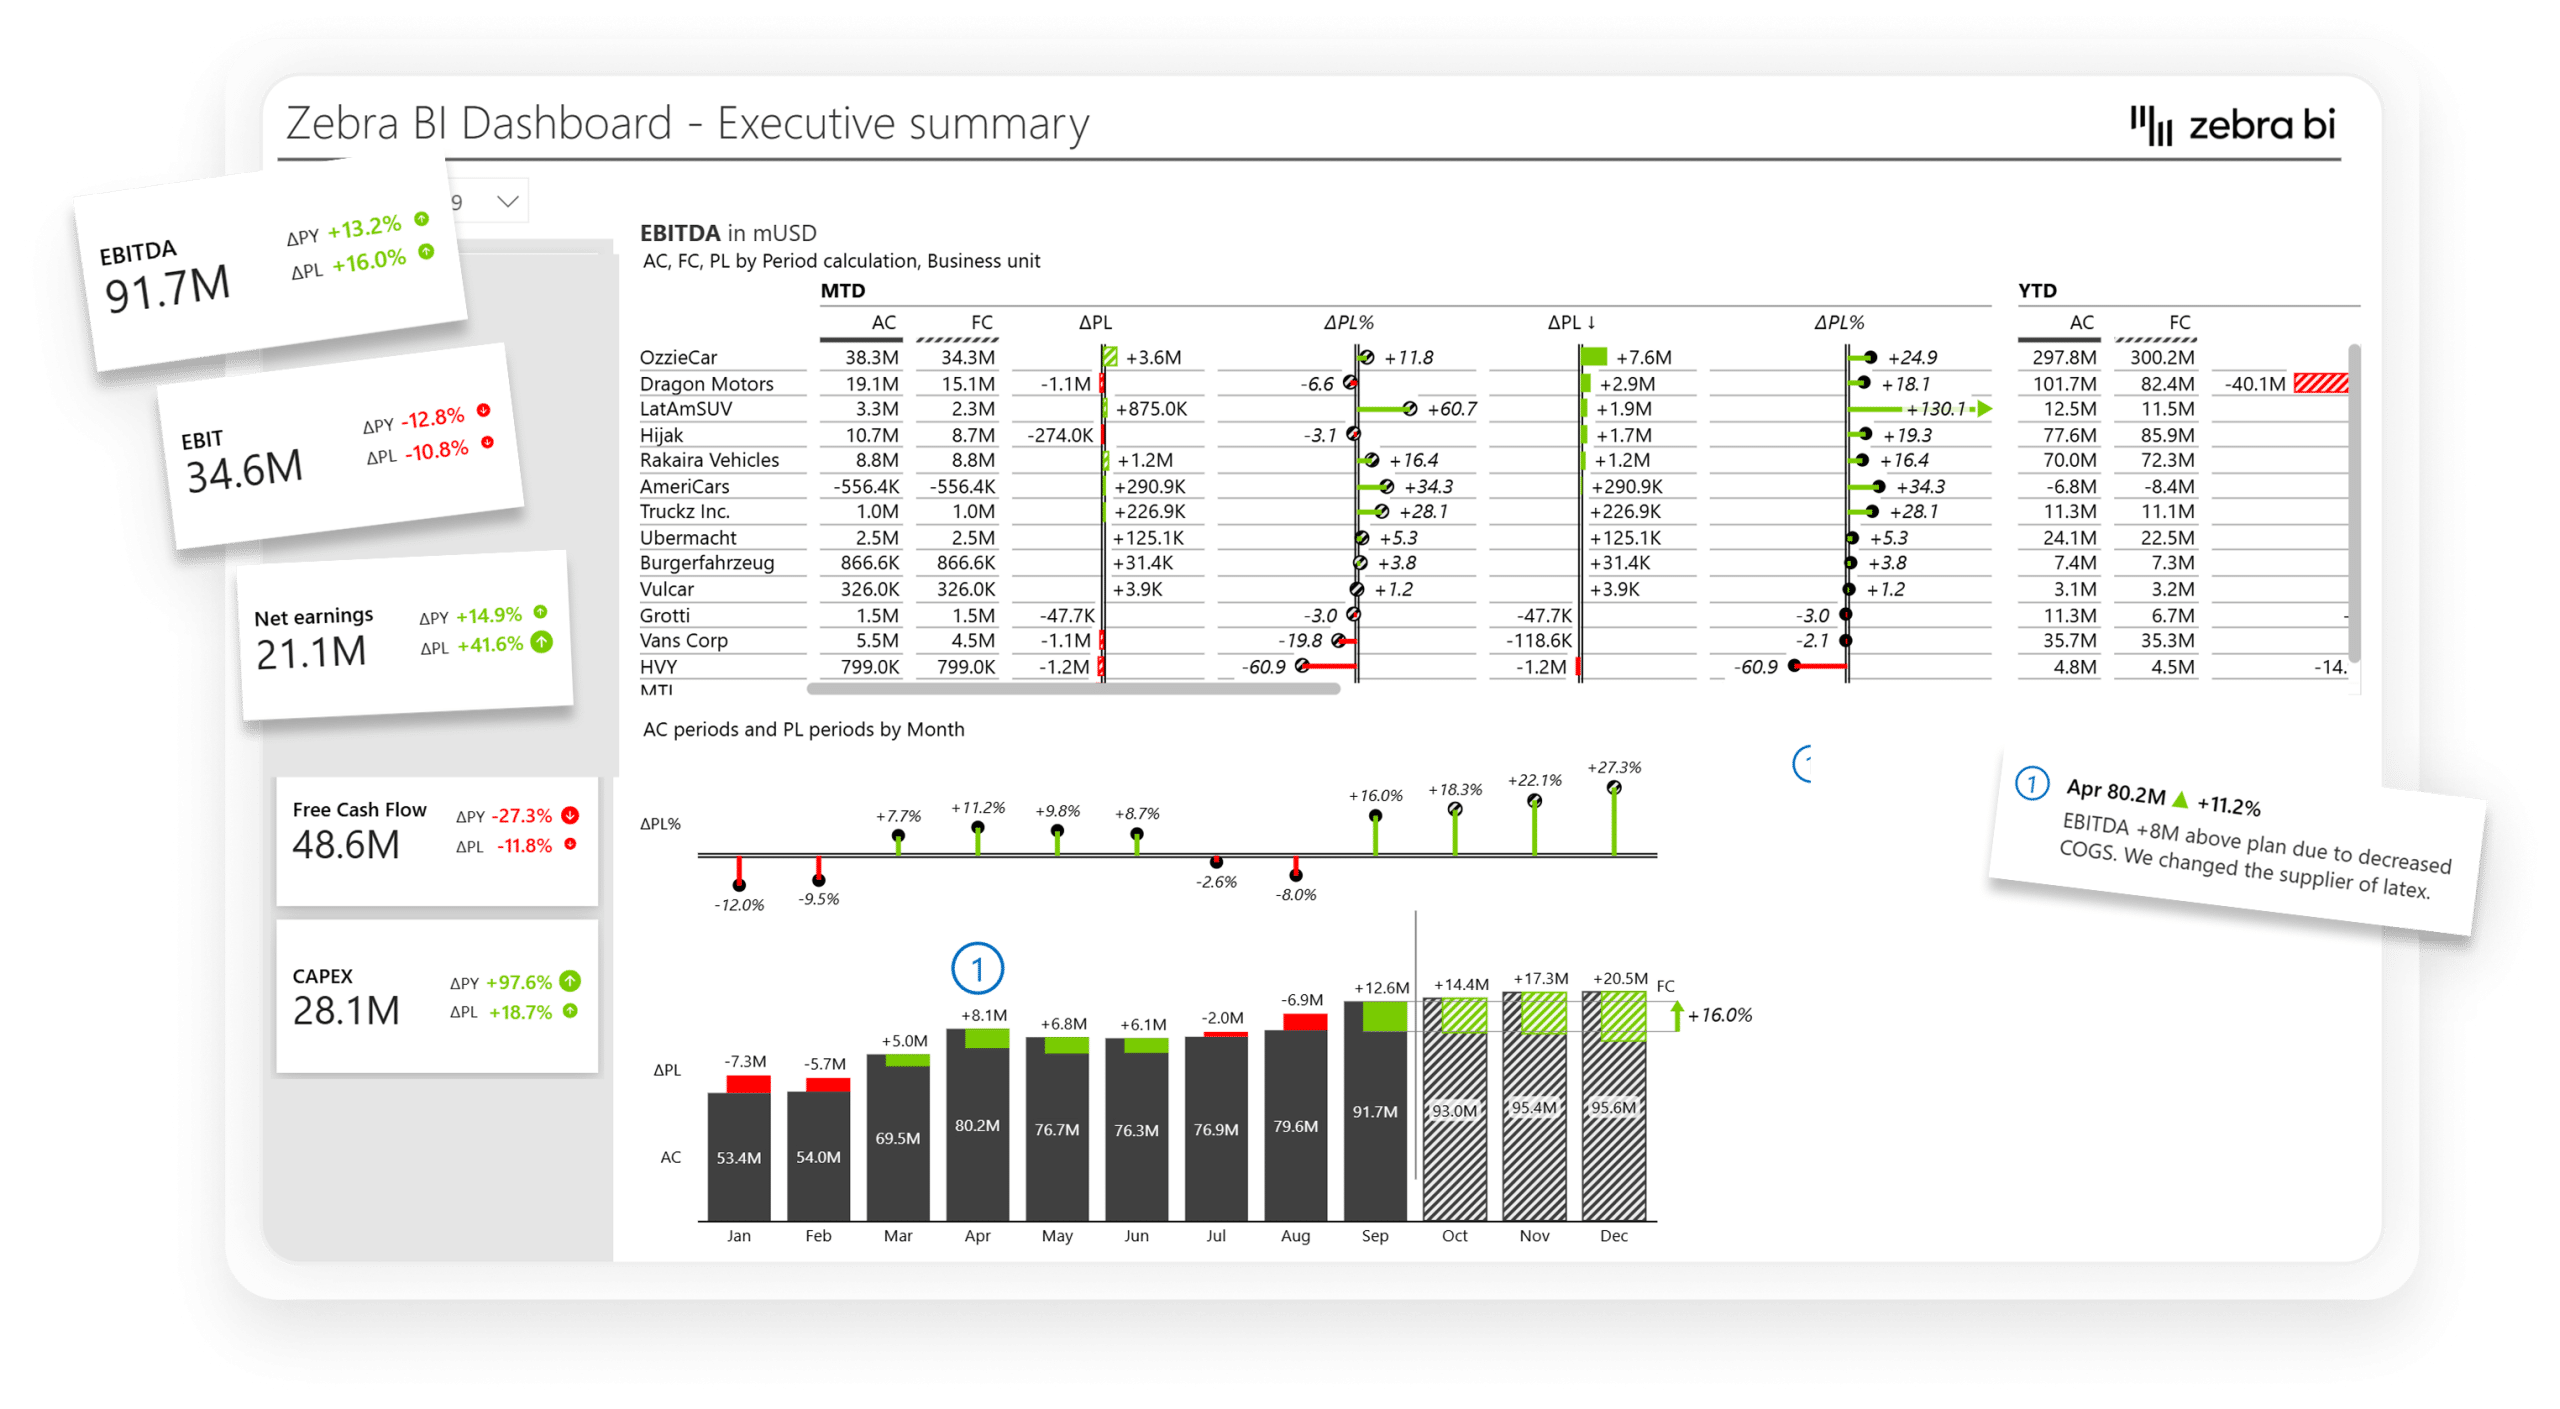
"Before Zebra BI, every business unit was using Excel and Word documents in various formats: no standardization, no consistency. Now we have IBCS-compliant dashboards that everyone reads the same way. The CFO can look at any business unit report and immediately understand it."
The reporting layer your Finance team has been missing
Microsoft gives you the platform. Zebra BI gives you the standard, so your story finally reaches the boardroom.
Power BI
Excel
PowerPoint
Teams like yours use Zebra BI for:
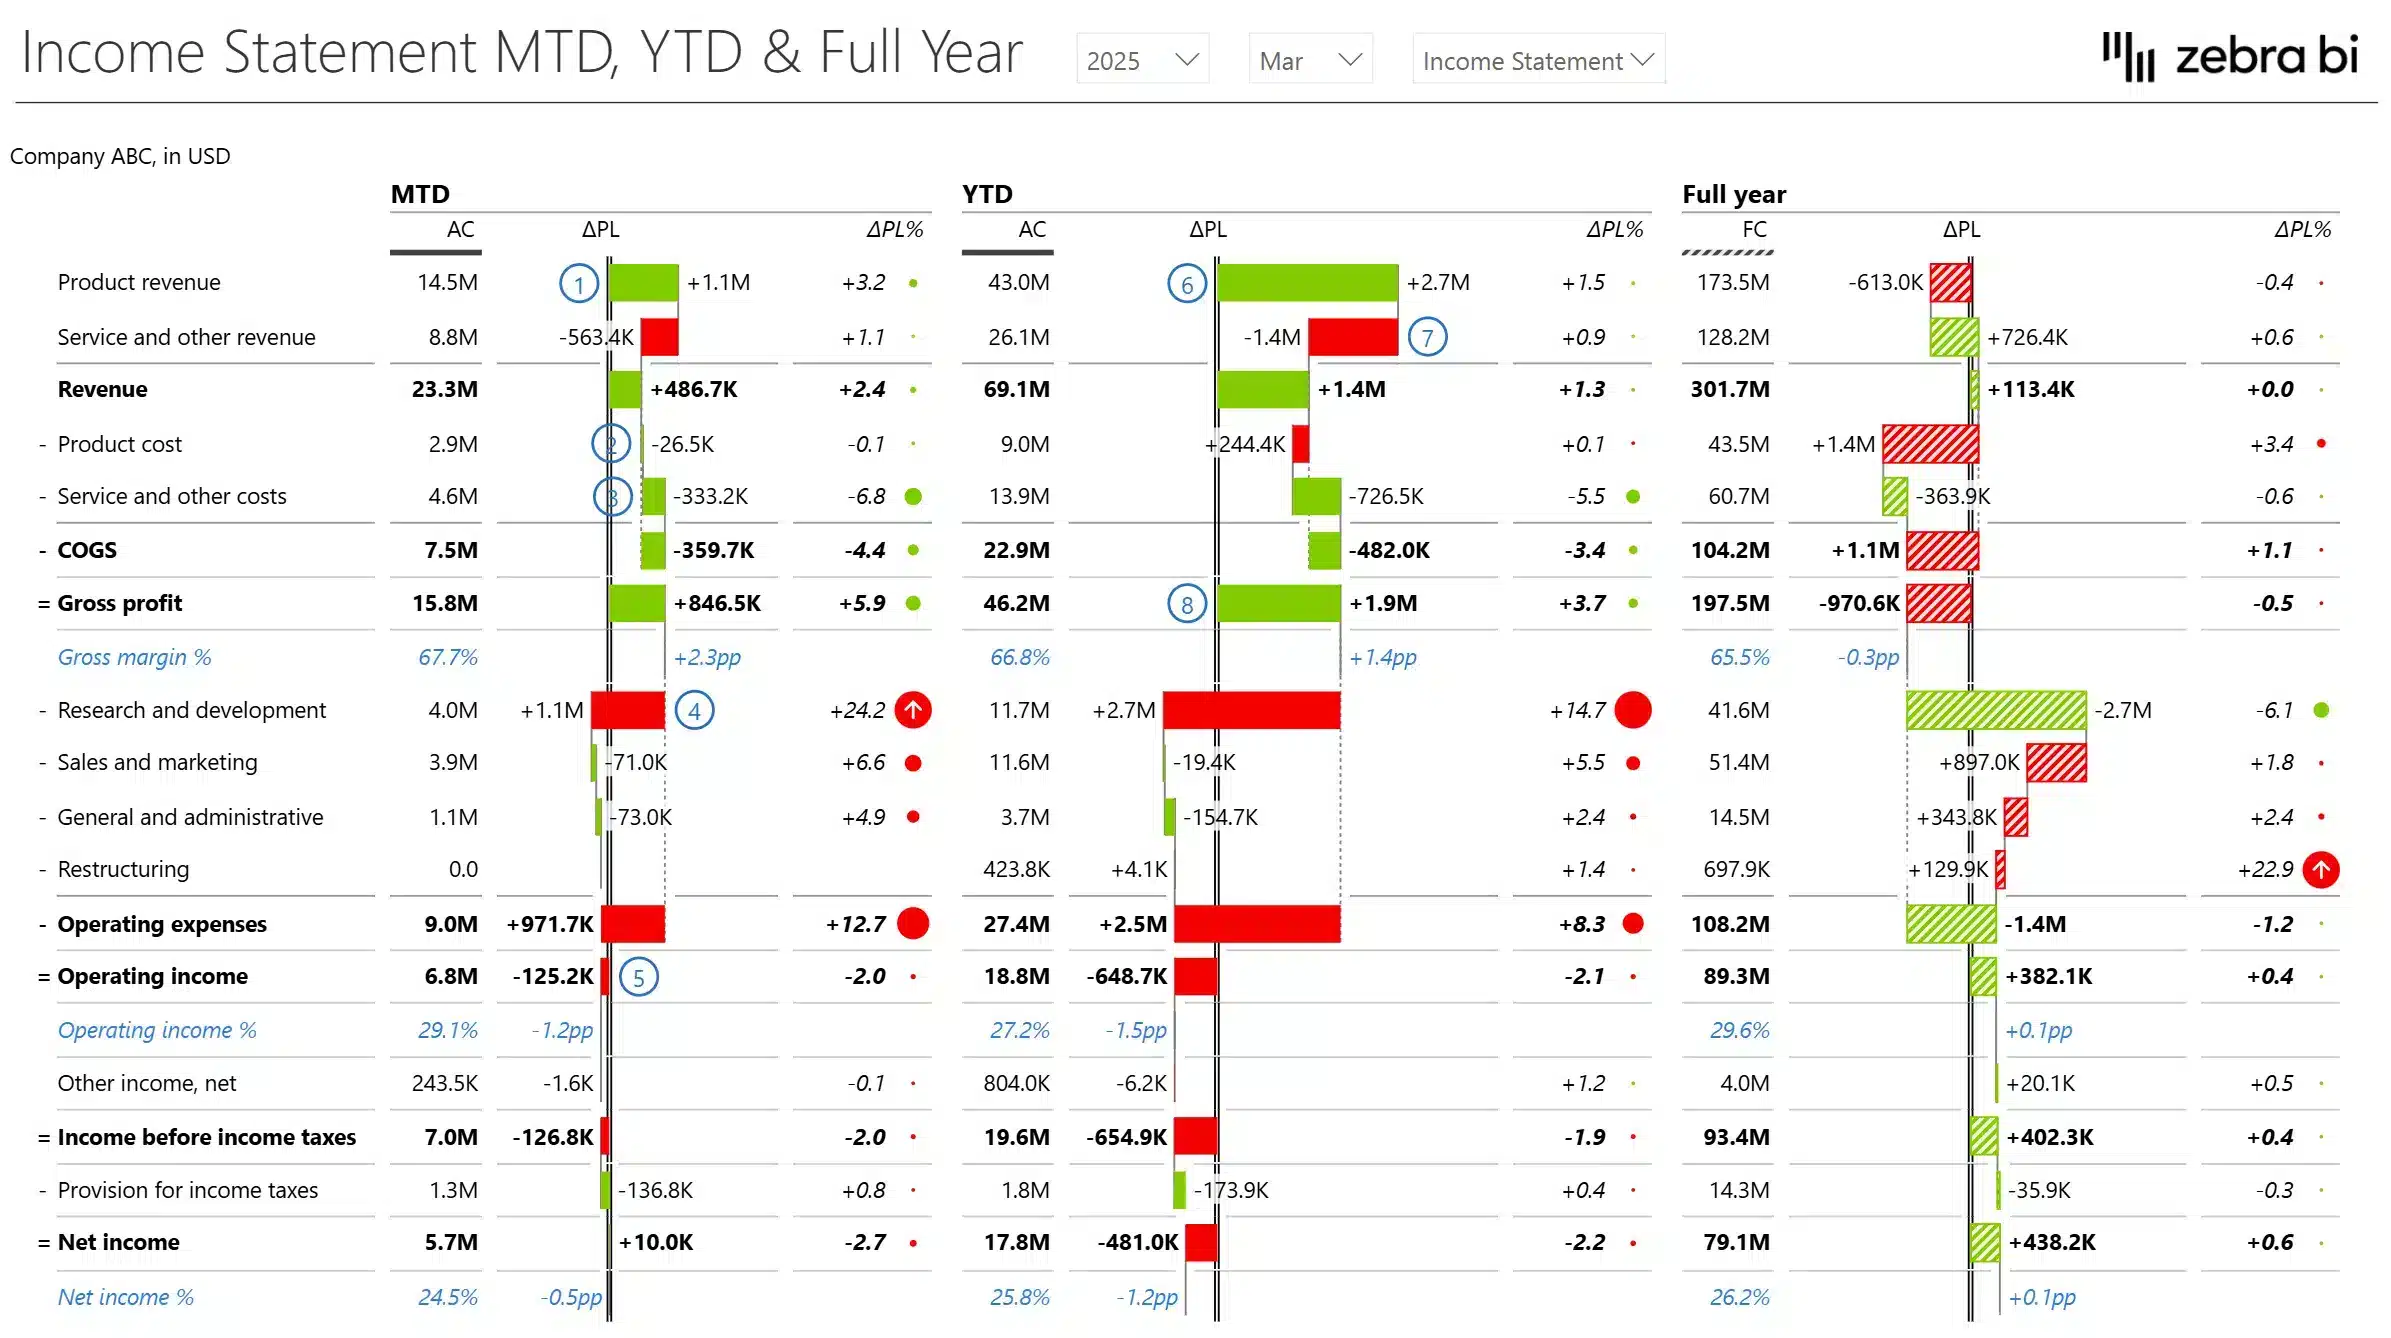
P&L / Income Statement
Variance Analysis
Balance Sheet
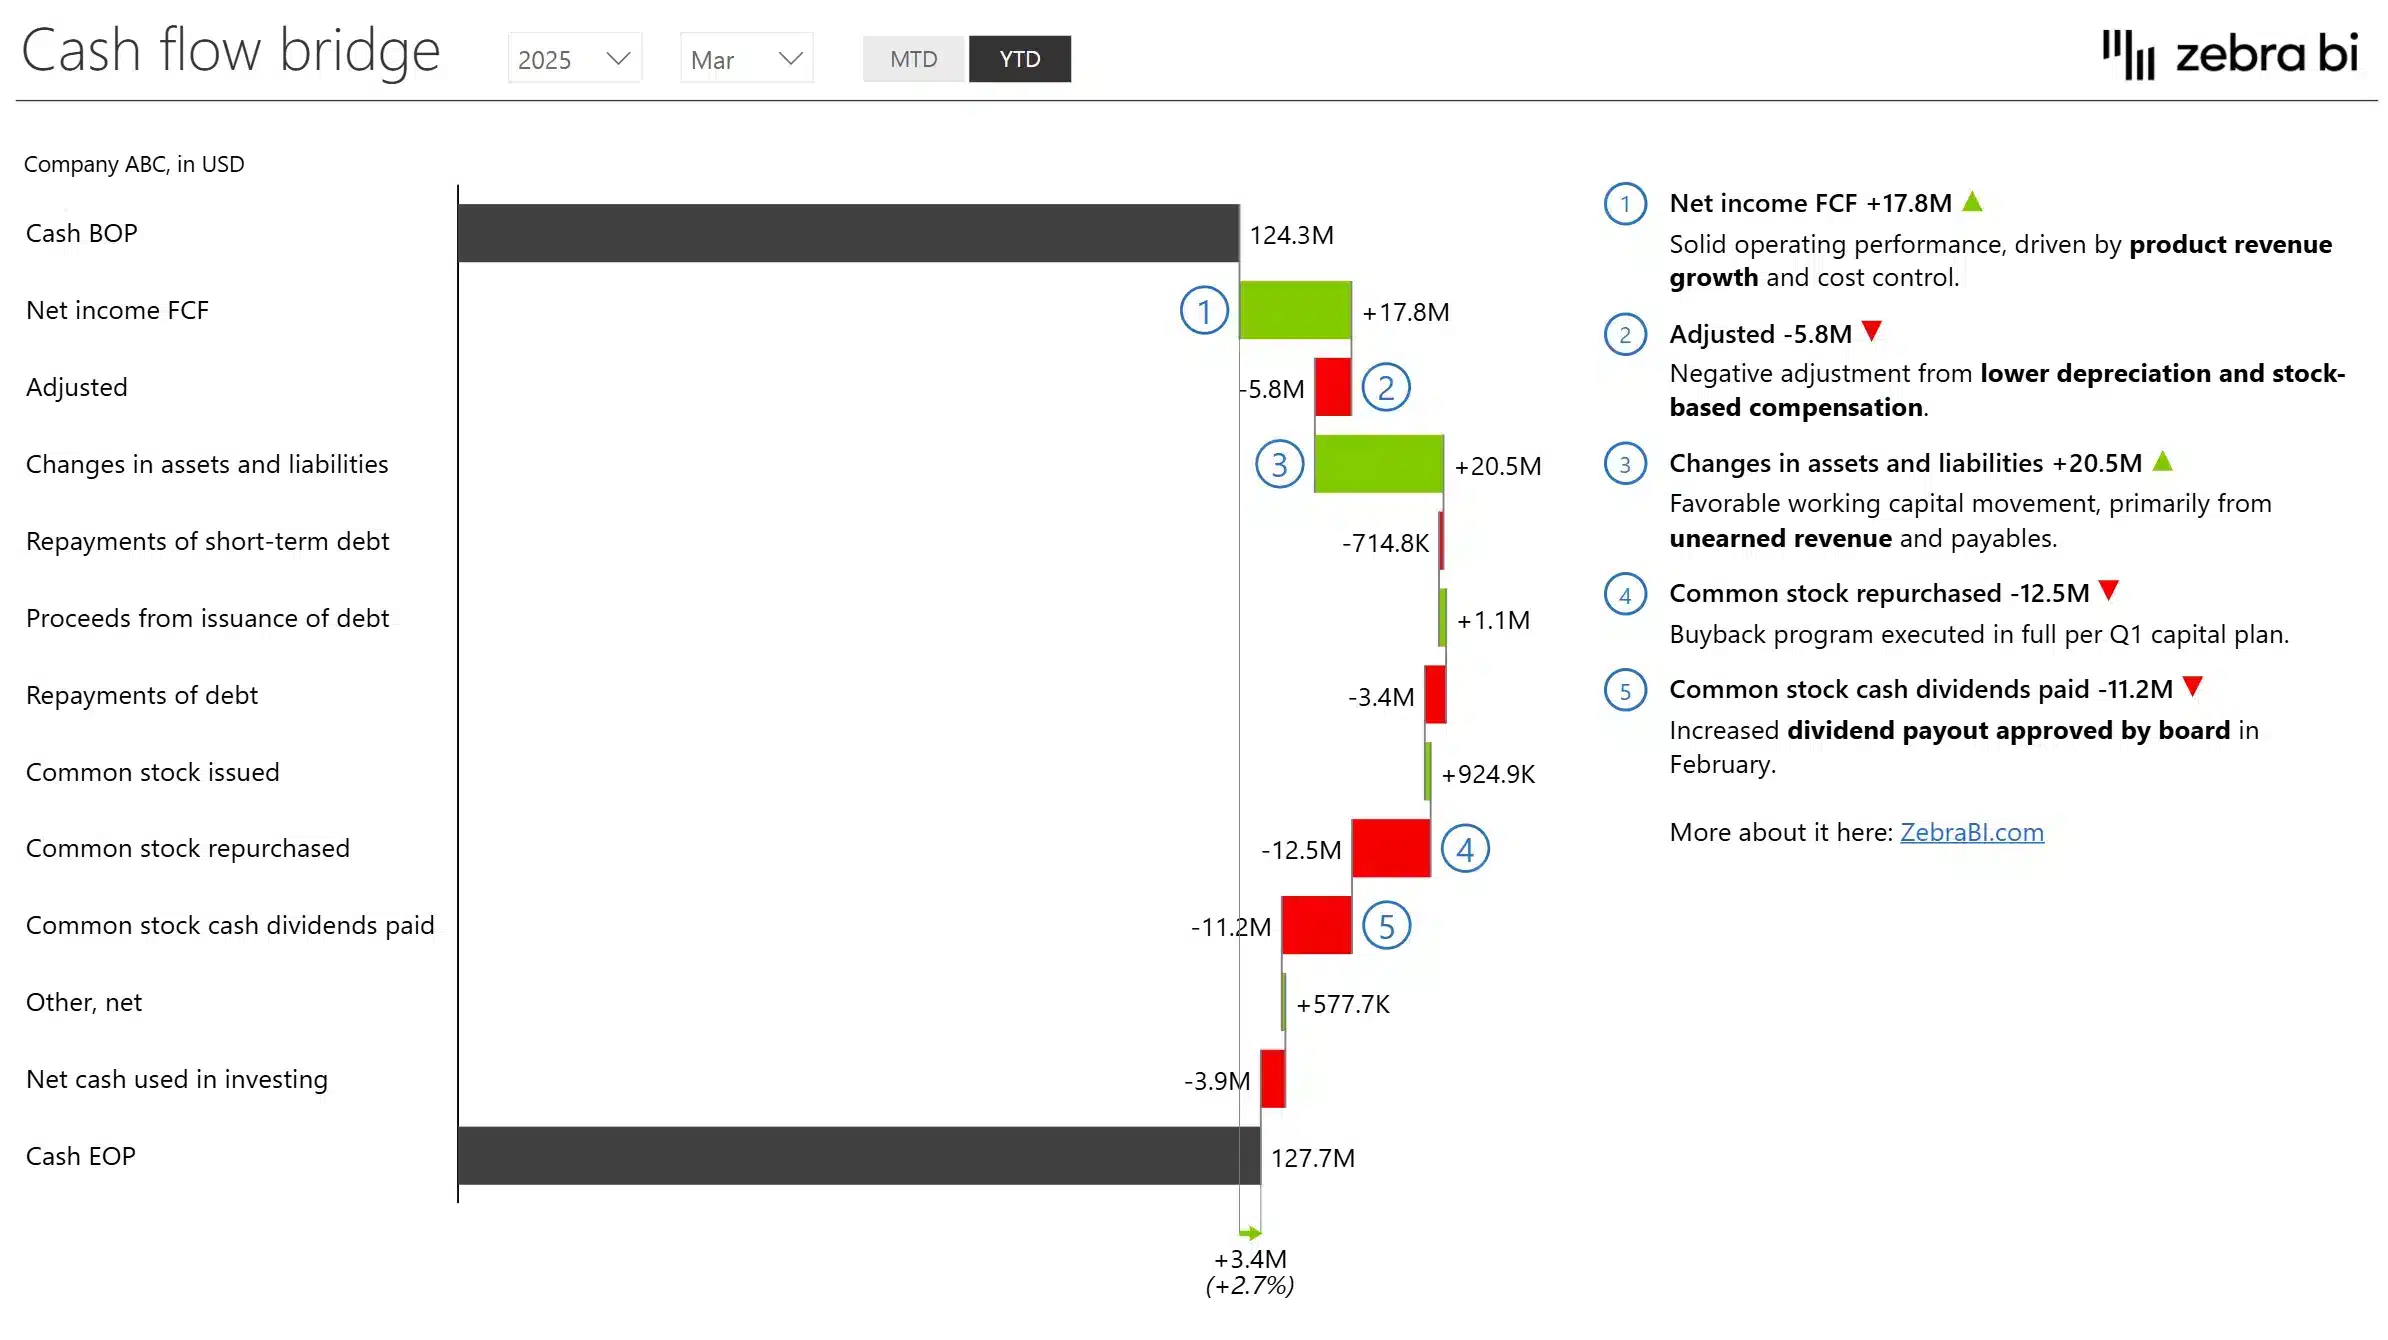
Cash Flow
Budget vs Actuals
Forecast vs Actuals
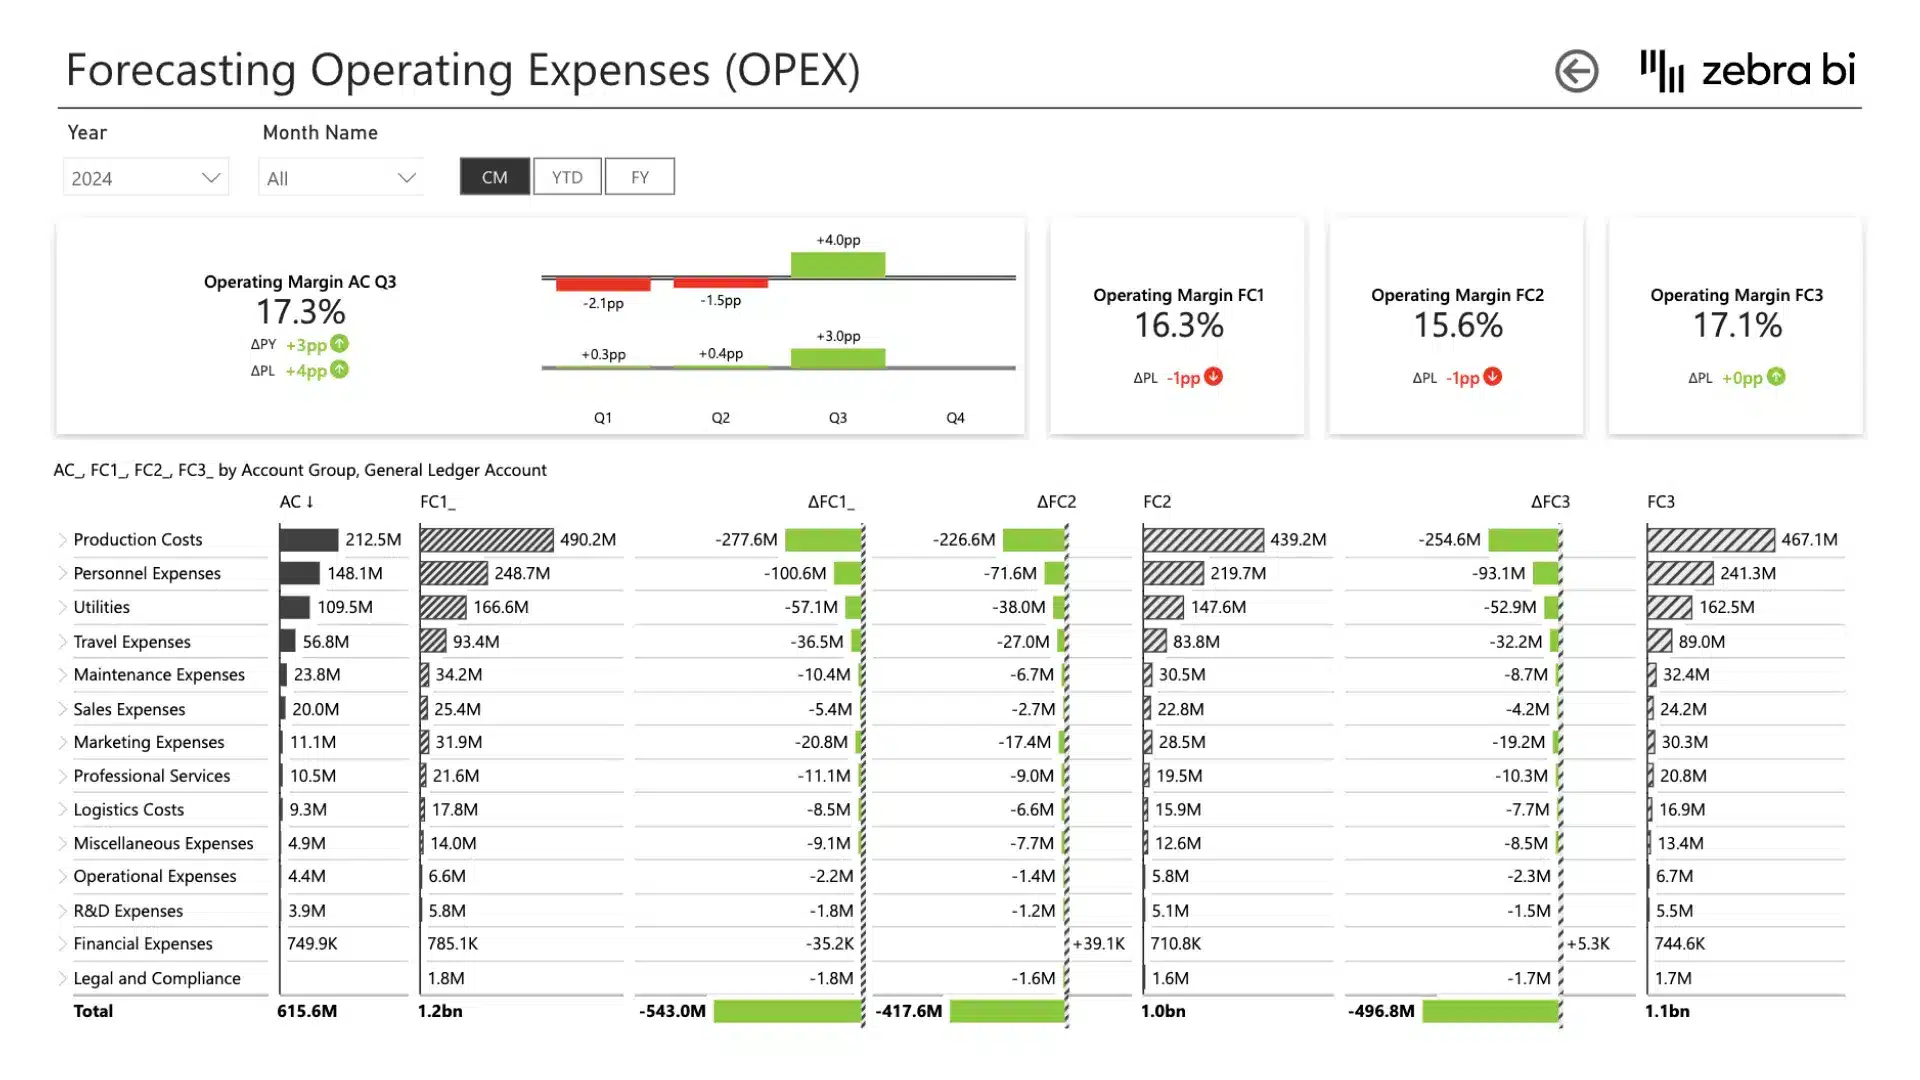
Cost Management
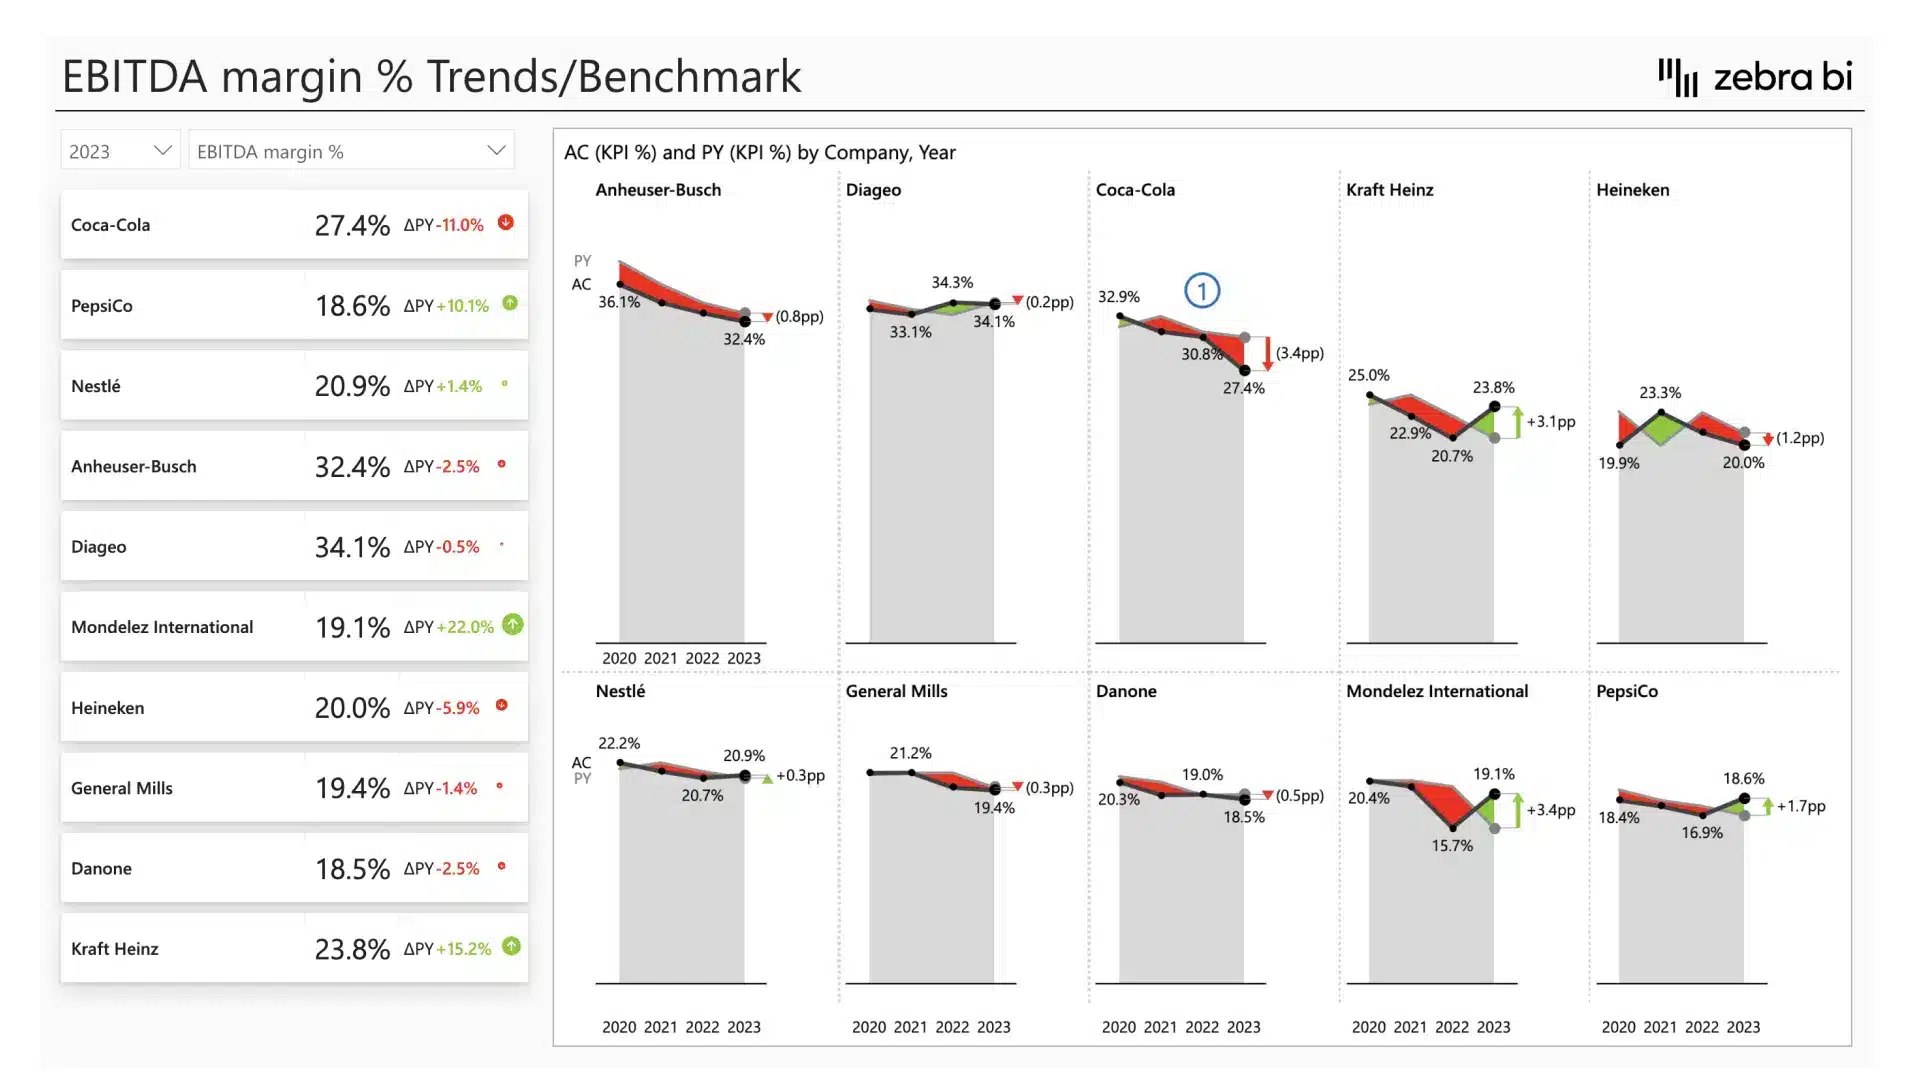
Financial Benchmarking
Management Reporting
Consolidated Financials
AR / Collections
No more DAX workarounds
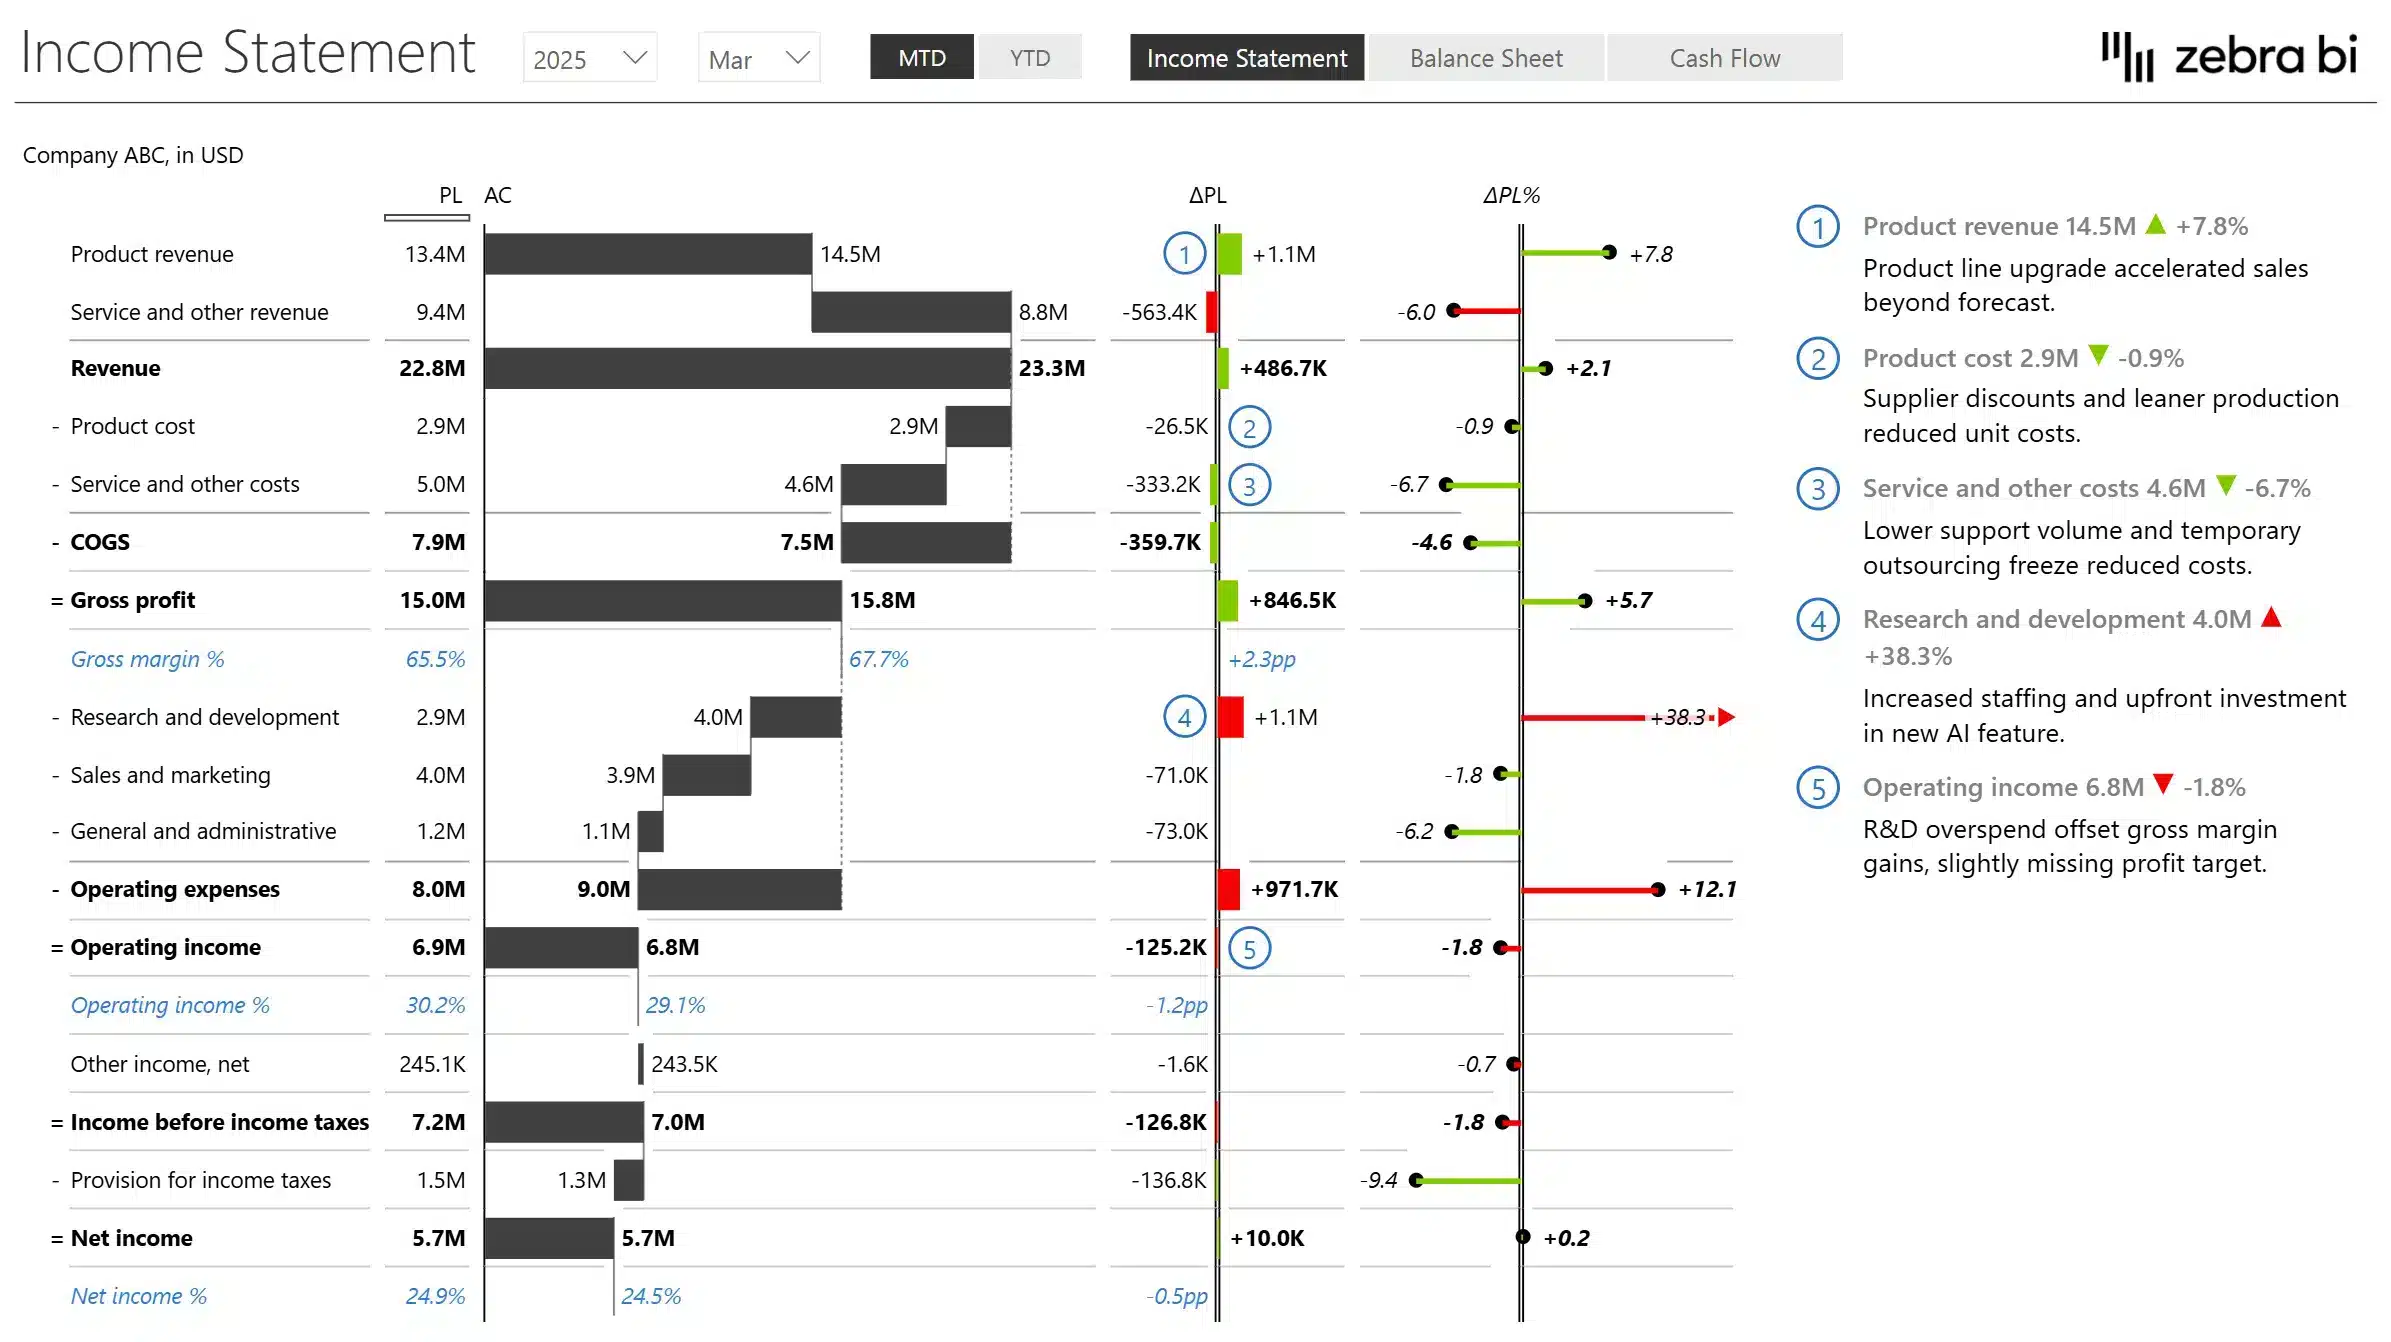
Automatic variance calculations, financial hierarchies, and P&L structures built in.
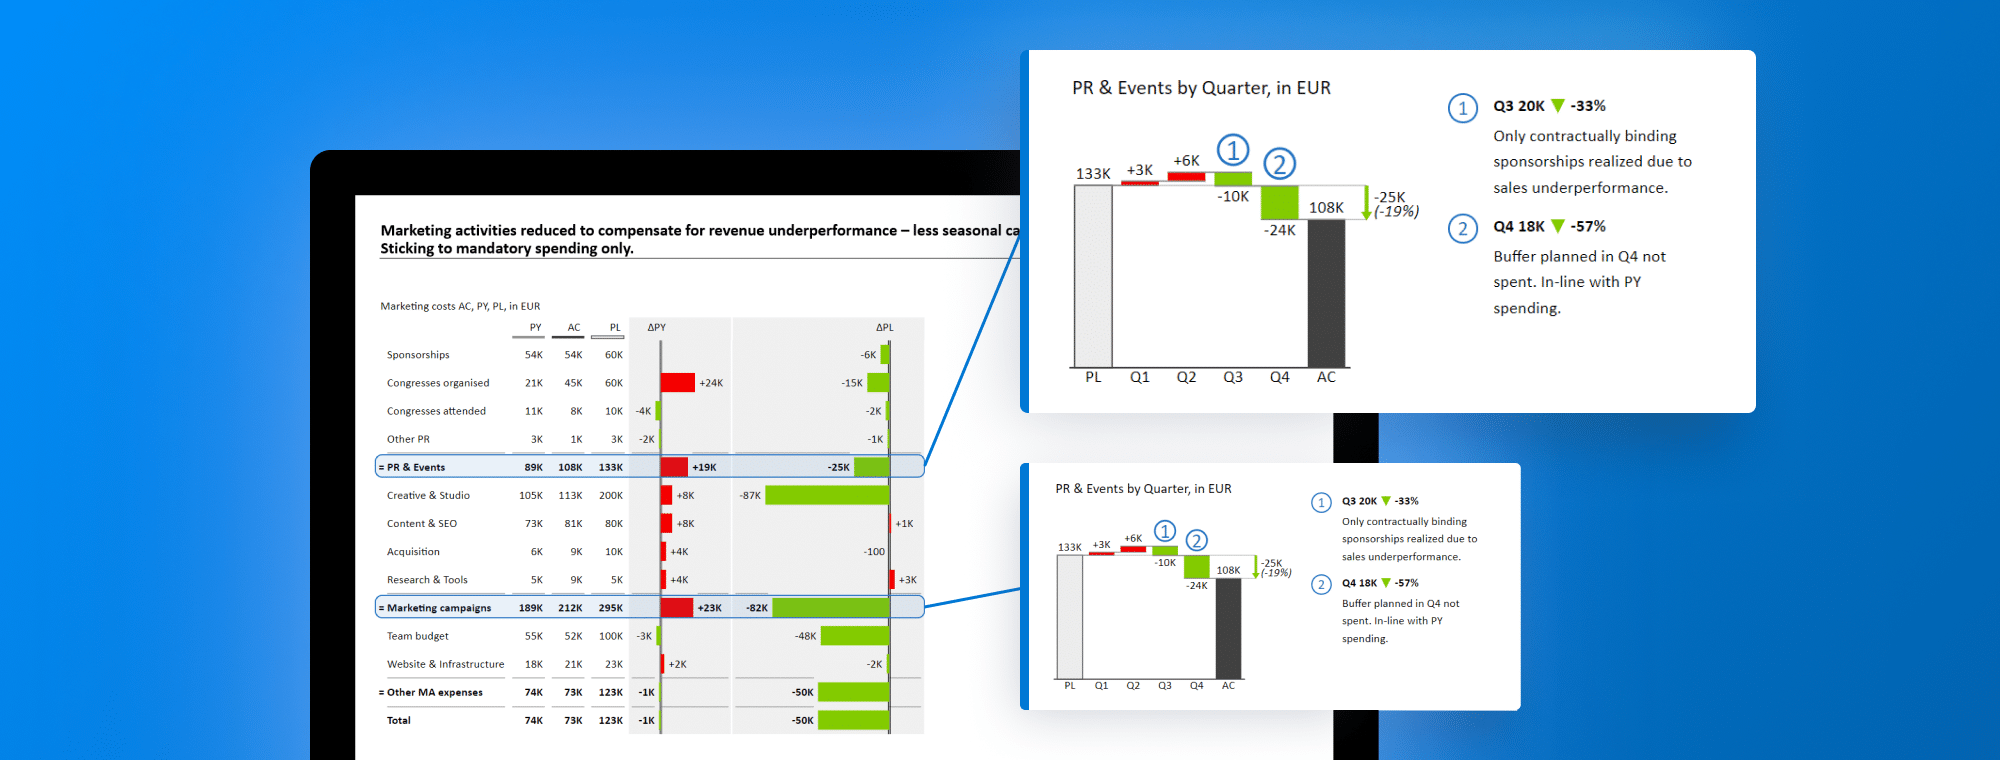
Reports that explain themselves
Dynamic comments, annotations, and integrated charts let the story live next to the number.
Up and running before your next close
Simple drag and drop inside your existing Power BI canvas. No new environment to learn.
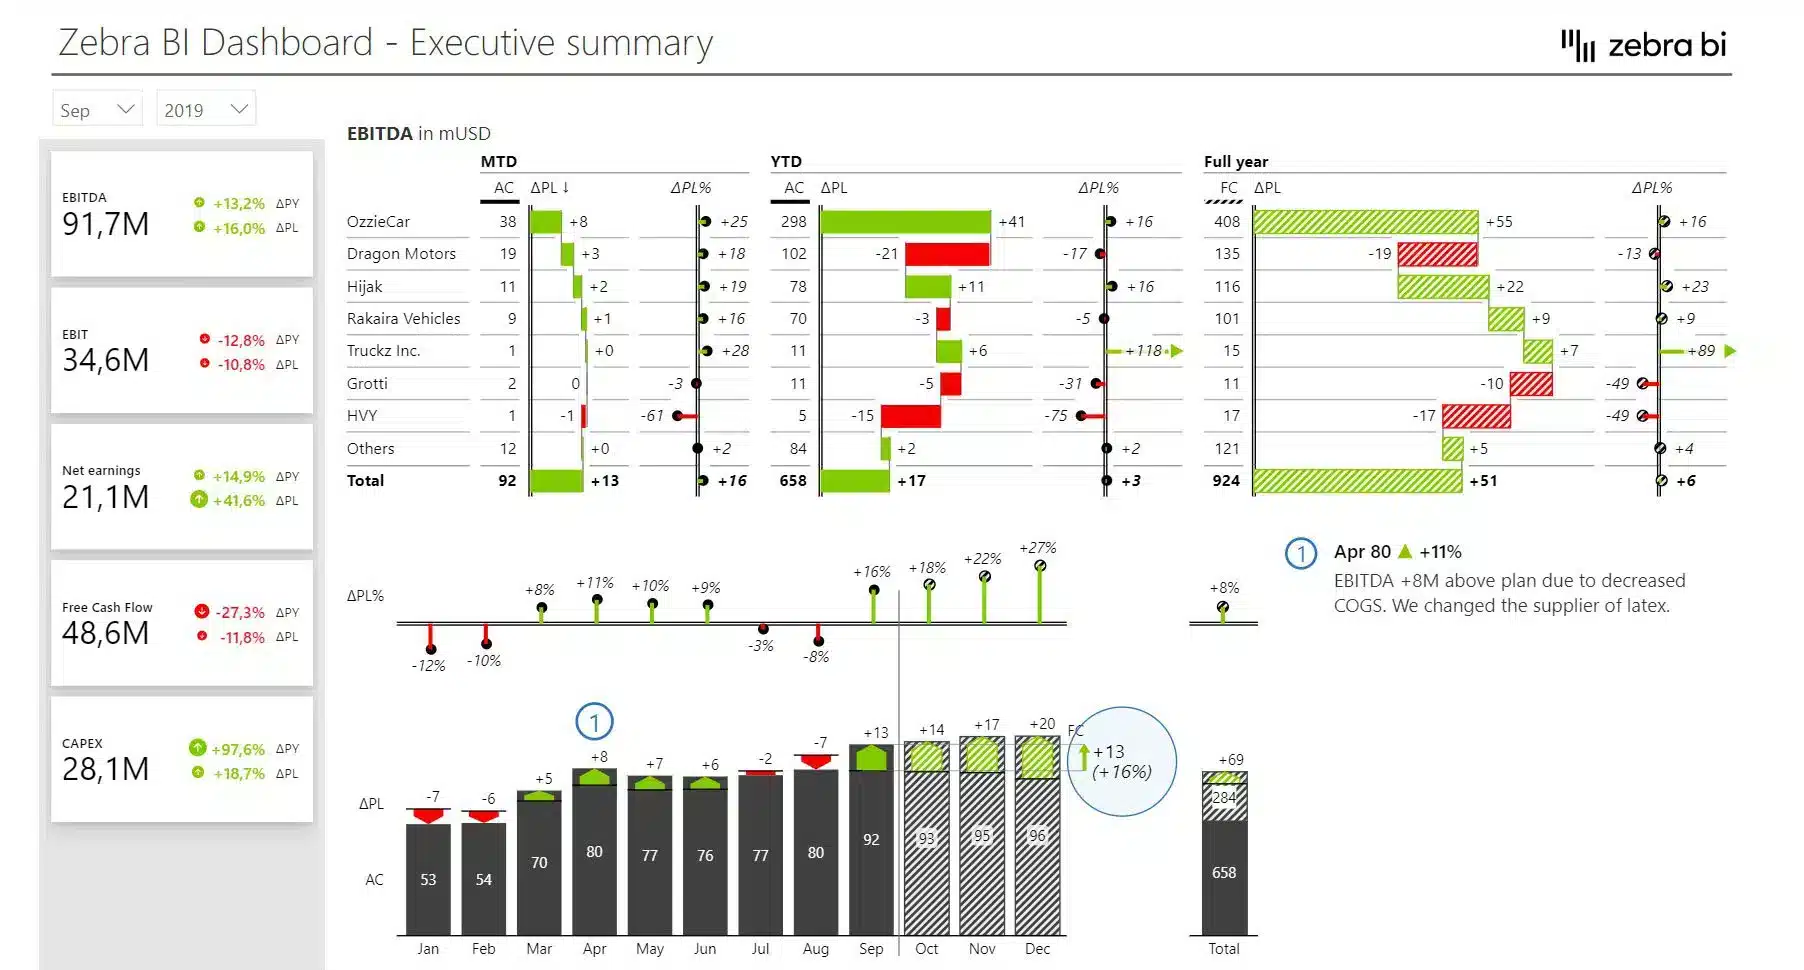
Consistency out of the box
Every report follows the same visual logic (IBCS) automatically, so leadership reads any business unit report the same way: no internal style guide debates, no formatting decisions.
Zebra BI visuals work directly inside Power BI. Connect to the data model you already have. No new data warehouse, no new infrastructure.
2
Build
Drop Zebra BI visuals onto your canvas. The P&L hierarchy builds itself. Variances calculate automatically. IBCS formatting applied by default. A report that would have taken three days to format is done before lunch.
3
Publish
Share through the Power BI service your organisation already uses. Executives open reports in Teams or their browser, no extra apps, no training required.
4
Decide
The meeting starts with the answer, not a walkthrough. Dynamic comments explain the "why" directly in the report. The analyst advises. The CFO decides. The cycle shrinks.
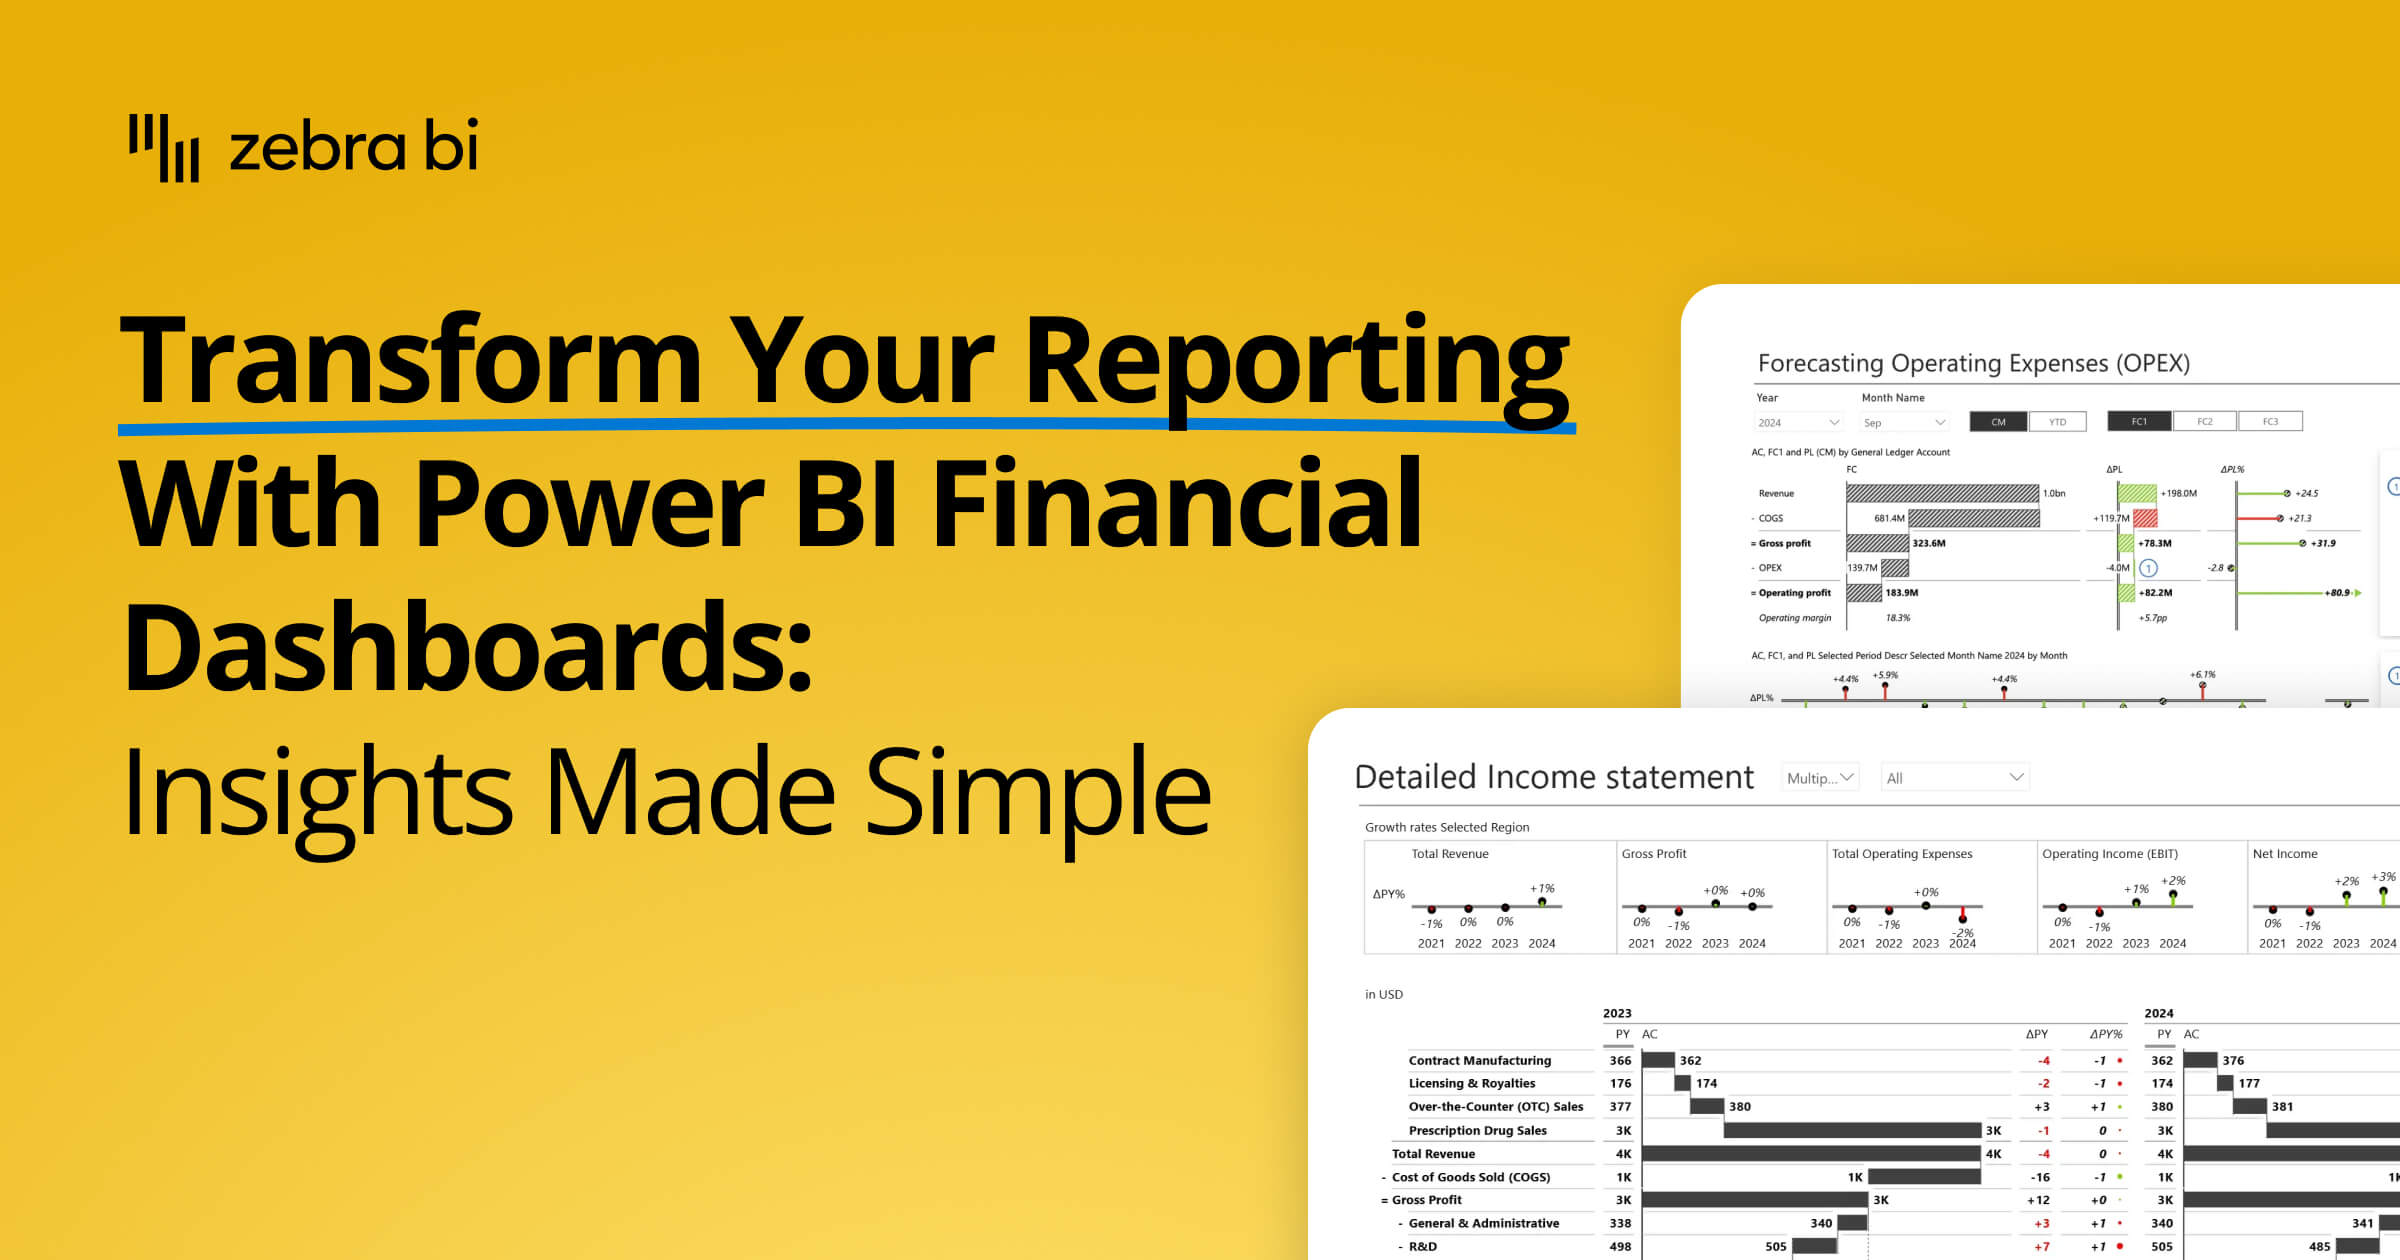
Transform your financial dashboards in Power BI. This guide shows you how to build lean, insightful reports for P&L, trend analysis, and cost management.
Join our live webinar to learn how to use Zebra AI to turn raw finance and business data into executive-ready dashboards that help Controlling & FP&A teams explain performance.
Modern CFOs are moving beyond spreadsheets to lead with data. In this webinar, you’ll learn how Power BI and AI are transforming financial reporting—turning static numbers into strategic insights.
How can CFOs navigate the complex landscape of financial reporting and driving decision-making in 2025? Here's what you need to know about the Office of the CFO and how to turn a seemingly increasing number of responsibilities into wins for your organization.
Ready to stop explaining your reports and start driving decisions with them?
Try Zebra BI directly on your data, no credit card required. See what your financial reports look like when leadership actually uses them. Or talk to our team and we'll show you what's possible for your specific setup.
 September 8th
 February 22nd