Stop explaining the pipeline. Start building reports that speak for themselves.
Zebra BI gives your sales data a visual layer that makes pipeline, quota, and forecast immediately readable, for the rep in the field, the manager in the meeting, and the VP on the call.
"I built the dashboard. They still run the Monday call from a spreadsheet."
"Reps keep asking where they stand on quota. I built the report."
"It breaks on mobile. Field teams have no view."
Sales reporting should be straightforward. The data is in the CRM. The targets are set. The metrics are defined. Yet on every pipeline call, sales leaders and sales reps are left guessing, forced to dig, export, and interpret instead of act. Inaction costs money.
It's not a data problem. It's a gap between data and decisions. Zebra BI closes it, so everyone in your sales org, from rep to boardroom, gets the answer in seconds.
"From building one report that everyone could use, we saved about one to two annual analysts’ worth of time across all of our teams by consolidating and automating reports with Zebra BI."
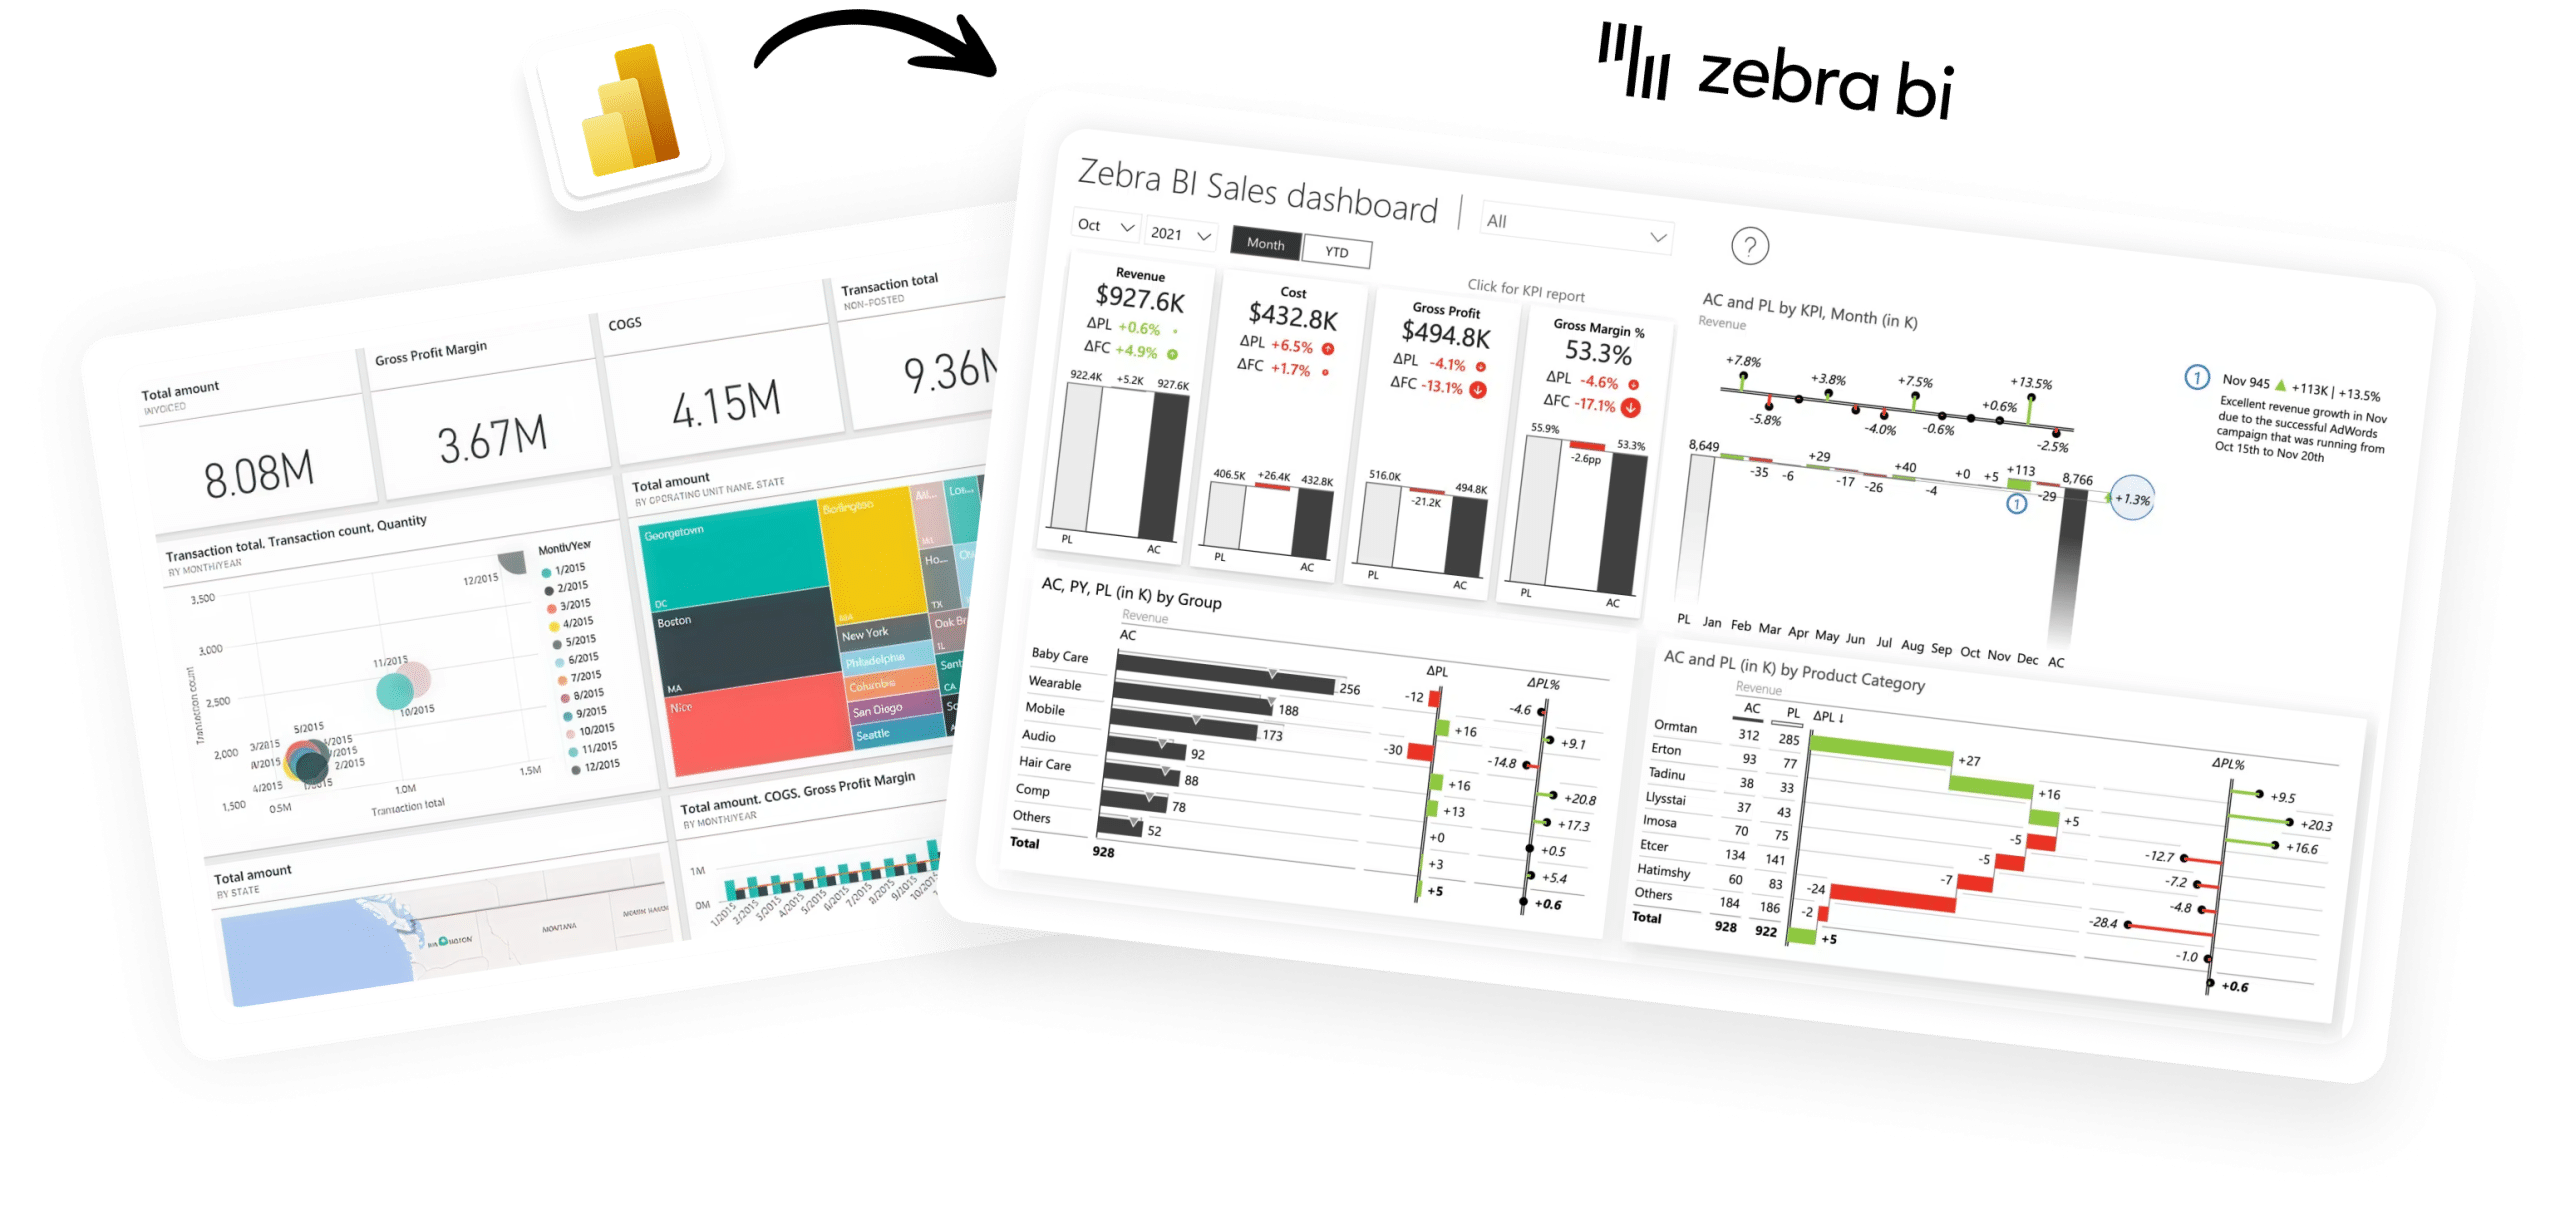
The sales reporting layer your Power BI setup has been missing
Microsoft gives you the data platform. Zebra BI gives you the visual standard, so the reports you build for Sales are as clear and decision-ready as any other department's.
Power BI
Excel
PowerPoint
BI teams use Zebra BI to build:
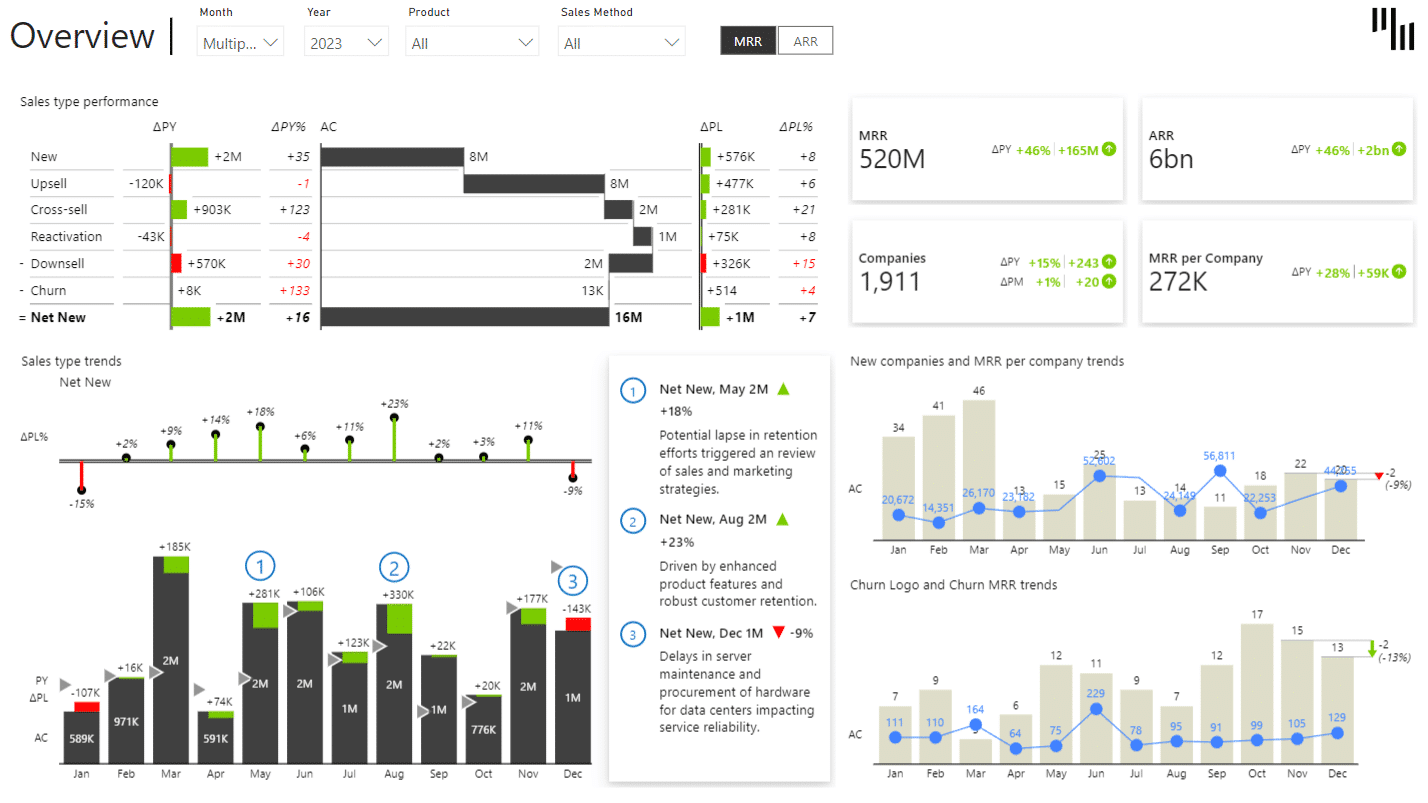
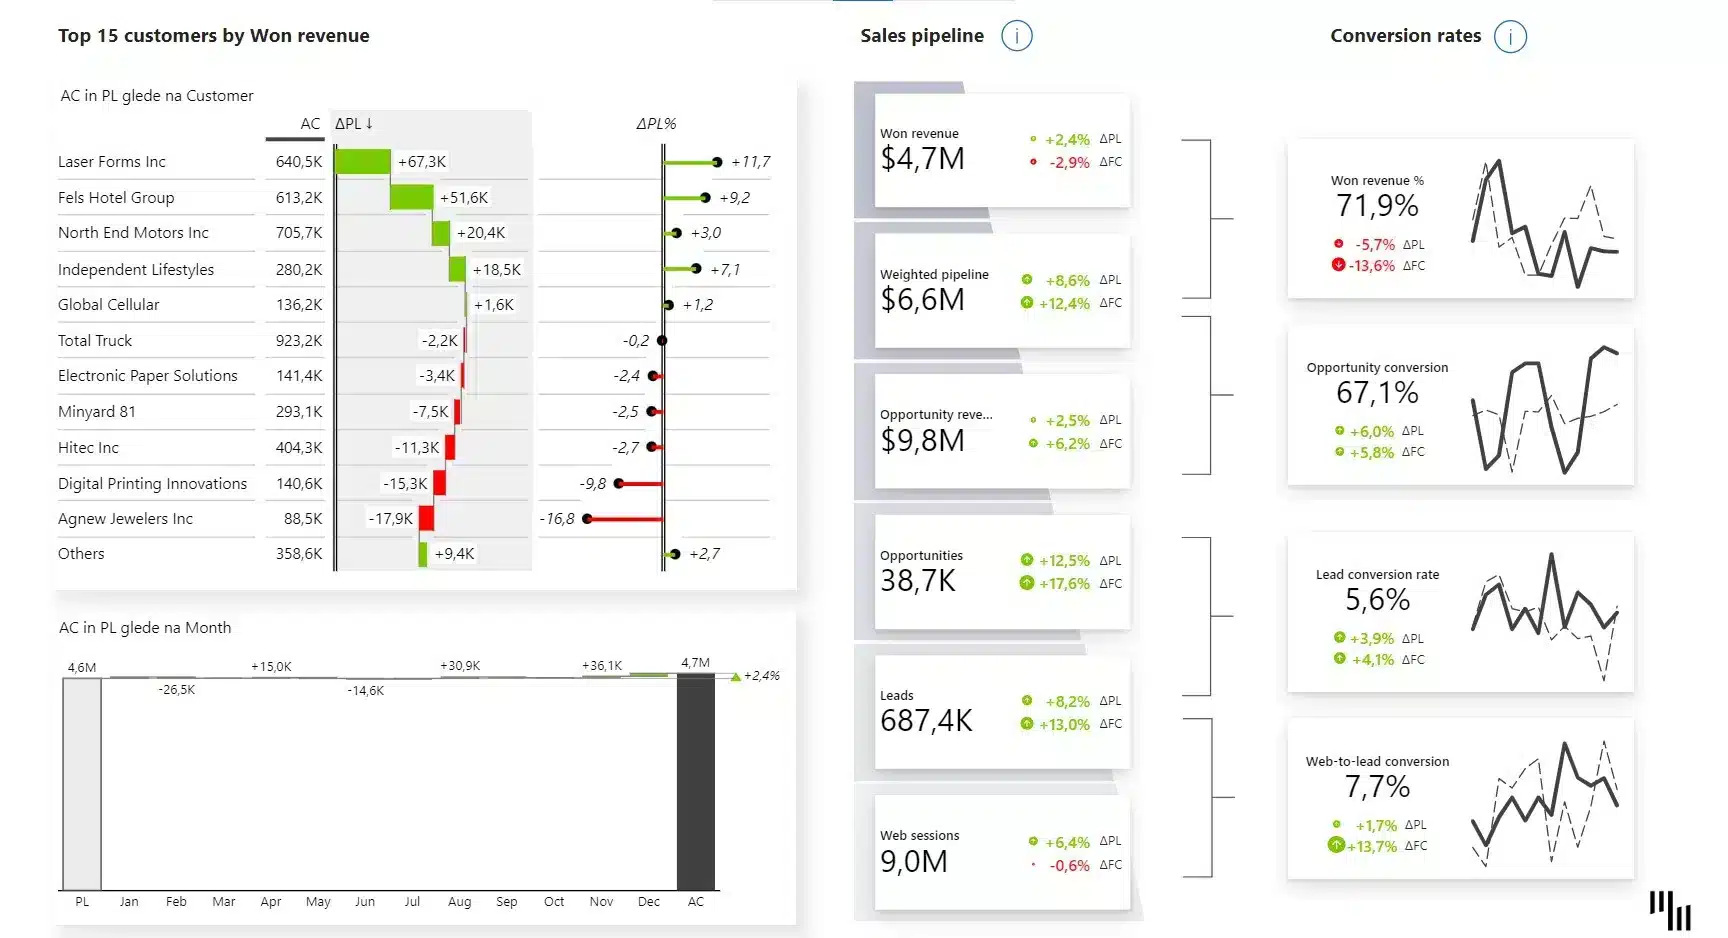
Pipeline Overview
Quota Attainment
End-of-Month Forecast
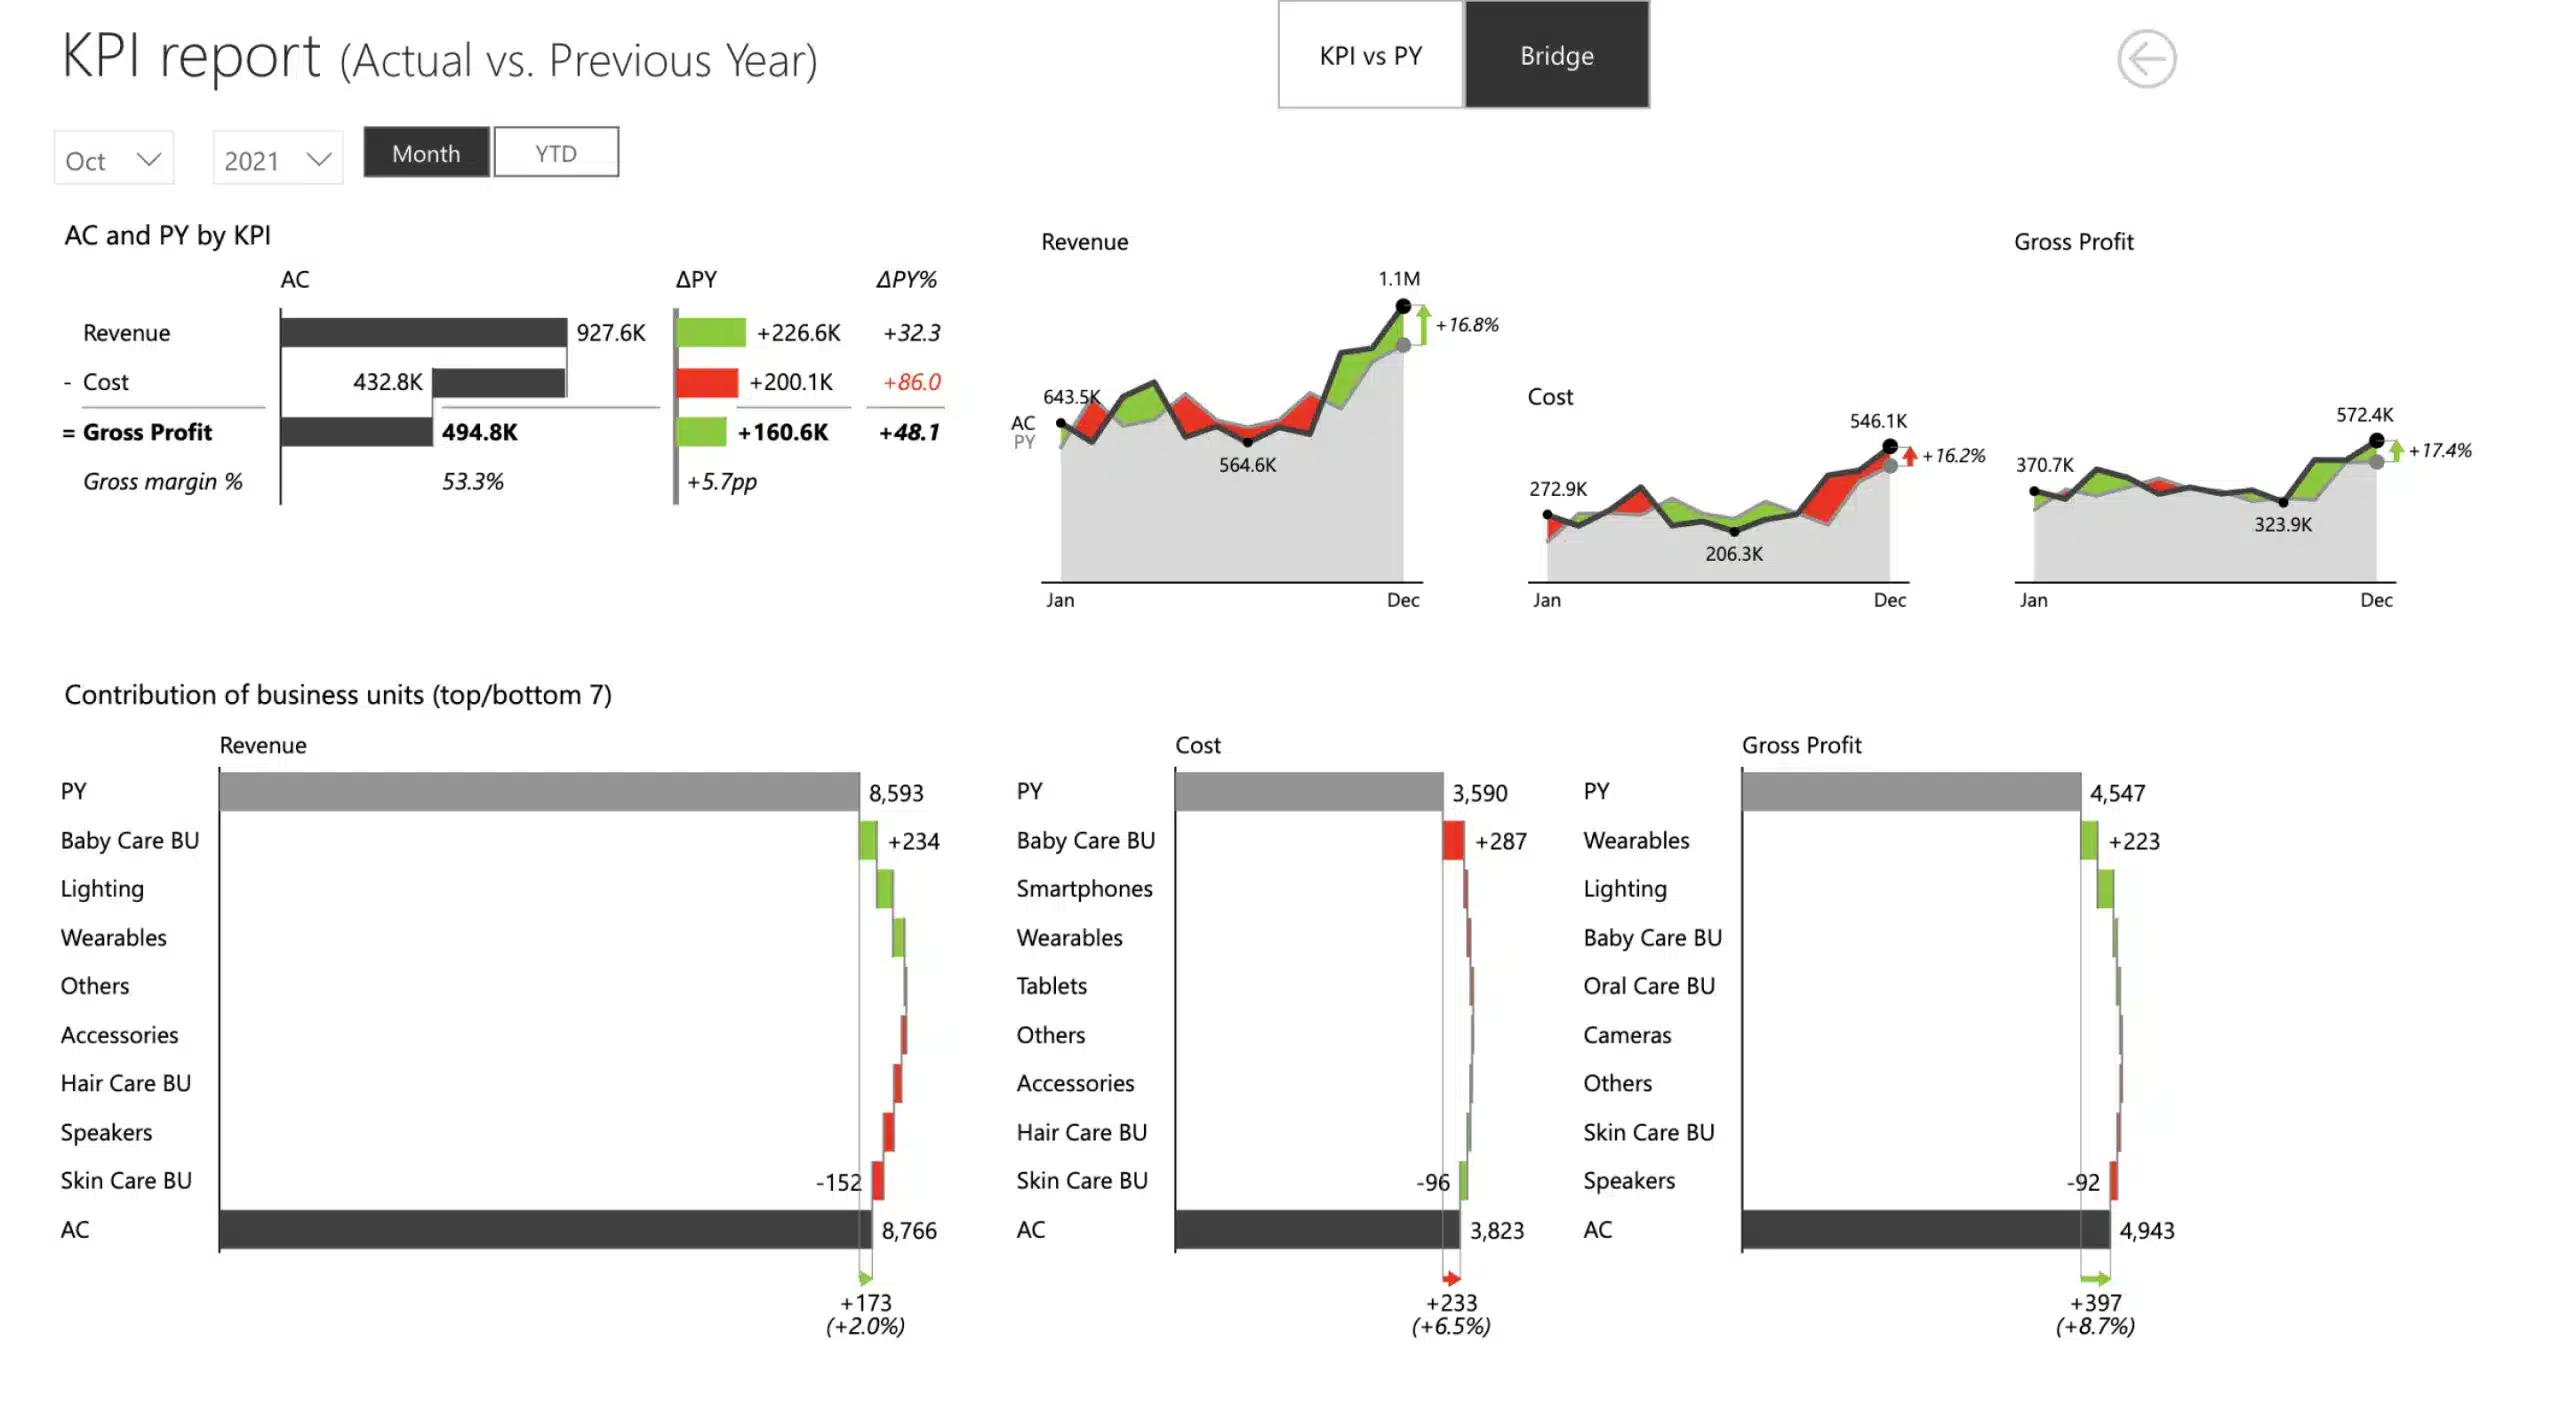
Forecast vs. Actuals
Commission Tracking
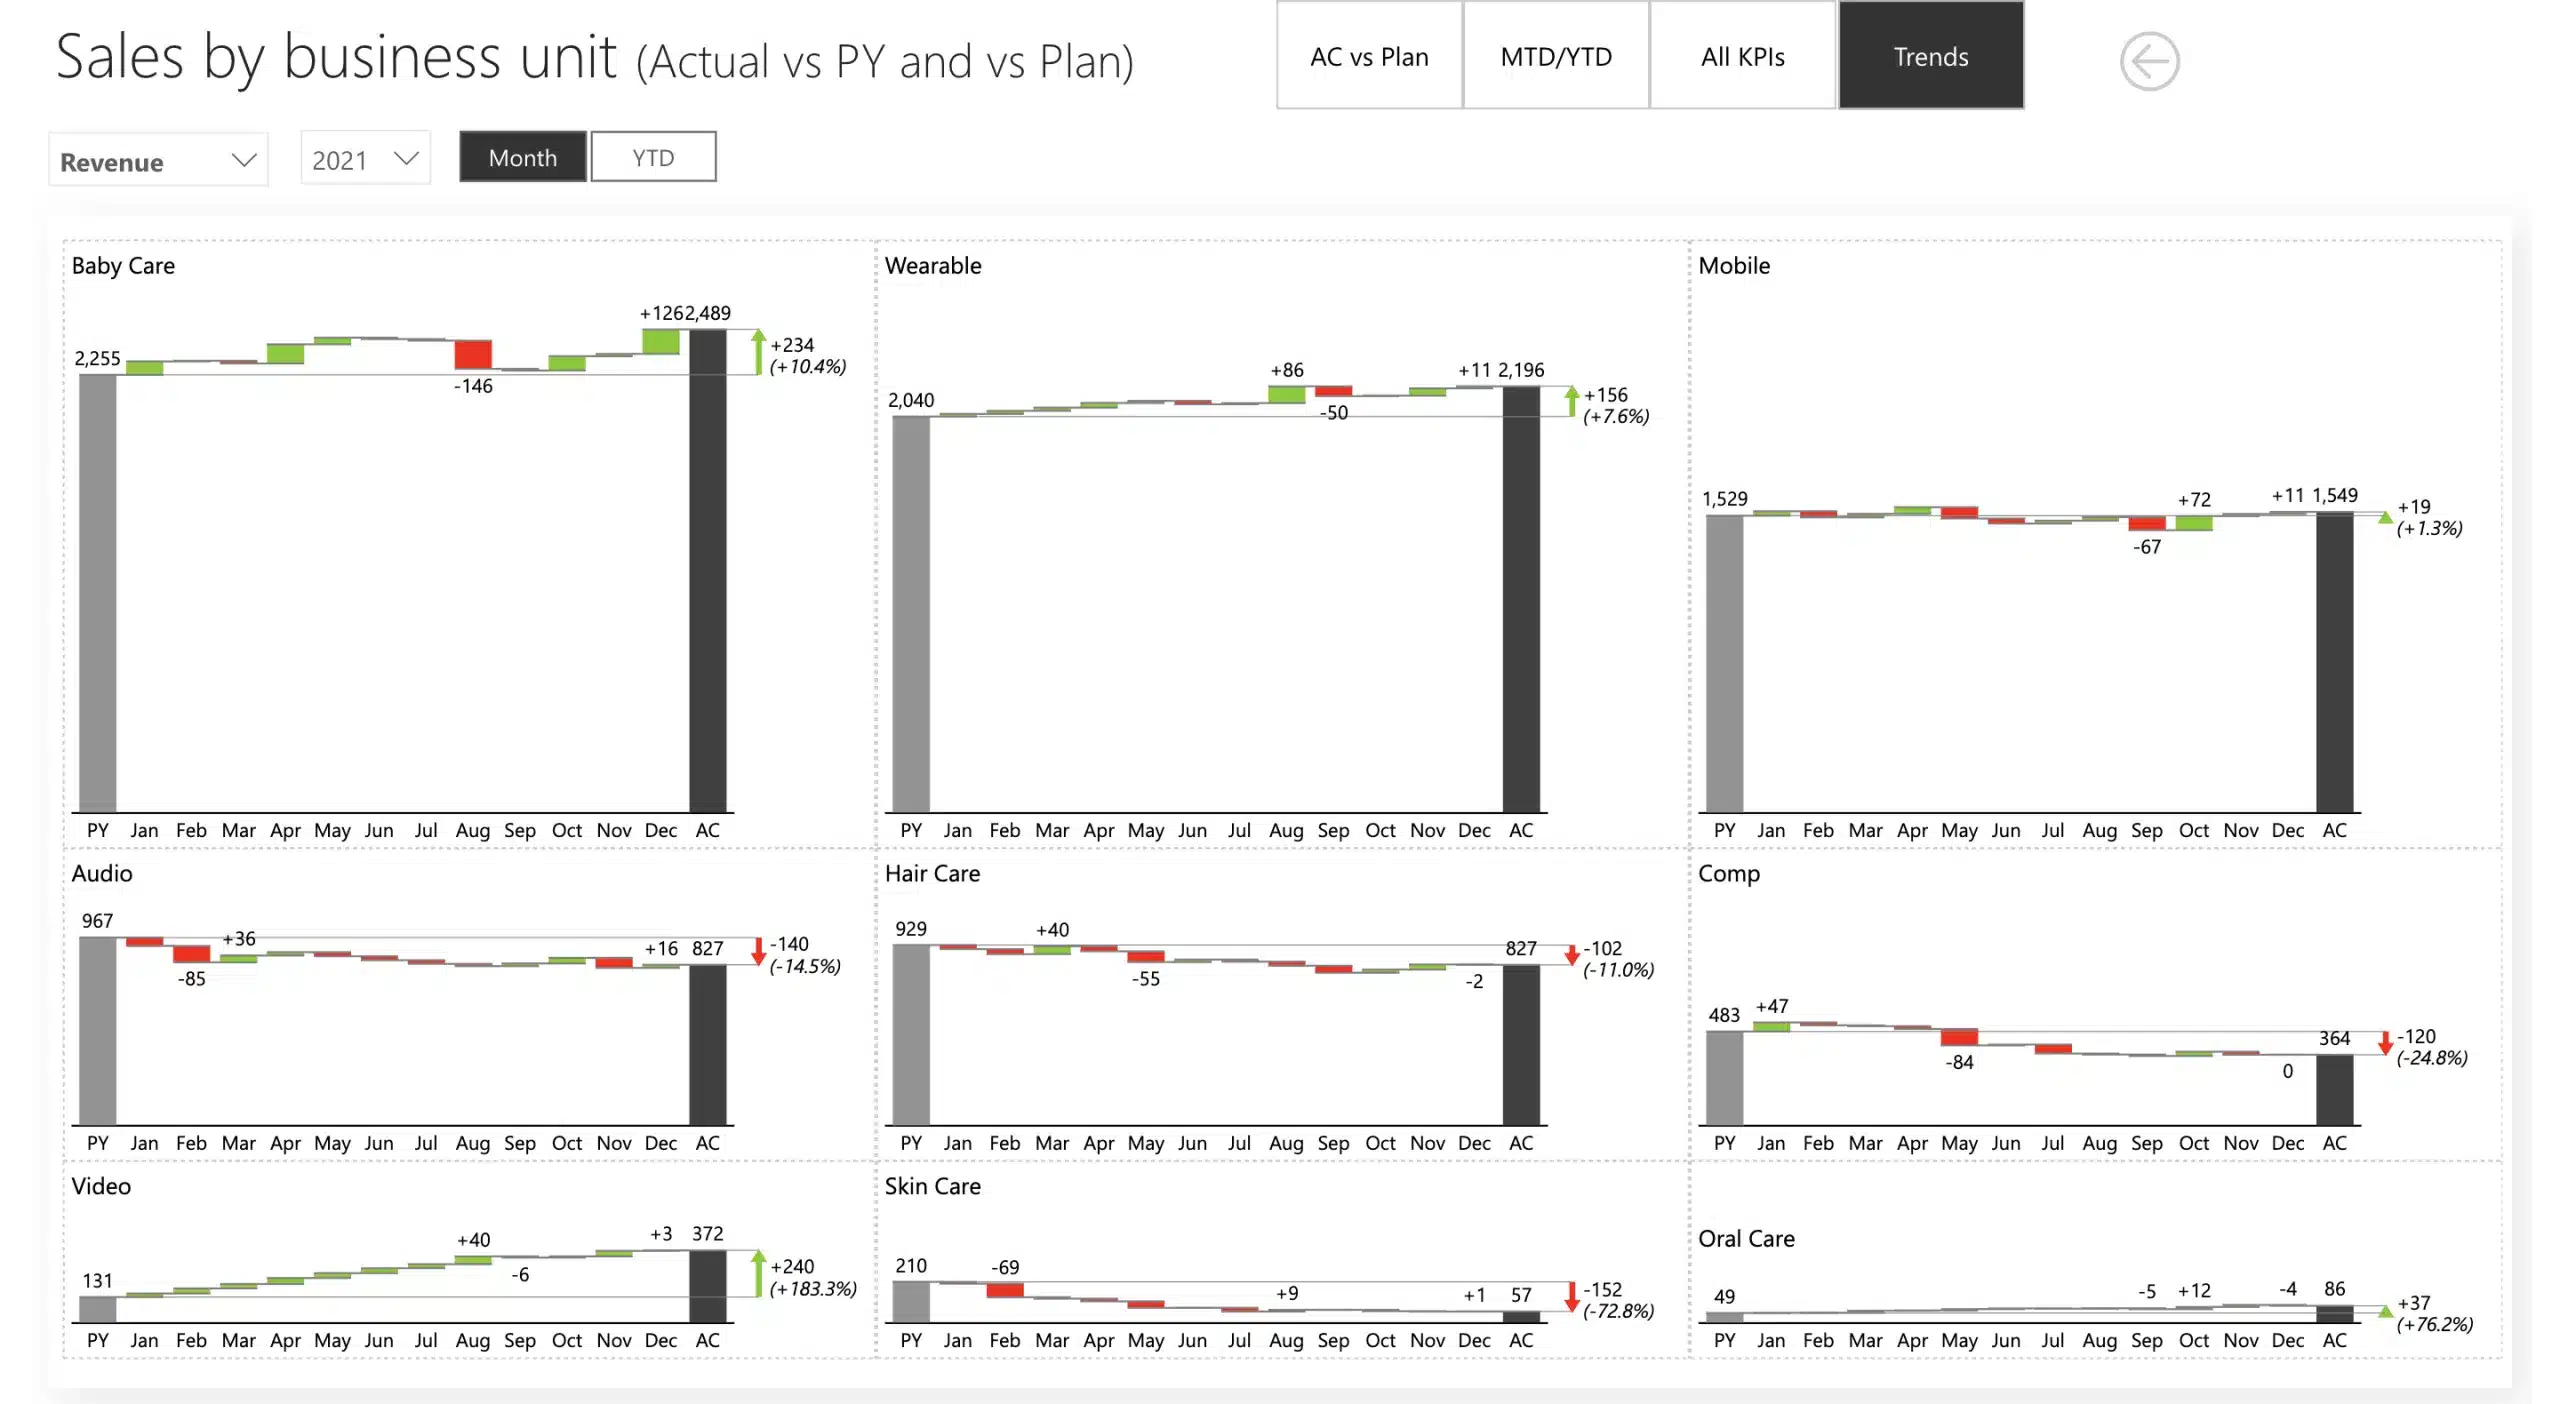
Revenue by Region & Channel
Revenue Waterfall
Territory Performance
Sales QBR
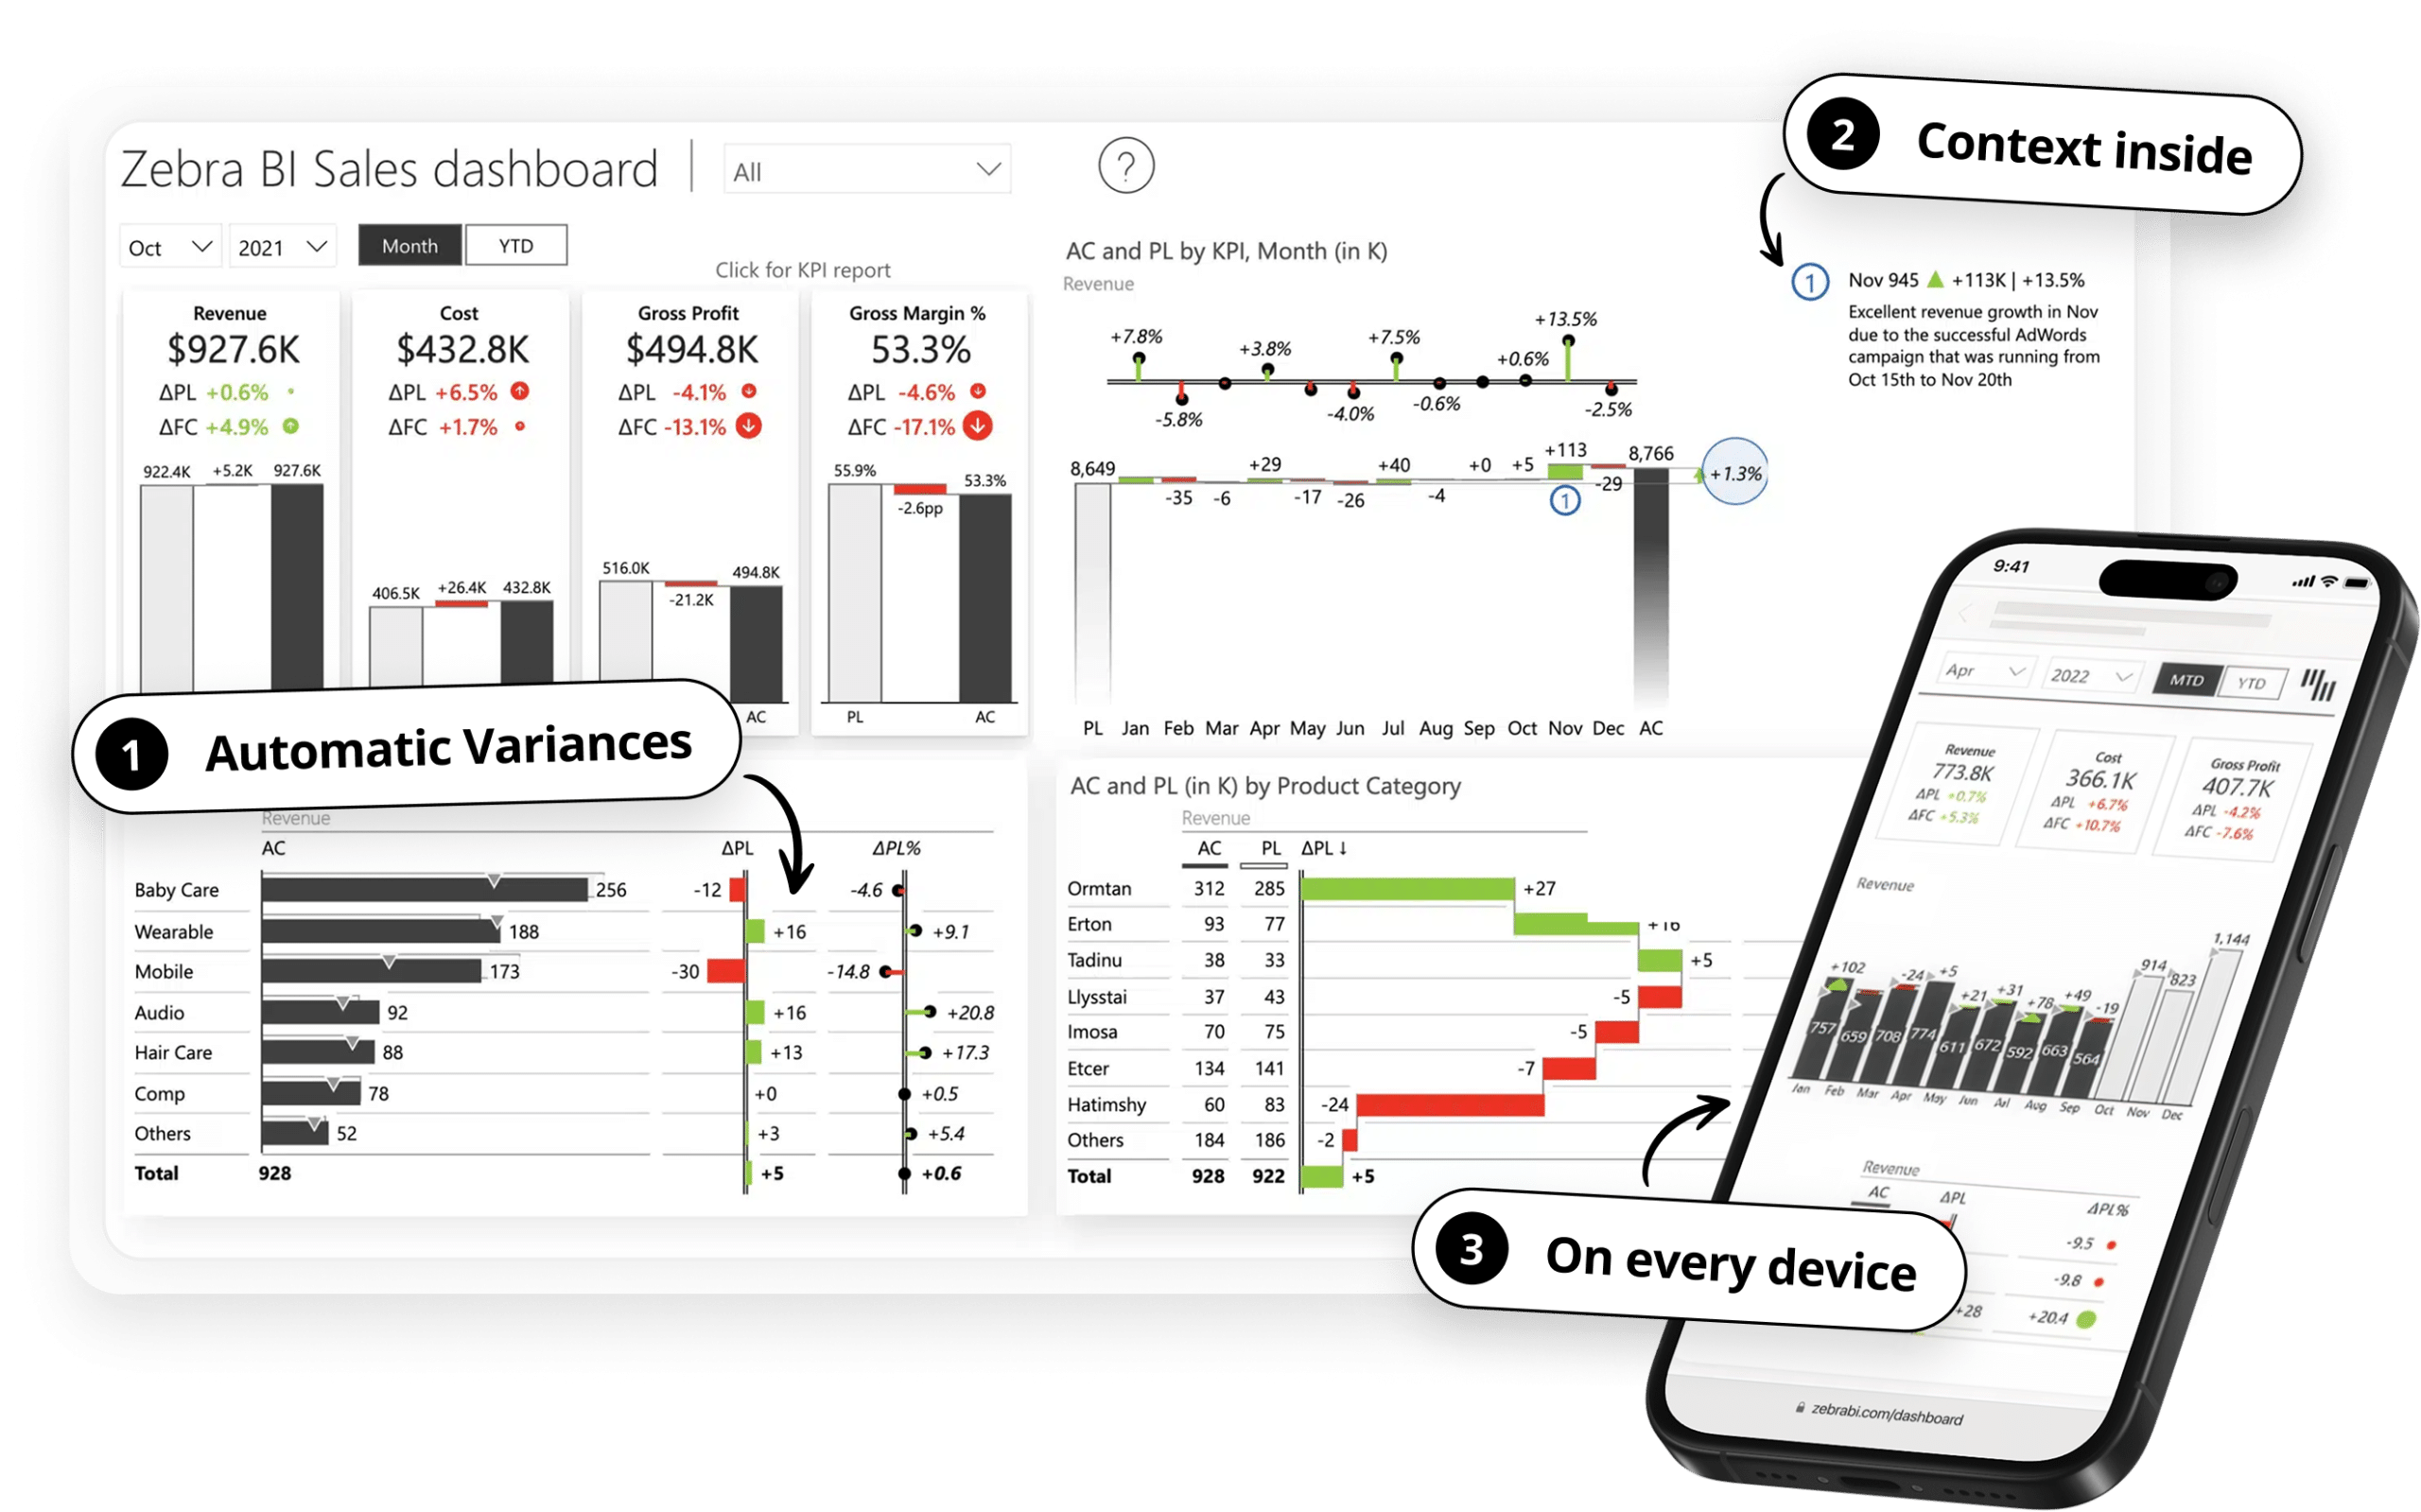
Instant clarity
Automatic variances, Top N with Others, and highlights help focus attention where it's needed.
Question answered before asked
Dynamic comments and annotations answer the why before anyone asks.
One report, every role
Executives see the full org, managers see their team, reps see their data. With role-level security you only build once. For everyone.
Works wherever sales reps work
Desktop report and mobile layout on the same data model. One source of truth, every device.
One standard across departments
One visual language (IBCS) built into the tool for easier and faster understanding across finance, marketing, operations, and more.
From CRM data to a decision-ready sales dashboard, inside Power BI
1
Connect
Zebra BI works directly inside Power BI. Connect to the CRM data model you already have: Salesforce, HubSpot, Dynamics, or any other source. No new infrastructure, no new environment to learn.
2
Build
Drop Zebra BI visuals onto your canvas. Pipeline stages structure themselves. Quota variances calculate automatically. IBCS formatting applied by default. Set up role-level security so every user sees exactly what's relevant to them. A dashboard that would have taken three days is ready before the Monday call.
3
Publish
Share through the Power BI service your org already uses. The desktop report opens in Teams or a browser. The mobile layout opens on any device, same data, optimized for the screen. No extra apps, no onboarding required.
4
Decide
The Monday pipeline call starts with the pipeline, not a debate about whose numbers are right. The rep already checked their quota status on the way in. Sales leadership reads the dashboard, asks better questions, and makes a call. The BI team moves on to the next build.
Go Deeper
Webinars & guides for BI teams building sales reports
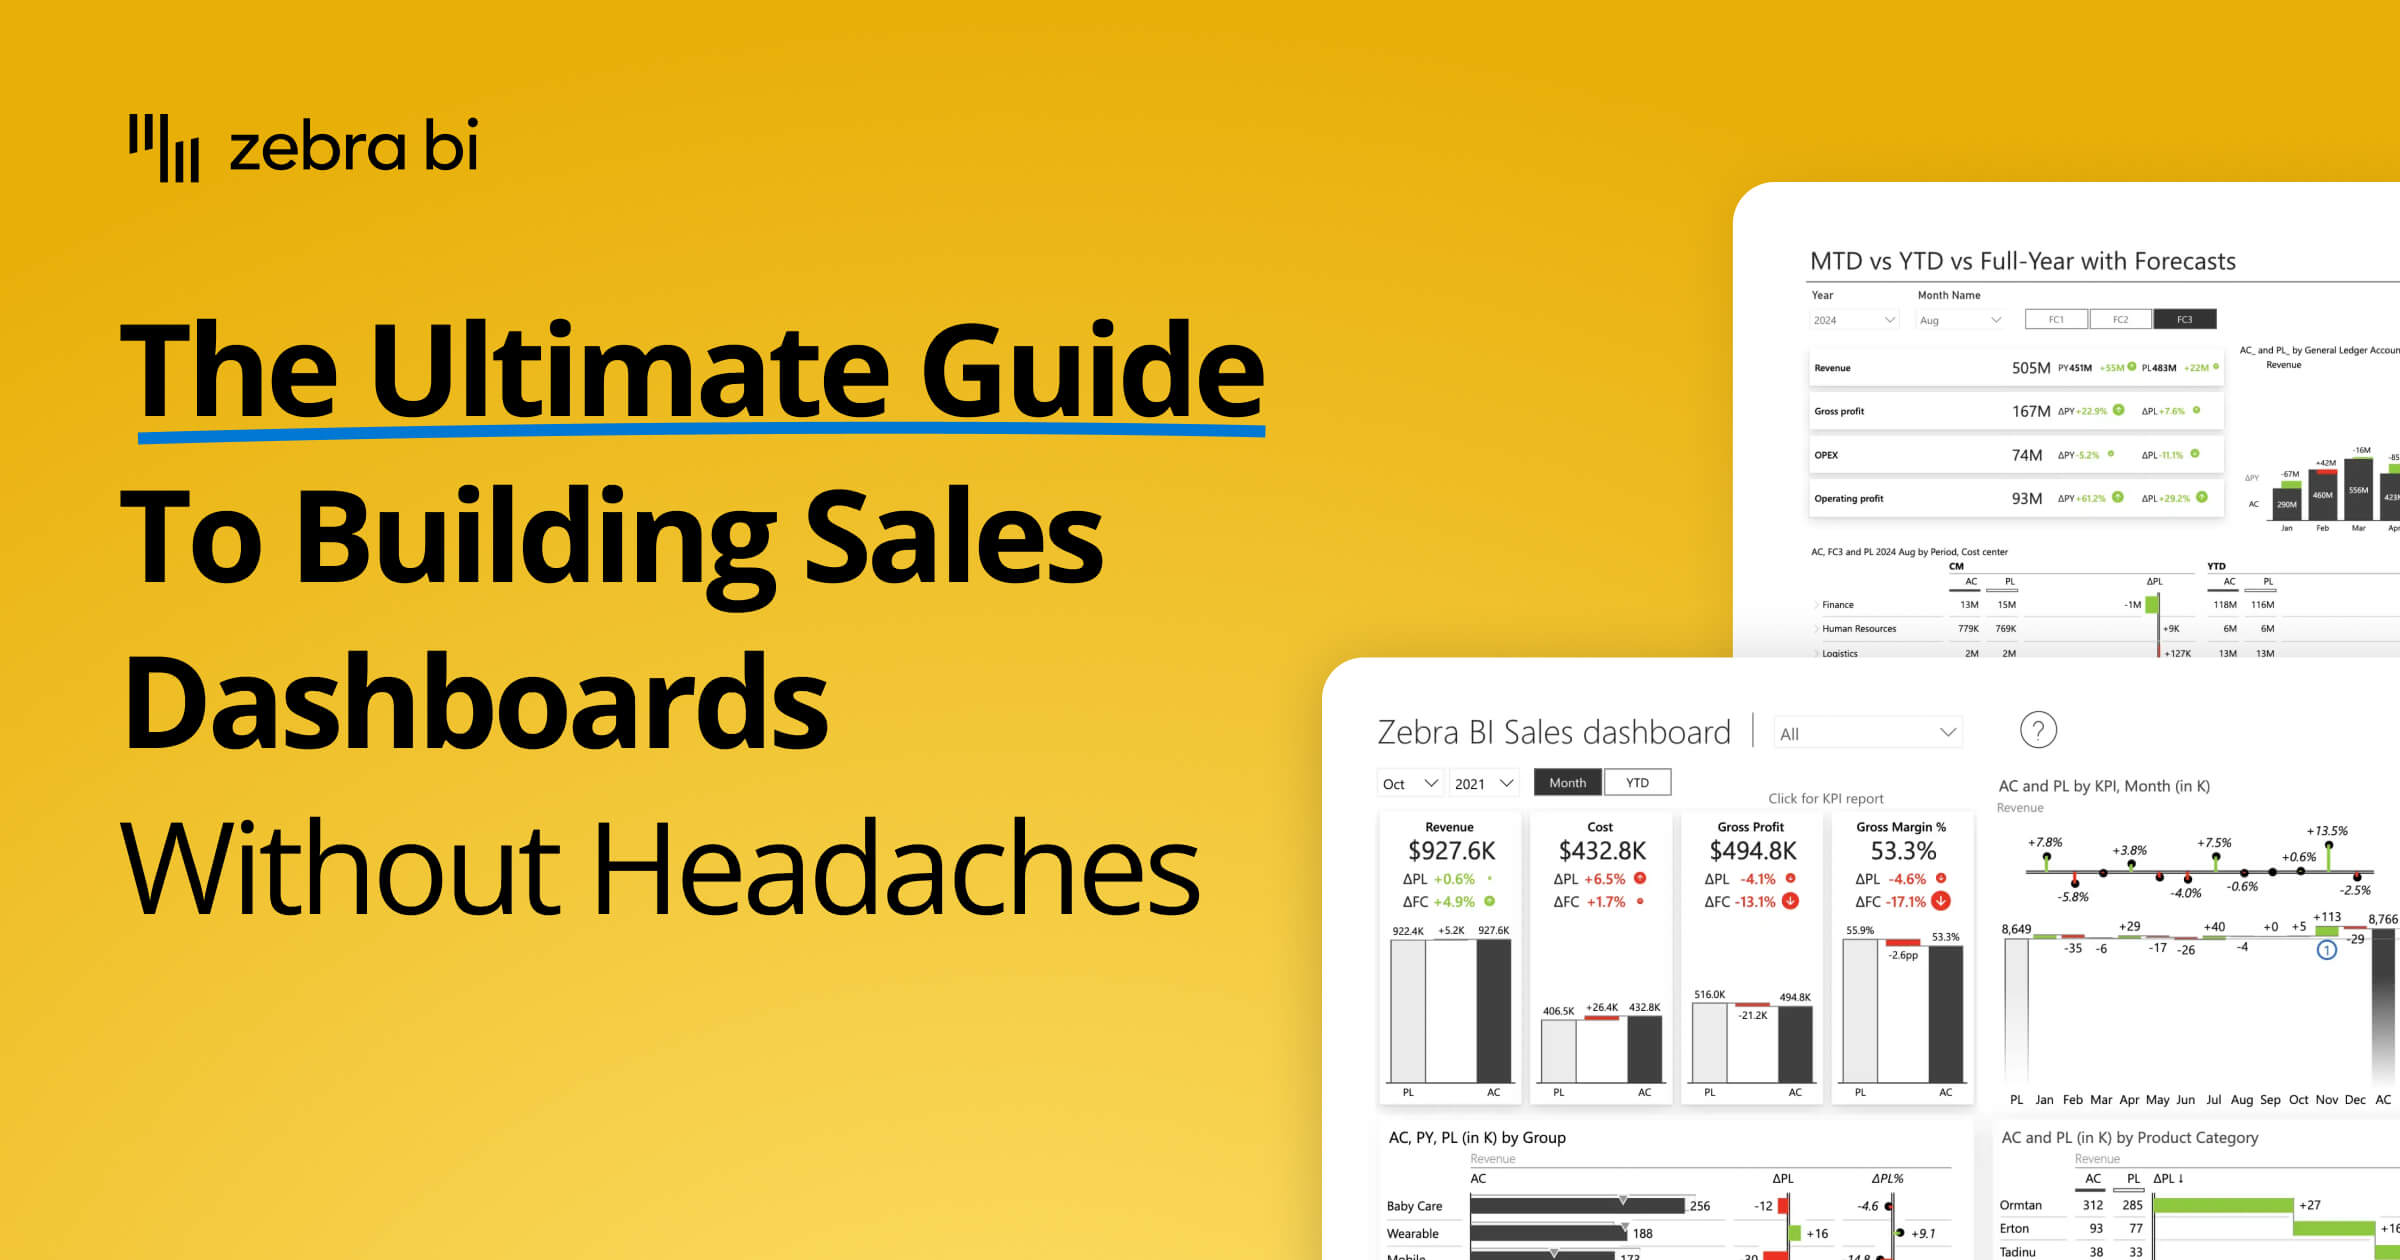
Not sure where to start with your Power BI sales dashboard or how to optimize it? Here is a comprehensive guide that will help you make the most out of your sales data!
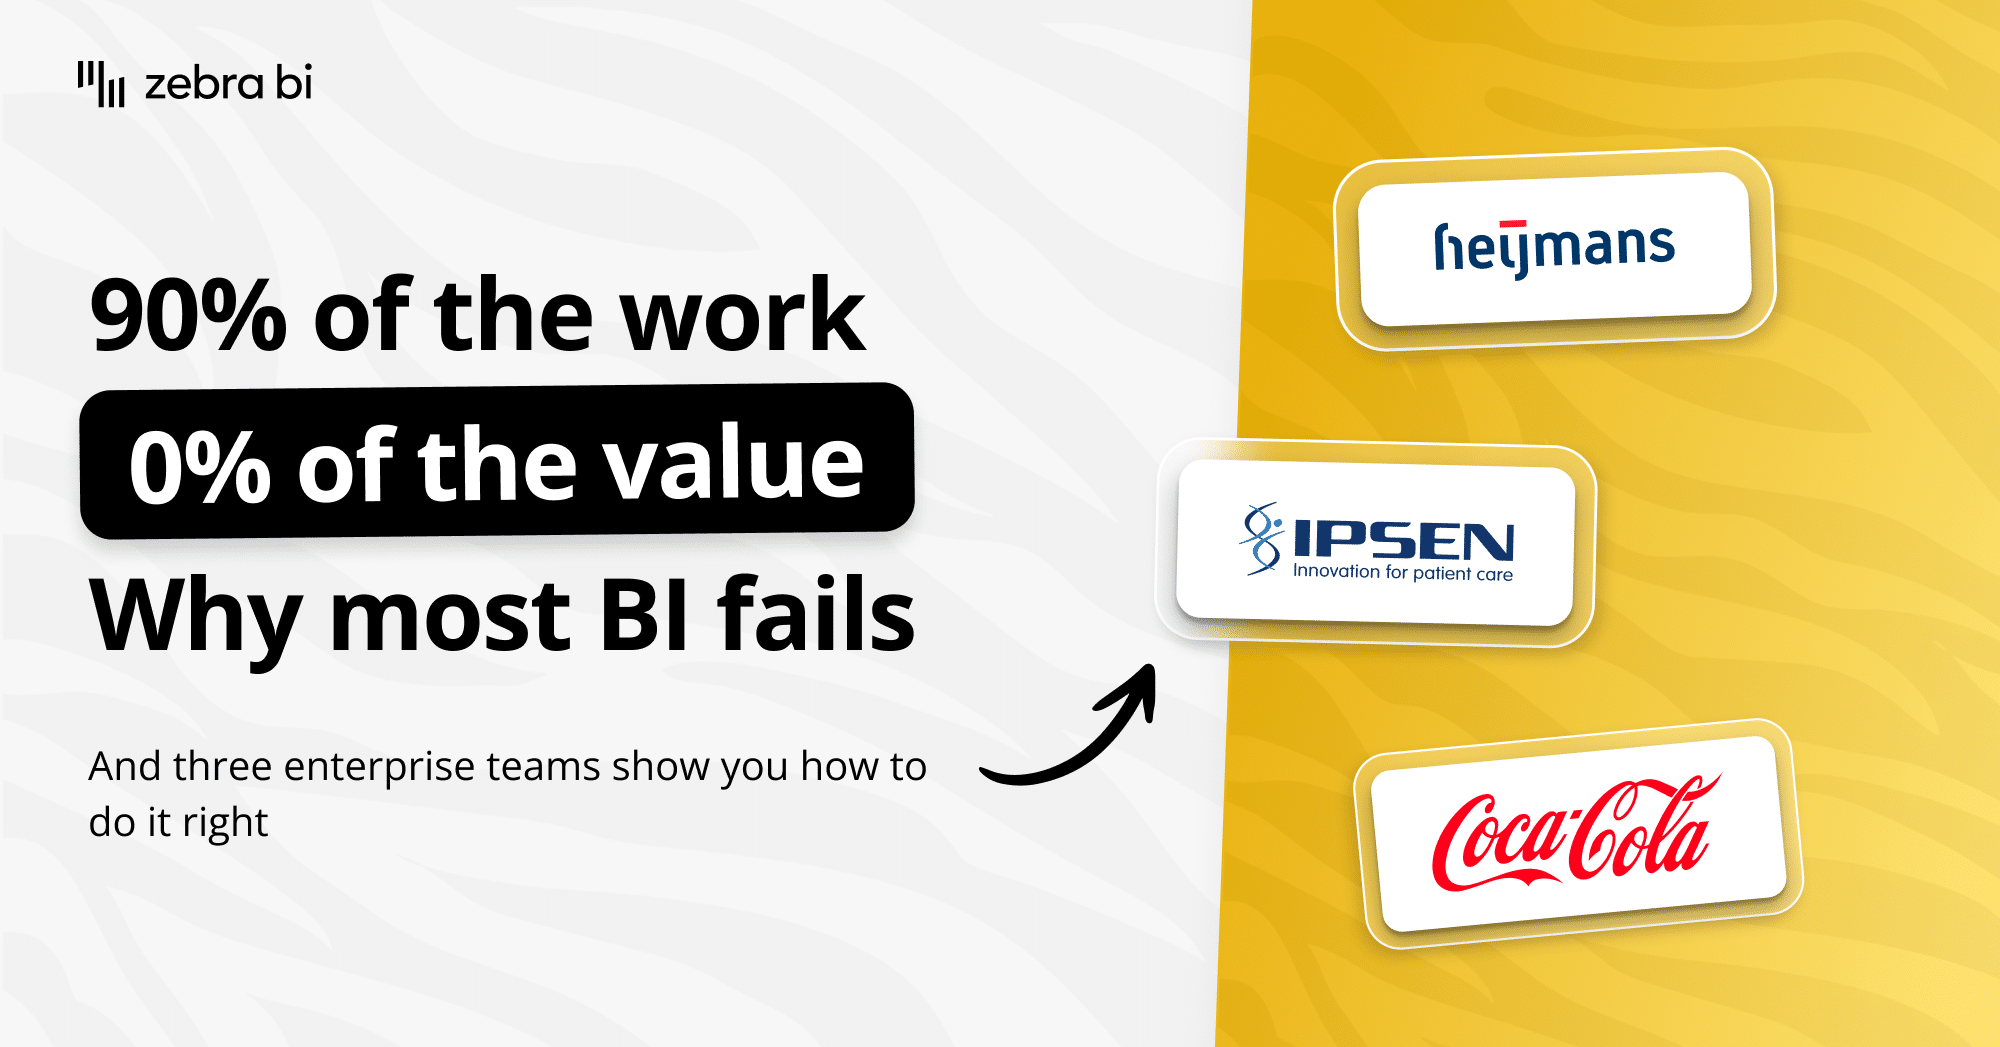
Eighty percent of BI investments fail to change a single decision. The gap between dashboard and decision has a name: the last mile of analytics. Inside: the four-question test from our Part 2 webinar, and two finance teams (Heijmans and Ipsen Pharma) who actually crossed it.
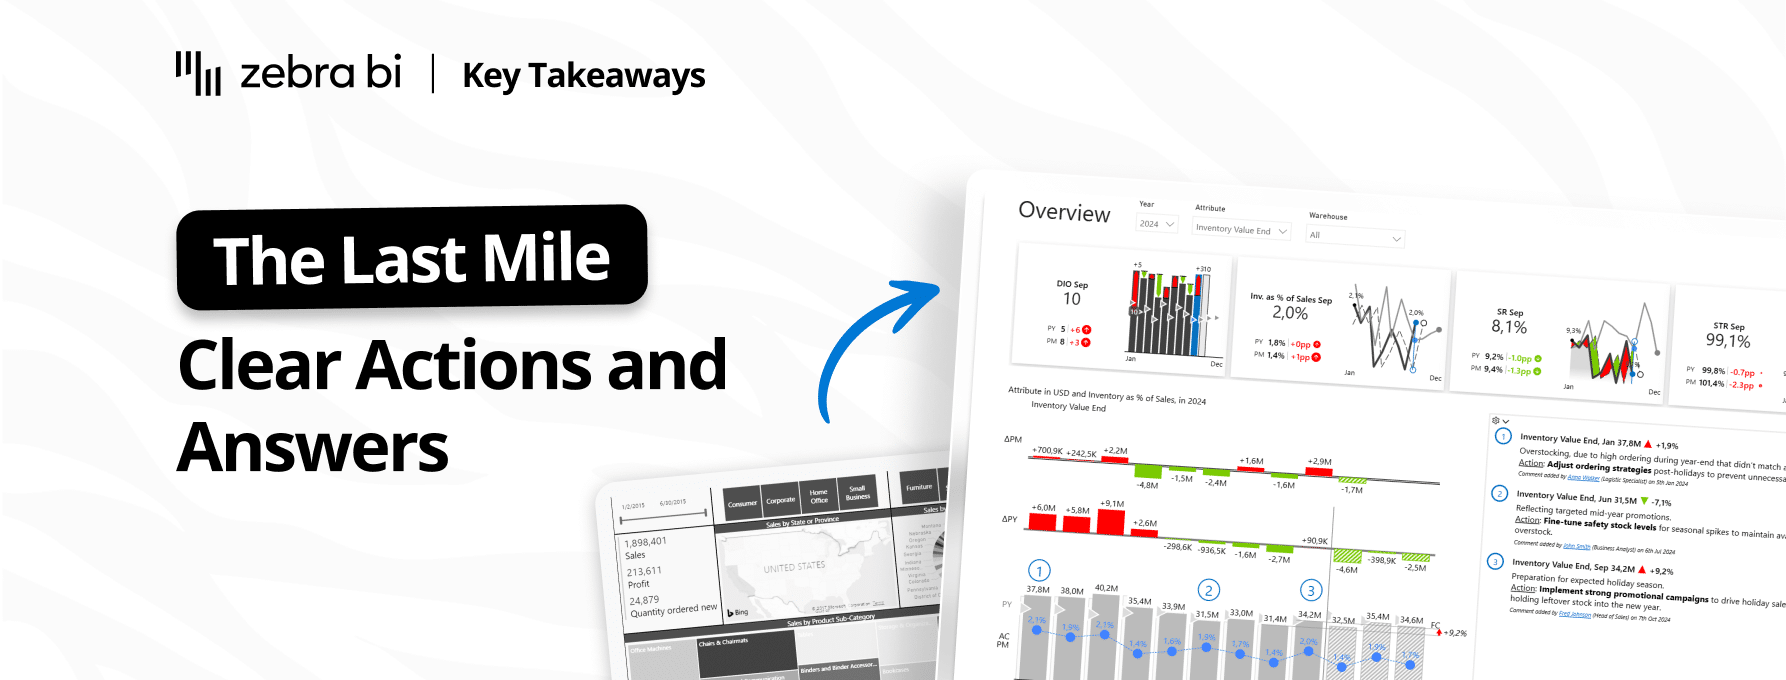
Your reports are ready. Decisions aren't. Learn how to close the Last Mile - live Power BI build, real client case, actionable framework. Free, 60 min.
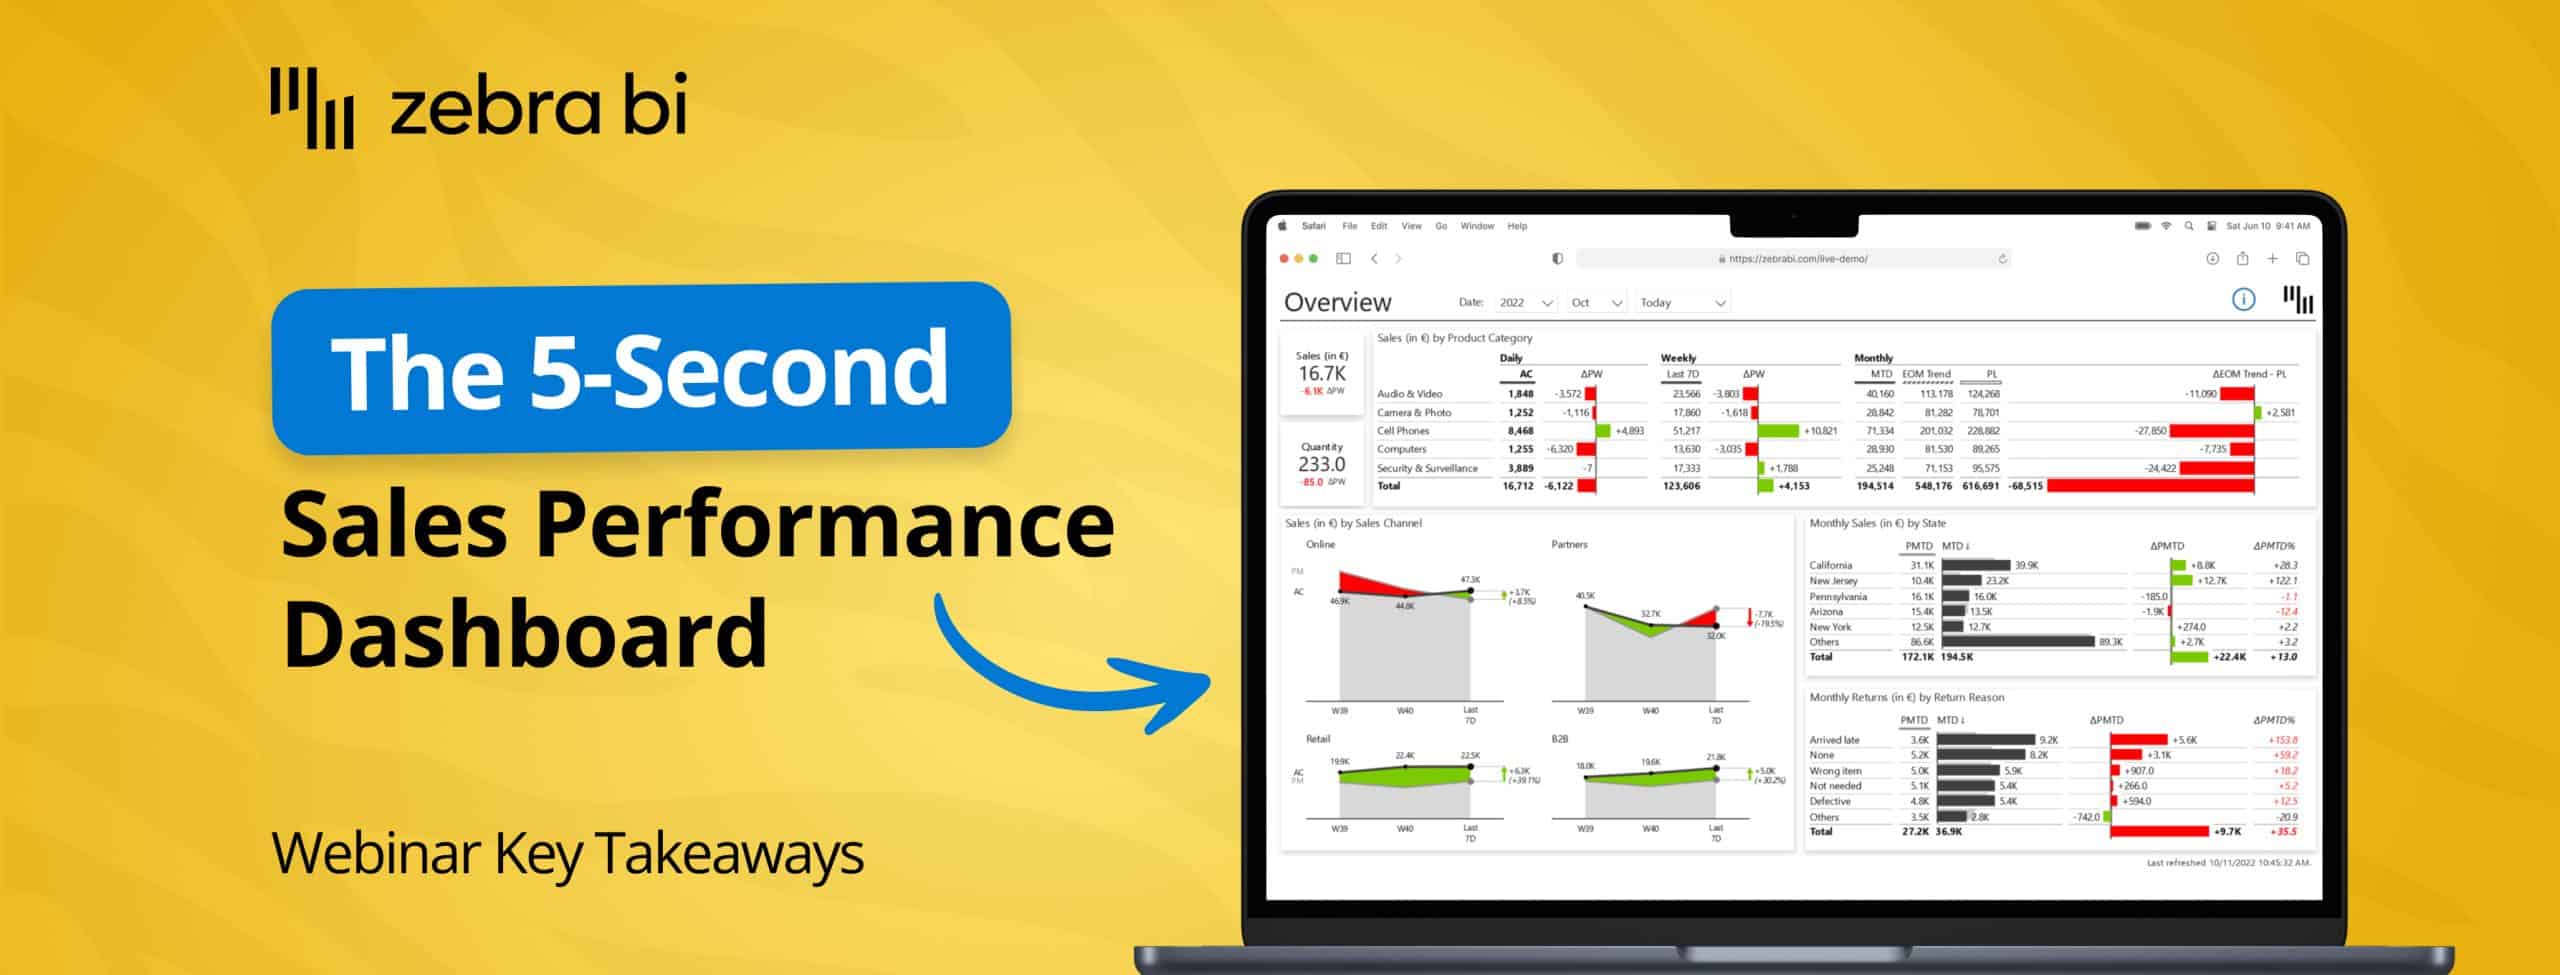
Want to learn how to turn your sales dashboard into a true power house of insights, using Power BI? There's an easy way and our Lead BI consultants explained it in this webinar.
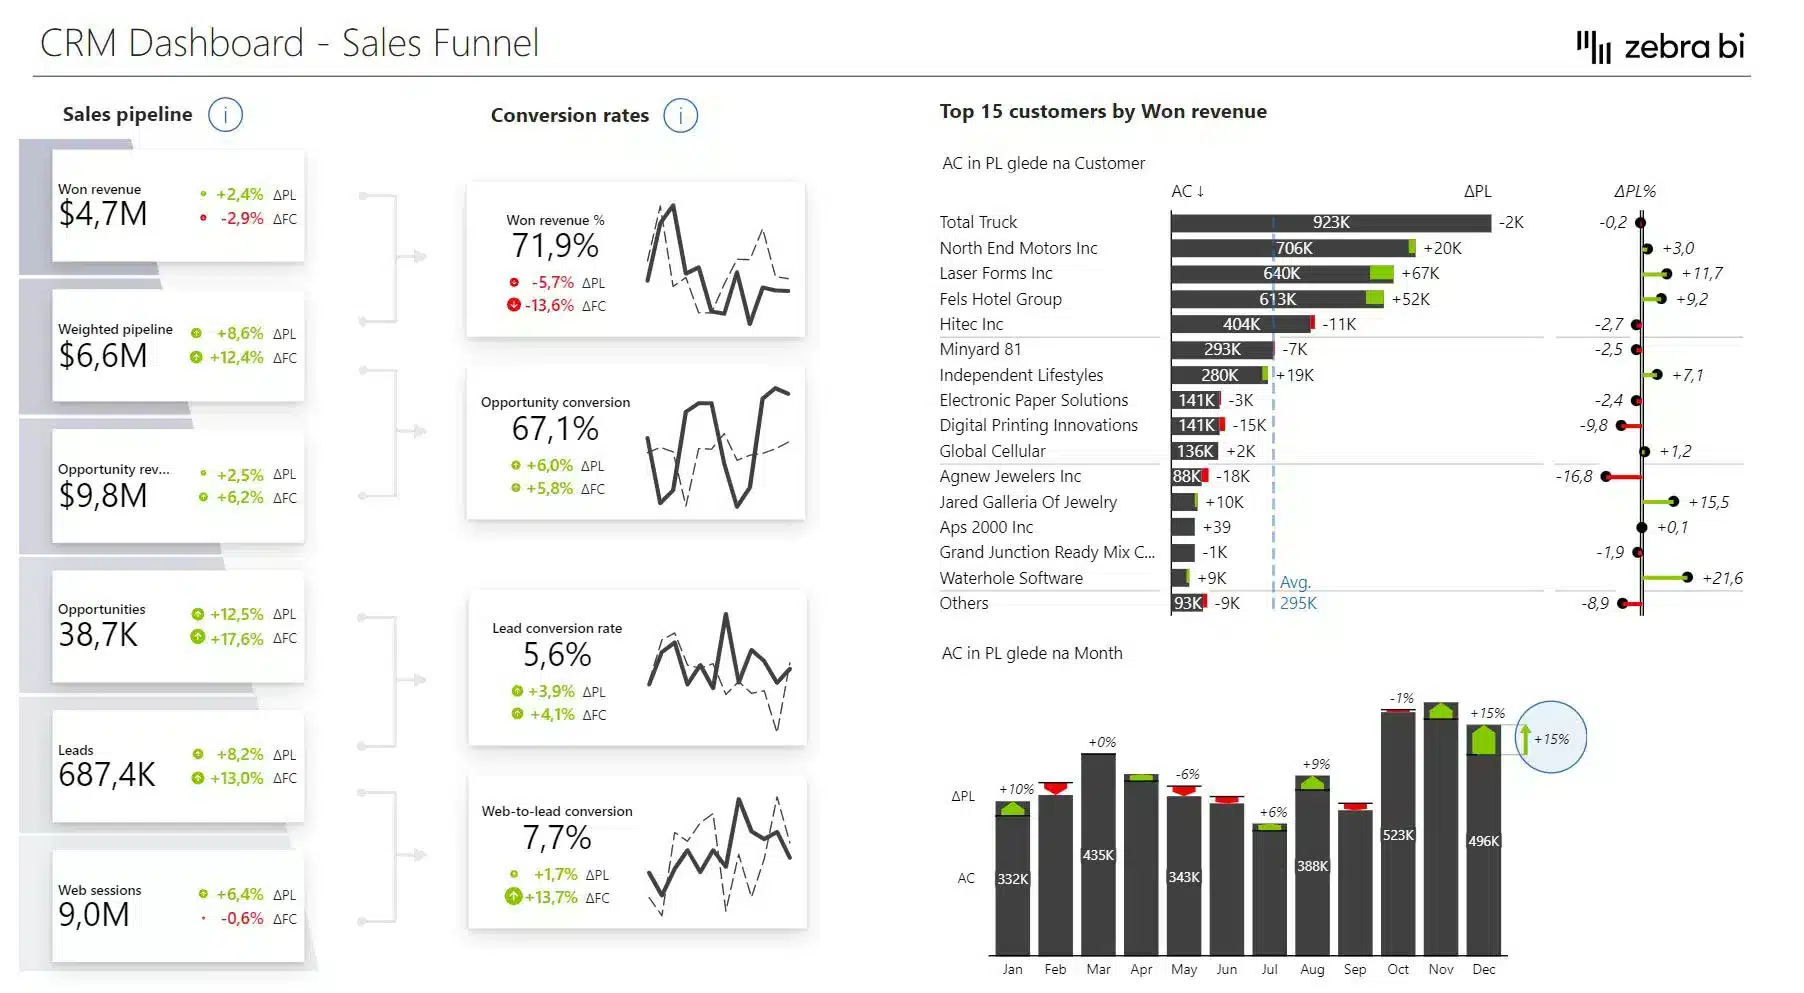
Discover how to build a sales dashboard that shows real results in context — spotlighting top performers, uncovering gaps, and driving action with clear, trusted data.
Ready to build the sales dashboard your VP of Sales actually opens on Monday?
Try Zebra BI directly on your sales data, no credit card required. See what the pipeline report looks like when sales leadership actually uses it. Or talk to our team and we'll show you what's possible for your specific setup.
 September 8th
 February 22nd