 September 8th
 February 22nd
Biovega earns the award for Best controlling project of 2016 in Croatia
The Best controlling project of 2016 in Croatia was carried out by Biovega, it was presented in the 4th International Controlling Conference in Croatia.
The overall quality of controlling projects improves every year, which leads to companies facing stiff competition in these events. This is what jury member Vinko Belak, Ph.D., professor at the Faculty of Economics, emphasized when announcing the winner:
I am very pleased with the high level of expertise present at this event. Year after year, the quality increases.
- Vinko Belak, Ph.D., jury member
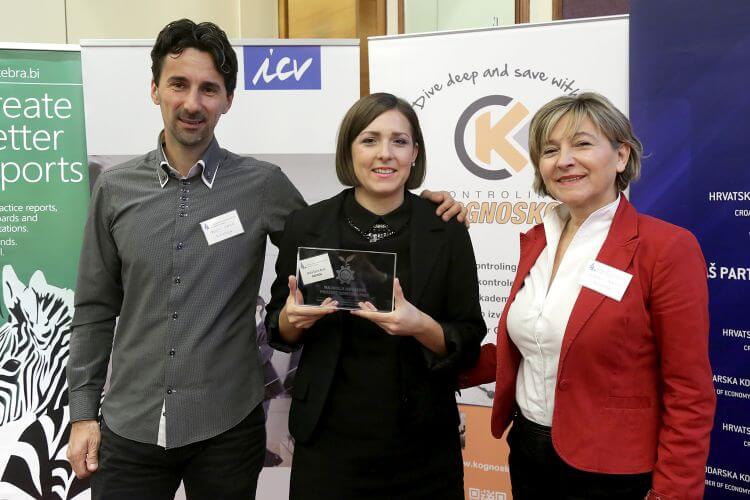
The project that earned Biovega this prestigous award is entitled "Controlling as the basis for development and better decisions". It was led by financial analyst Maša Šams Bival with help by Slavica Ribarić, head of finance and accounting, and procurement manager Damir Pavičić. The winning project was presented in detail on the conference.
They described the whole process of getting from the SQL database to the final Power BI dashboard in the cloud. The end result is a more efficient control of the inventory, easier monitoring of changes in purchase prices, as well as faster tracking of margins for all stores and suppliers.
Interview with Maša Šams Bival, project leader
Hi Maša, first of all, congratulations on achieving the award for the Best controlling project of 2016 in Croatia! Introducing such big changes in a company is never easy. What was the management's reaction to proposed changes in visualizations, reports, etc.?
Maša: Thank you. I must admit when it comes to big changes, they are not easy to implement. My colleague Damir (procurement manager) and I finished updates to our reporting at the same time, and our changes complement each other. With the newly updated reports, the management now has a basis for easier decision-making and can get detailed information of the whole system in just a few clicks. The new reporting system was very well received because the new quick insights into overall operations enable making fast decisions and taking necessary actions.
Such a project requires a lot of work. But this award gives you another confirmation that hard work pays off, right? What would you say are the biggest benefits of the new reporting structure and design?

Maša: You should love what you are doing, and know what you want as an output. When you invest a lot of effort into designing a new way of reporting, you feel the greatest pleasure when new reports are actually proven useful. Personally, this award serves as a confirmation in my company, and also in the professional community, that hard work is worth it.
The biggest benefit of the new reporting is that reports are visually simple and clear, all business units are included, messages are highlighted. It's now possible to monitor multiple periods and indicators (monthly, cumulative, ...) on one page. All data is scaled and displays the correct picture of the whole business.
In your presentation, you referred to one of your reports as a "star report". What is the content on the report? Why is it so important for your company?
Maša: The "star report" is a report that provides a comprehensive picture of retail operations. When we developed it, we used pivot tables and Zebra BI.
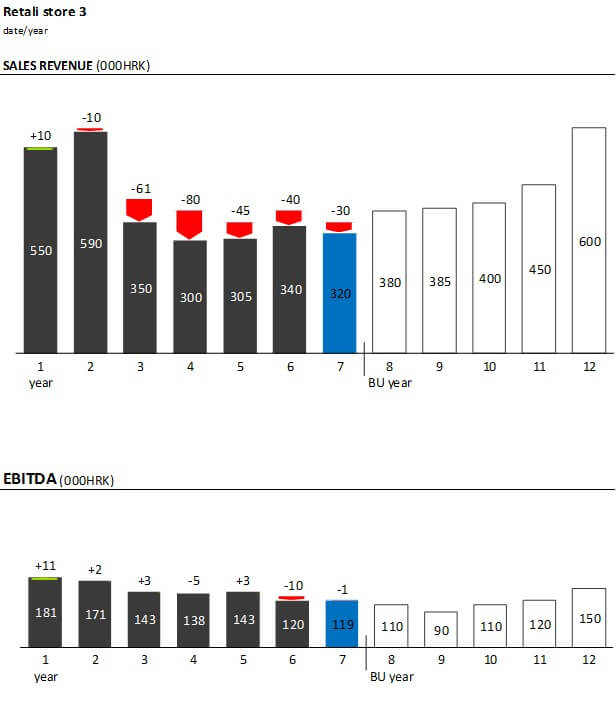
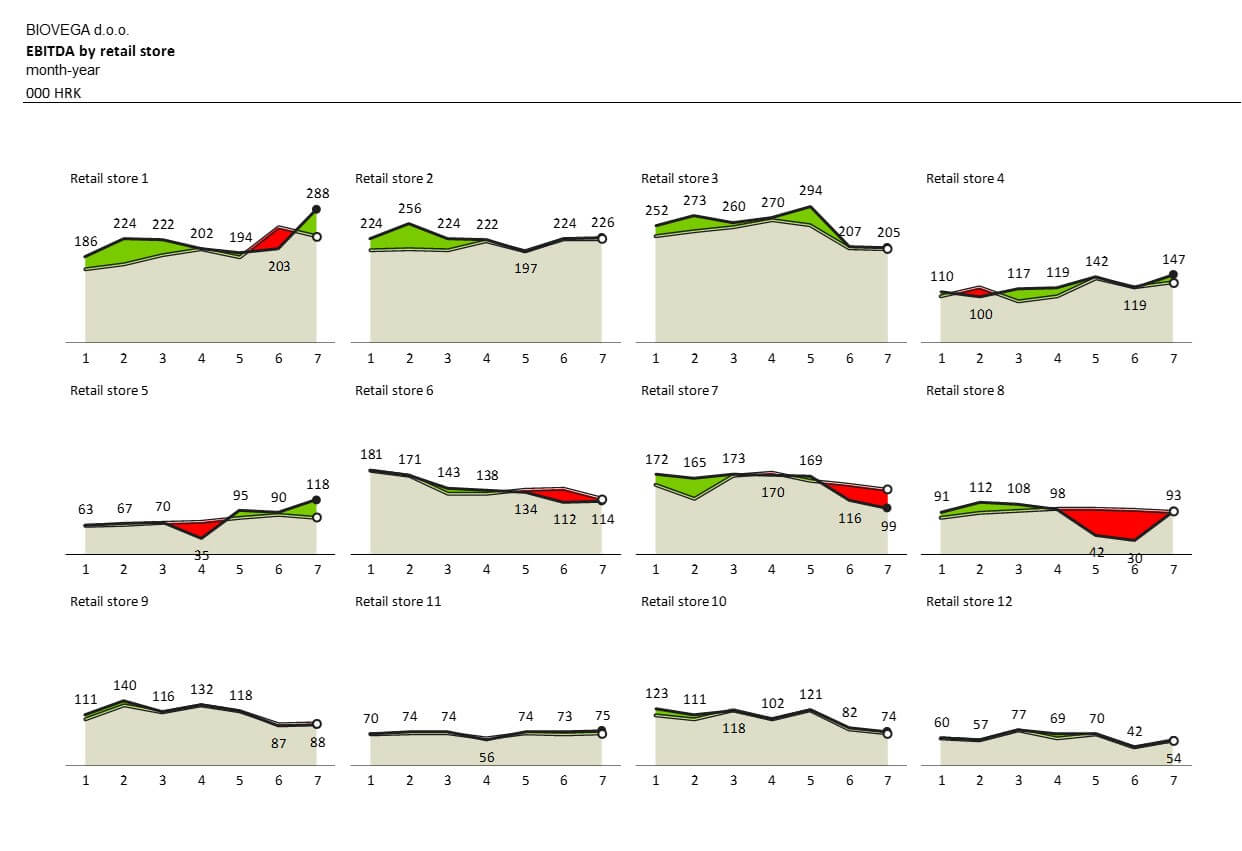
In the report, we follow the movement of the EBITDA of each retail cycle through the year. Variances to the plan are clearly outlined and clearly signal the change. This report is important because it is very easy to notice the variances.
For example, the "Retail store 8" has a high negative variance in May and June. This is a clear signal that we should make a more detailed report - either use ad-hoc reports using Zebra BI or analyze the source data deeper.
In addition to this kind of reporting we also created more detailed reports of product categories using Microsoft Power BI. These reports were created by my colleague Damir.
Biovega - Star report (note: data is anonymized)
What was your workflow like before this project? What improvements do you notice using Zebra BI?
Maša: Previous reports were filled with endless tables and basic Excel charts. We did not use pivot tables, so the data in the charts was often not correct. It was hard to compare the trends and especially variances (the variances were outlined with a variety of conditional formatting in tables - points, triangles, colors, …). The management had to devote a lot of time to analyze the reports and make decisions.
Zebra BI is really refreshing, adapted to the IBCS standards and provides incredible visual simplicity, accuracy, speed of reporting and consistency of reports. In addition, an important feature for us is the ability to add highlights to the charts.
Let's talk technicalities a bit. Have you managed to automate the process of monthly reporting? What technologies do you use to capture, manage, process, and finally visualize your data?
Maša: Yes, the first step is a new report in our ERP database. This data is then imported to Excel where it's modified a bit and then used to create pivot tables. From these pivot tables, Zebra BI charts are produced.
In our reports, we use 15 Zebra BI charts and also a complete dashboard made from Zebra BI charts.
When we refresh the database once a month, all pivot tables and Zebra BI charts are automatically updated.
Did you use any of our education materials (webinars, whitepaper, ...) to help you with your project? If so, which one helped you the most?
Maša: Of course, this project would be hard to do with no education. For implementation, you must know how to use tools and become familiar with all its capabilities. In the beginning, it's necessary to start with the workshops, and now I'm a frequent visitor of Zebra BI website. I don't miss any webinar. Everything that you provide is very useful!
If you had to use just one sentence, how would you describe Zebra BI?
Maša: With the power of Zebra BI everybody understands what I want to say with the report, I can perform my analysis a lot deeper and faster and the reliability and expertise is unquestioned.
More screenshots from Biovega
Here are three more examples from Biovega's award-winning project (note: data is anonymized):
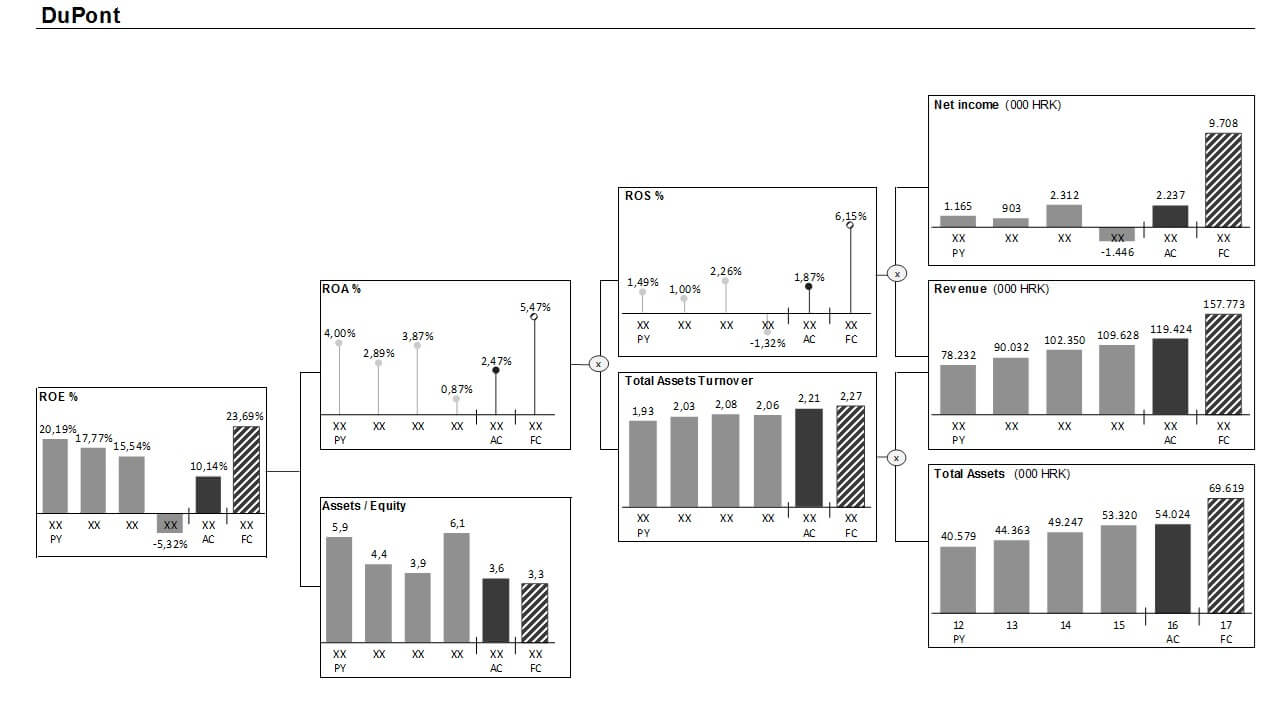
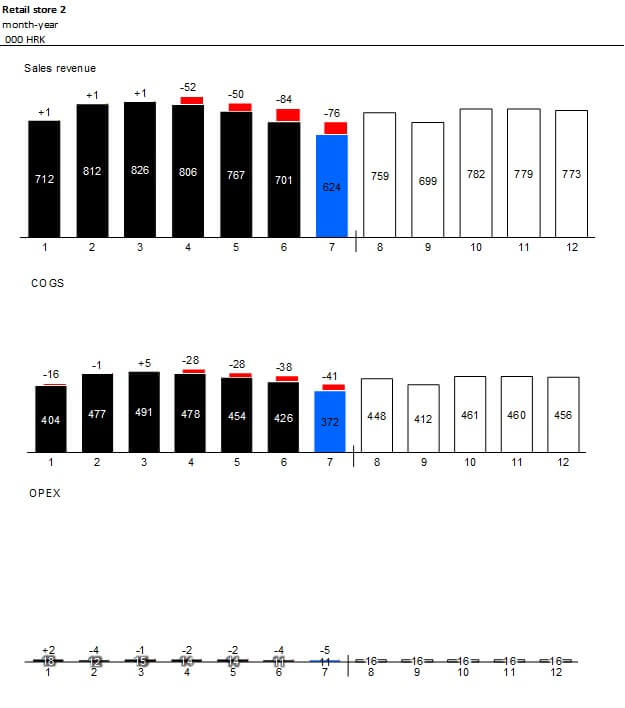
Takeaways from this case study
The immediate benefits that this project brings to the management of "bio&bio" stores are:
- Deeper analysis as a result of increased level of details available
- Improved packaging and merchandising and more economical investment in equipment
- Optimized display and presentation of products to better suit the needs and interests of customers
- Better cash flow because of improved inventory management and optimization of orders
The biggest takeaway we learn from this project is that by careful planning and designing of reports and dashboards we can drastically improve the control of operations on all levels - from the store level all the way down to the single product level.
About Biovega: Biovega is the leader in the Croatian organic products market, and currently employs 170 people. Company director and founder Zlatko Pejić and Jadranka Boban Pejić, started its operations in 1994, and began to distribute basic eco products shortly afterwards. The range of products increased with time and soon they created "bio&bio", a chain of retail stores selling organic products that currently operates in 17 locations in Croatia.
The 4th International Controlling Conference in Croatia was held on 8th of November 2016 at Westin Hotel in Zagreb, Croatia.
It was organized by consulting company Kontroling Kognosko and business newspaper Lider.