Want to learn how to turn your sales dashboard into a true power house of insights, using Power BI? There's an easy way and our Lead BI consultants explained it in this webinar.
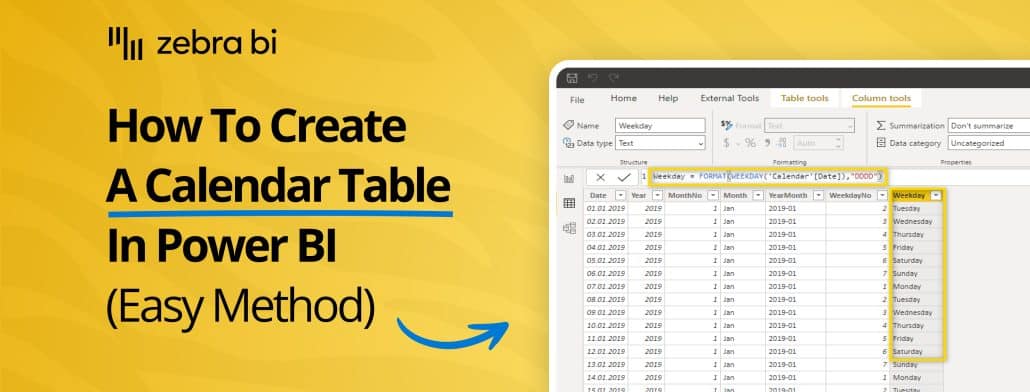
Time-based analysis is crucial for financial & business reporting, but native Power BI tools may not be enough. Here's how to create a Calendar table in Power BI (TWO easy methods)
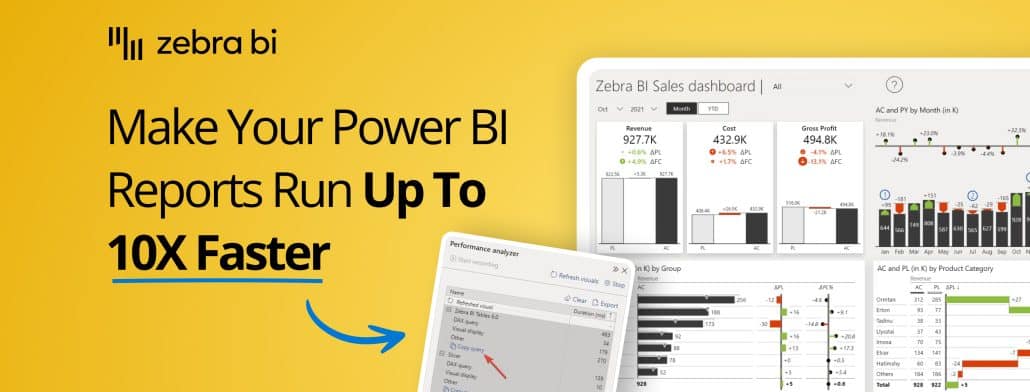
Advanced Power BI performance tuning doesn't have to be difficult. It can be far easier than you think if you have the right tools & tactics in your arsenal. Here's what you need to know.
Ready to take your Power BI waterfall charts to the next level, the easiest way there is? Follow our guide for better custom visuals done in less time and with less hassle.
Traditional reporting is broken. The good news? You can future-proof your financial reporting (easily). Here's a quick webinar overview on this specific topic, click to learn more about modernizing financial reports, from our Senior BI Consultant, Mark.
Not sure where to start with your Power BI sales dashboard or how to optimize it? Here is a comprehensive guide that will help you make the most out of your sales data!
 September 8th
 February 22nd
 23 Apr 2026