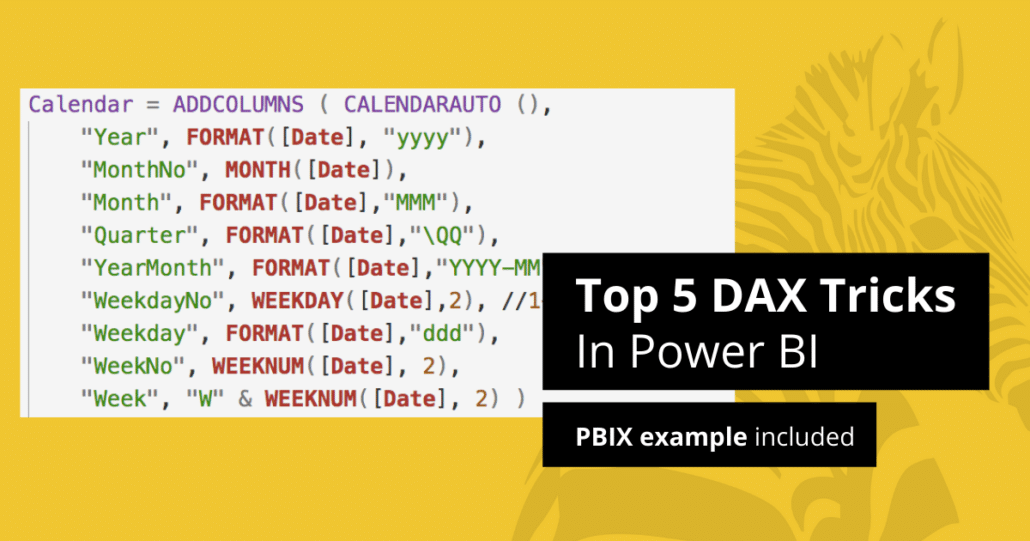
Category: Webinar

April 12, 2018
Mastering Variance Reports in Power BI
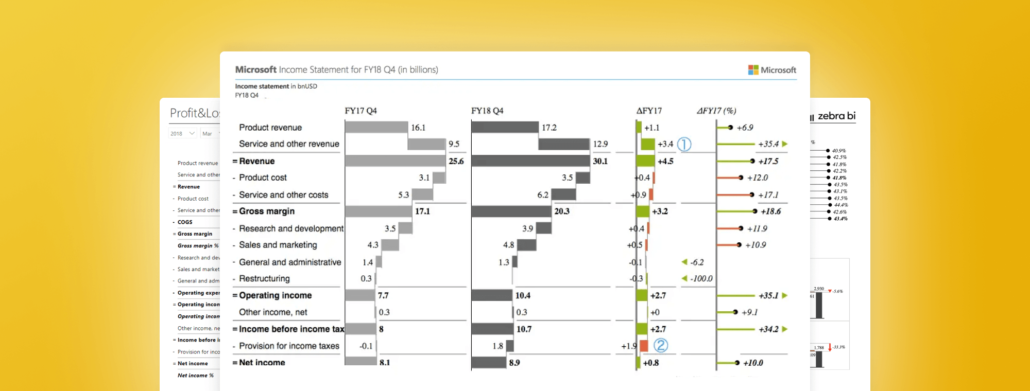
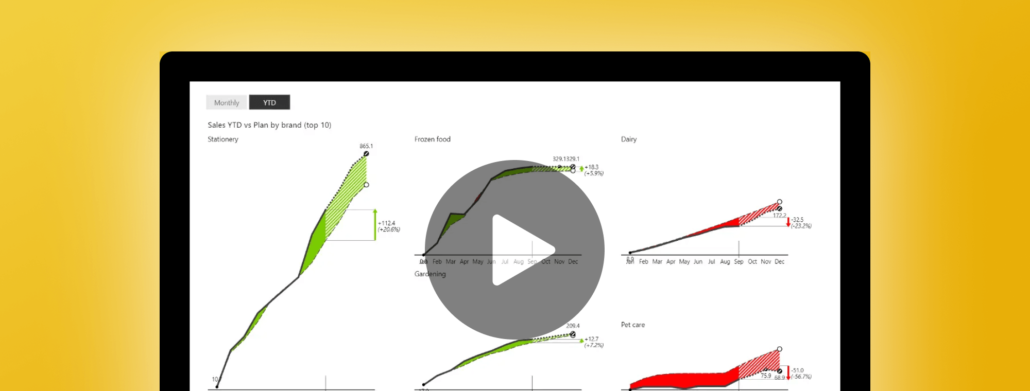
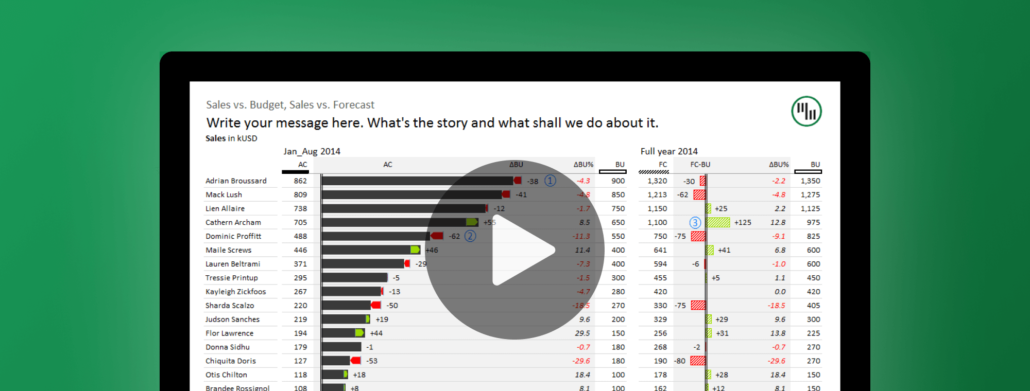
Presenting different variances clearly and in an understandable way is a crucial part of business reporting. Get to know the most effective methods for it in Power BI.
January 17, 2018
Building Spectacular Power BI Dashboards
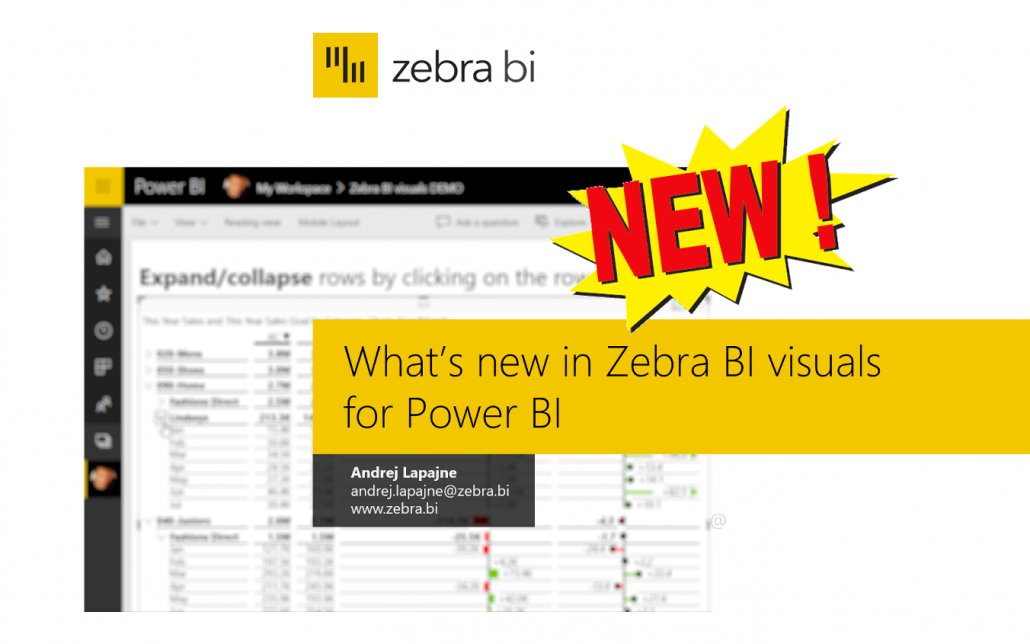
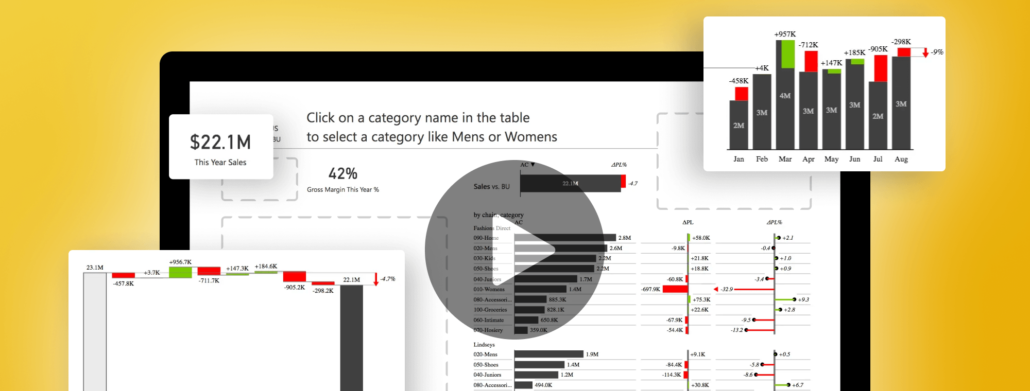
Learn a powerful method for building advanced Power BI dashboards which are compatible with different platforms, fully responsive and easily shareable.
September 14, 2017
3 Essential Excel Report Templates You’re Not Using
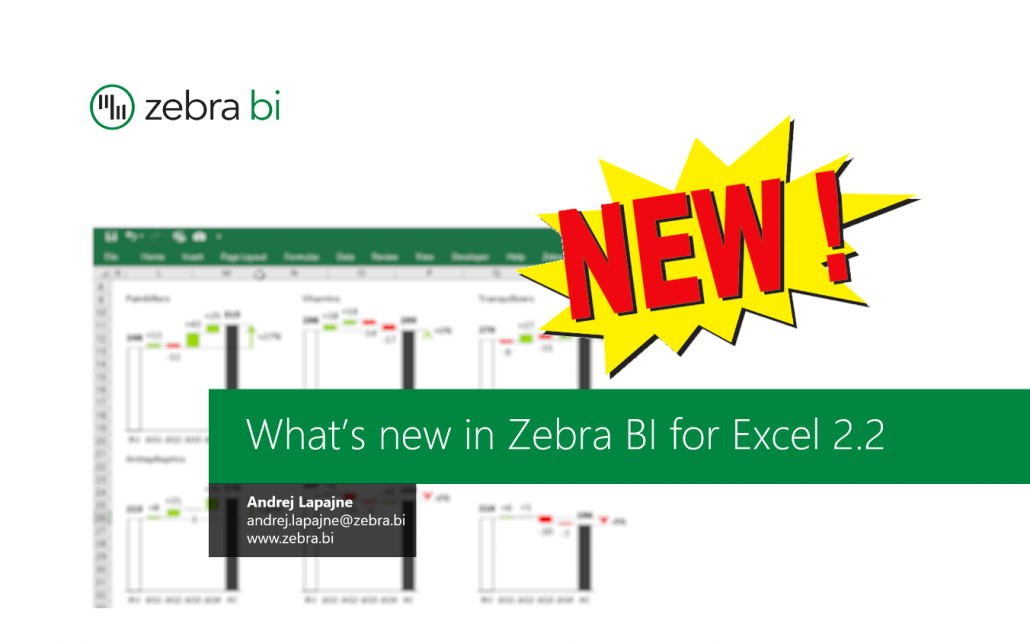
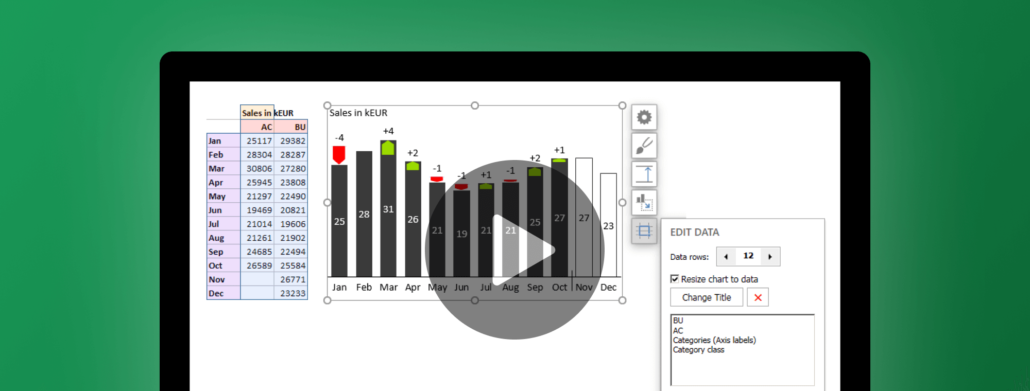
Discover the Excel report templates that will transform the way you design your most important financial reports inspired by Coca-Cola, Bayer and others.
June 6, 2017
Visual Storytelling with Zebra BI for Excel 2.1
After working hard on it for several months, Zebra BI 2.1 is finally released! Get to know the new features with several real-world use-case examples.
February 21, 2017
11 Ways of Tracking Monthly Variances in FP&A
There are many ways of displaying variances. We will explain to you how to use basic and advanced visualization methods for tracking monthly variances.
October 26, 2016
Practical Rules for Visualizing Budgets, Plans and Forecasts in Excel
The typical way to present budgets is with plain tables. Find out how to follow a much better approach by using some visualizations!
September 6, 2016
Improve your Excel reports with visual highlights
The ideal tool for bringing clarity to your reports and showcasing key information faster are visual highlights. Learn how this can be done easily with Zebra BI!
June 29, 2016
Automating Excel reports with PivotTables and slicers
MS Excel offers PivotTables, slicers and other functions that let you automate your reports and dashboards in an extremely efficient way. Learn how!
June 15, 2016
Creating updatable PowerPoint presentations
Learn how to export your tables, charts or even whole reports from Excel to PowerPoint and make them update automatically.