September 8th
 February 22nd
 26 Feb 2026
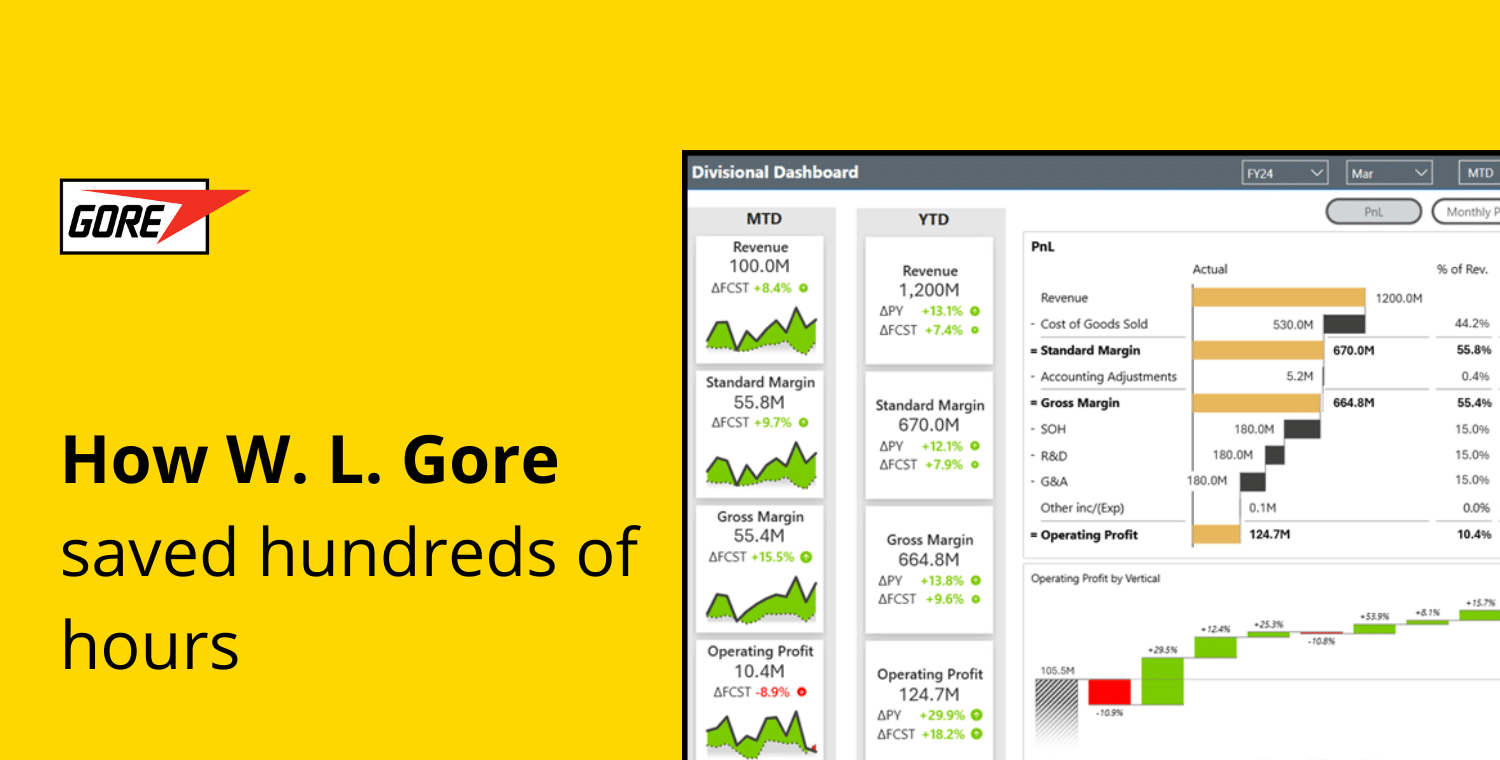
In Abbott's Operations department, senior financial analyst Ivana Meier led a quiet revolution by turning static Excel reports into interactive, leadership-ready dashboards in Power BI using Zebra BI.
What began as a spontaneous YouTube discovery quickly turned into a reporting transformation with clearer visuals, reduced manual effort, faster decision-making, and stronger cross-functional communication. Her gradual, user-centric approach not only improved reporting quality but also saved valuable time across the finance and operations departments.
Abbott Product Operations AG is a division of the global healthcare leader Abbott. Today, with 115,000 employees, their mission is to make a lasting impact on health in more than 160 countries where they operate.
Within its Operations department, financial oversight and cost control are essential to ensuring efficiency and strategic alignment across global units. With a distributed structure and diverse reporting needs, the team depends on clear, standardized insights to drive decisions.
When Ivana joined Abbott seven years ago, Power BI was still emerging. Reports were often limited to basic visuals copied into PowerPoint and Excel, which remained the go-to tools for reporting.
Such reports lacked interactivity, used outdated external tools, required extensive manual formatting, and offered little in the way of actionable insight. Preparing presentations for senior leadership became a manual and time-consuming process, with multiple revision rounds focused more on layout than content.
At a company like Abbott, this was not a sustainable solution for anyone.
While searching for a DAX formula online, Ivana stumbled across a video featuring Zebra BI. Intrigued by the interactivity and clarity of the visuals, she activated a free trial and quickly built a proof-of-concept report to demonstrate the tool’s capabilities to her manager. The response? “They liked it, and we were on board.”
Since then, Ivana has become a driving force behind Zebra BI’s adoption by sharing dashboards with colleagues, promoting the tool to senior leadership, and even engaging with headquarters to explore broader licensing options.
Once I showed my manager what Zebra BI could do, we were on board. It wasn’t just better visuals, it was a smarter way to communicate data.
To ensure smooth adoption, Ivana started with a well-thought-out change process. Rather than overwhelm users with a complete change, she slowly started to introduce new visuals starting from the most familiar ones: tables and cards. Then she continued by adding new features incrementally every month.
Having to change the way you’re used to seeing data and creating reports can be overwhelming for stakeholders with different levels of knowledge. Ivana’s approach proved successful by enabling users to build confidence with the tool gradually while keeping reports consistent and professional. It was a win-win situation for everybody.
What Ivana achieved with a gradual rollout process:
I didn’t want to scare them off. I just kept adding one new element at a time until we got where we wanted to be.
Since adopting Zebra BI, Ivana and her team have experienced tangible improvements in how they collect, analyze, and present financial data. The results go beyond visuals as Abbott’s operations finance function now works faster, communicates more clearly, and drives decisions with greater confidence.
Ivana used Zebra BI to build a new operational cost report covering projects, travel, and salaries across regions. The underlying Excel data didn’t change, but Zebra BI dramatically improved how that data was collected, visualized, and consumed. With Zebra BI, she managed to:
To get everyone on board and ensure proper understanding, Ivana even organized a team training to expand adoption and track performance impact.
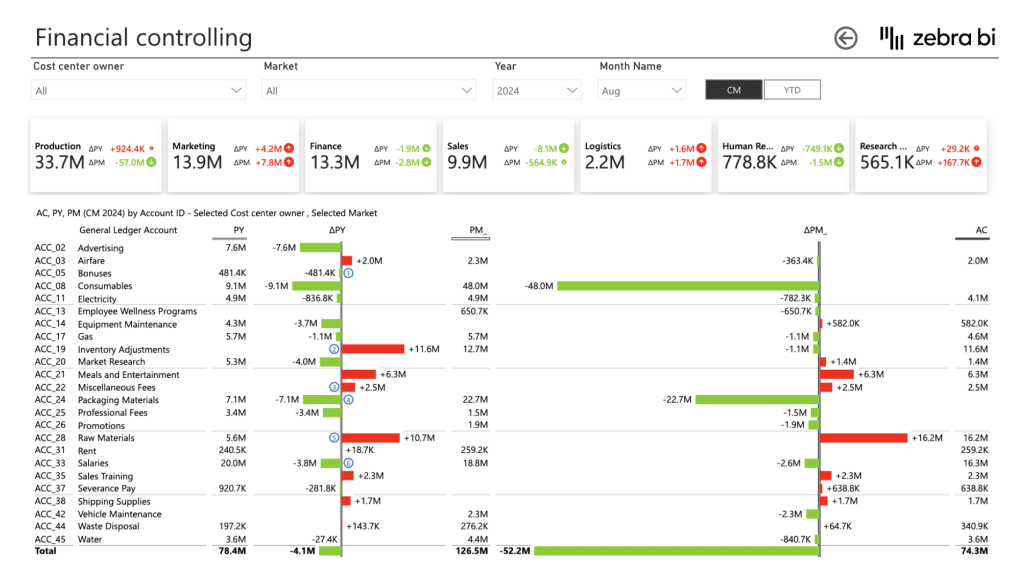
Disclaimer: The image is just an example of Cost Management in Power BI using Zebra BI. You can download the dashboard example here.
When she presented it to leadership teams, the feedback was overwhelmingly positive. Managers could now compare plans vs. actuals at a glance and adjust the planned budgets accordingly. The dashboard has already helped streamline analytics and enhance visibility across operational expenses.
With Zebra BI, I don’t have to wonder if the presentation style is right. I already know it is. That alone saves days of formatting and feedback loops.
Ivana and her team no longer need to reformat reports for each stakeholder. Zebra BI’s intuitive, standardized visuals ensure leadership receives only the most relevant takeaways.
With Zebra BI, they have:
You only need 2–3 sentences to make a decision. Zebra BI makes sure those are the right ones.
The team is now transforming raw data into structured stories, which are significantly more self-explanatory than they were before. For leadership, the reports now focus on the essentials: identifying red flags and acting fast.

Disclaimer: The image is just an example of Cost Management in Power BI using Zebra BI. You can download the dashboard example here.
Different teams and business units previously resorted to several third-party tools for visualizing and formatting data. Zebra BI’s advanced capabilities now cover those needs which lead to enterprise-wide cost savings and simplification.
Abbott’s transition from Excel-based reports to interactive dashboards in Power BI demonstrates the value of smart reporting powered by intuitive visuals, interactive analysis, and strategic leadership alignment. Ivana’s journey proves that enterprise BI transformation doesn’t need to start with a top-down initiative, and it doesn’t have to be an overwhelming process of change. Sometimes, all it takes is one analyst, one trial, one new feature at a time, and the right tool.
For Ivana’s team and Abbott, Zebra B is proving to be more than a visualization tool. It’s a bridge between insights and action.
I used to spend days getting reports and presentations ready. Now, with Zebra BI, the visuals do the work, and we focus on what matters.
Ready to turn reporting efficiency into real business impact?