September 8th
 February 22nd
 05 Mar 2026
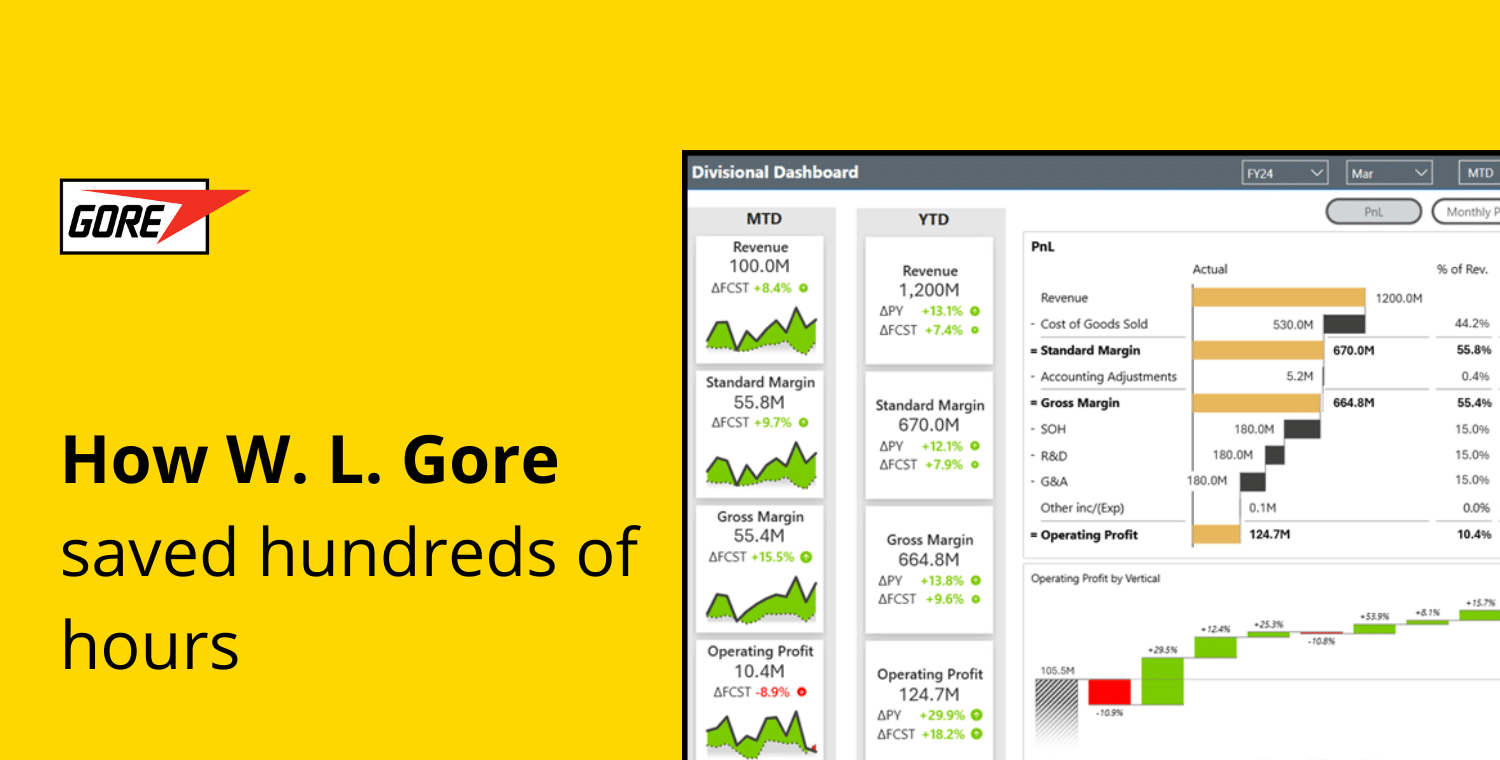
 Helvetia, a leading Swiss insurance group, significantly improved the speed, consistency, and effectiveness of its internal financial reporting by adopting Zebra BI for Power BI. By standardizing dashboards and adopting IBCS-compliant financial data visualization best practices, the controlling team reduced reporting time by 2–4 hours per team member per month.
From high-level management to department heads, Zebra BI reports now support clear, consistent decision-making across the organization. Ease of use, visual clarity, and a strong alignment with financial reporting needs made Zebra BI a lasting part of Helvetia’s analytics stack.
Helvetia Insurance Group is one of Switzerland’s oldest and most respected insurance providers, employing over 14,000 FTE across Europe, with a strong presence in the Swiss, German, Austrian, Spanish, French, and Italian markets. The company offers a comprehensive range of insurance products, from life and non-life insurance to pensions and investment solutions.
Within Helvetia, the Swiss controlling department is responsible for ensuring timely, accurate, and actionable financial insights for the Swiss market unit. The department’s performance management team develops and maintains reporting solutions that enable key stakeholders, including the C-suite, finance managers, and cost center owners, to access the data they need securely and efficiently.
Before the adoption of Power BI and Zebra BI, Helvetia’s internal reporting environment was fragmented, manual, and inconsistent. Reports were largely created in Excel and then converted to PowerPoint or PDF formats. This workflow not only consumed valuable time but also lacked standardization across departments, making it difficult to compare reports or scale up the reporting process.
It was mostly heterogenic, Excel to PowerPoint or PDF. Not systematic, not uniform. One of our main goals was to centralize and unify the reporting approach.
This lack of consistency meant that each report developer had to make design and structural decisions from scratch. There was no unified logic for displaying charts, financial tables, or KPIs, which led to inefficiencies and confusion for end users.
As Helvetia began to scale its reporting systems, it became clear that a centralized and professional BI toolset was needed. One that would support financial reporting best practices and streamline development without sacrificing quality.
The transformation began when Helvetia’s controlling team decided to modernize its reporting framework using Power BI. As part of this shift, the team searched for tools that would help them follow best practices in visual financial reporting, particularly the IBCS (International Business Communication Standards).
Very early in the Power BI journey, a developer on the team discovered Zebra BI. It was an immediate fit for their needs.
We were looking for a way to visualize financial data correctly. Zebra BI was the closest to best practice: tables and simple, effective charts but not too fancy. It made reports easier to understand and navigate
Stephanie Husser, who joined the controlling team later, emphasized that even as a relatively new user, Zebra BI was intuitive and allowed her to quickly create impactful reports. She independently developed a full report using Zebra BI visuals, something that would have taken much longer with other tools.
At the beginning, some scenarios were a little tricky. But now, everything runs smoothly. I could clearly see how much time I was saving by using the same charts and layouts.
The team worked closely with Zebra BI to address early challenges, such as handling direct hierarchies and enabling waterfall charts. With these improvements now in place, Zebra BI has become deeply embedded in Helvetia’s reporting processes.
The adoption of Zebra BI led to wide-ranging benefits across Helvetia’s financial reporting processes:
By eliminating manual chart creation and formatting tasks, Zebra BI drastically reduced the time needed to build reports. Thanks to live data feeds and refresh functionality, reporting is now nearly instantaneous.
Now it’s instant: there’s no time required for building reports anymore. Everything updates automatically, so users just open the dashboard and it's there.

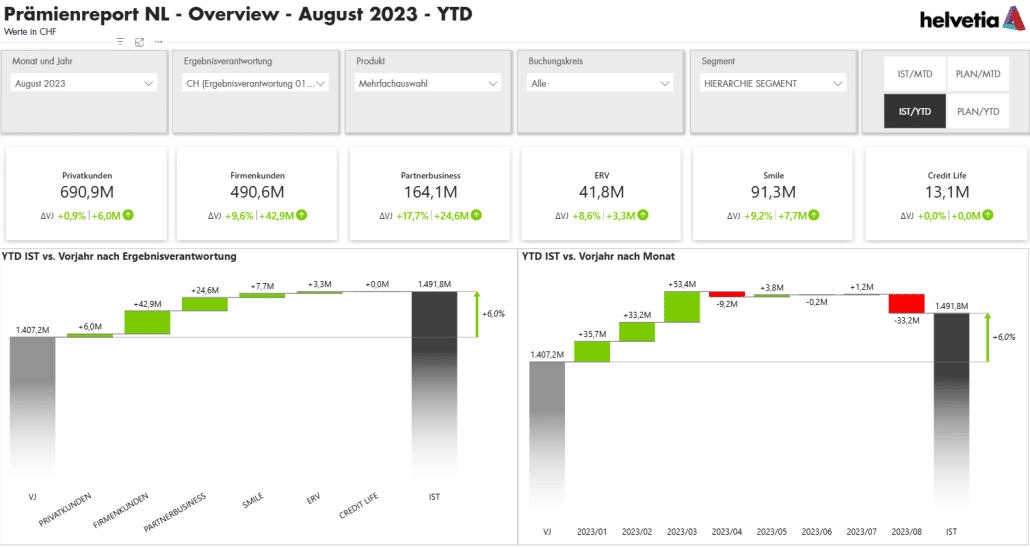
Disclaimer: The data on the image is fictional and intended solely to demonstrate the layout and structure of the dashboard.
Zebra BI’s seamless integration with Power BI’s row-level security has enabled Helvetia to roll out the same reports to hundreds of users across departments, without sacrificing data confidentiality. Each user only sees the data they’re authorized to view.
For example, cost center owners see only the cost centers they manage, while finance leaders and C-level executives receive full overviews in a broader financial context. This structure enables the controlling team to maintain a single version of the truth while dynamically customizing access.
The idea is that each cost center owner can only see the data relevant to them, while our leadership sees the full picture, all from the same report structure. That’s powerful.
A standout benefit of Zebra BI for Helvetia has been the out-of-the-box consistency and standardization it brings to all dashboards without any additional configuration or manual formatting. Zebra BI visuals are IBCS-compliant by default, meaning reports follow a clear, professional visual language from the start. This built-in structure supports Helvetia’s commitment to financial reporting best practices and ensures that dashboards are immediately intuitive even for occasional or non-technical users.
Because every report shares the same underlying visual logic, once someone learns how to interpret one, they can easily understand others without extra onboarding. For executives and managers, this leads to faster comprehension, less confusion over KPIs or layouts, and more time spent discussing key business drivers. This consistent user experience has accelerated adoption across teams and increased trust in the data being presented.
Users know their way around fast. If you've seen one Zebra BI report, you can navigate the rest, whether you're a controller or in the C-suite. That makes our insights much more accessible.
Disclaimer: The data on the image is fictional and intended solely to demonstrate the layout and structure of the dashboard.
Zebra BI is no longer limited to financial reports. The team uses it for a wide range of applications, including:
This versatility means the team can build standardized templates and apply them to various domains.

Disclaimer: The data on the image is fictional and intended solely to demonstrate the layout and structure of the dashboard.
By freeing up time and simplifying the reporting logic, Zebra BI allows the controlling team and stakeholders to spend more time discussing drivers of change and strategic actions, instead of interpreting raw numbers.
Helvetia’s journey illustrates how structured, scalable reporting built on Power BI and Zebra BI can bring significant value for large enterprises. By simplifying reporting workflows, enforcing visual best practices, and ensuring consistent experiences for users at all levels, Zebra BI helped Helvetia turn financial data into an actionable strategic asset.
For other finance and performance teams considering a transformation: adopting a consistent, IBCS-compliant visual language like Zebra BI can
Ease of use, ease of understanding, and the ability to work efficiently, that’s what matters when you do a lot of reporting. Zebra BI gives us exactly that.
Turn every report into a decision engine like Helvetia