September 8th
 February 22nd
You managed to get your data ready, but your colleagues still don’t know how to build effective reports. Or perhaps they are so used to looking at their old "table reports" that it is difficult to get them to change. Do any of these sound familiar? The good news is you’re not alone.
Mario Mühllechner, Team Lead Business Intelligence at Liebherr Earthmoving, shared how he and his team used the International Business Communication Standards (IBCS) and Zebra BI to achieve consistency in reporting and got everyone excited about them.
Liebherr was founded in 1949 by Hans Liebherr in Germany. Today, the company is present in over 13 different product segments (from refrigerators to mining machinery).
With its headquarters in Switzerland, it employs roughly 50,000 people globally and has a turnover of around 11,600 million €.
Liebherr Earthmoving was established in 2019 as the BI Competence Center. It has 7 full-time employees and 3 interns that support BI solutions for more than 8,000 employees in the division. Over 140 Power BI reports have been created and 100+ employees have been trained in Power BI in the past 3 years.
When someone mentions standardization, people typically think about its negative aspects. We tend to associate it with uniformity, lack of creativity, and the same look and feel for everything anybody does.
The problem that the Liebherr team had was that in the company with more than 50,000 employees, everyone was doing the reports however they saw fit. In practice, this means that everyone can use different layouts, shapes, visualizations, data, and colors for the same report. Report viewers then have to spend too much time trying to even understand the report. Knowing what should next steps be is even further away.
The reporting team at Liebherr Earthmoving knew that in order to make the reports useful and help the decision-makers make the right choices, they need to implement reporting consistency. This way, all the right insights are immediately seen as all reports follow the same structure and the colors and visualizations used have the same meaning.
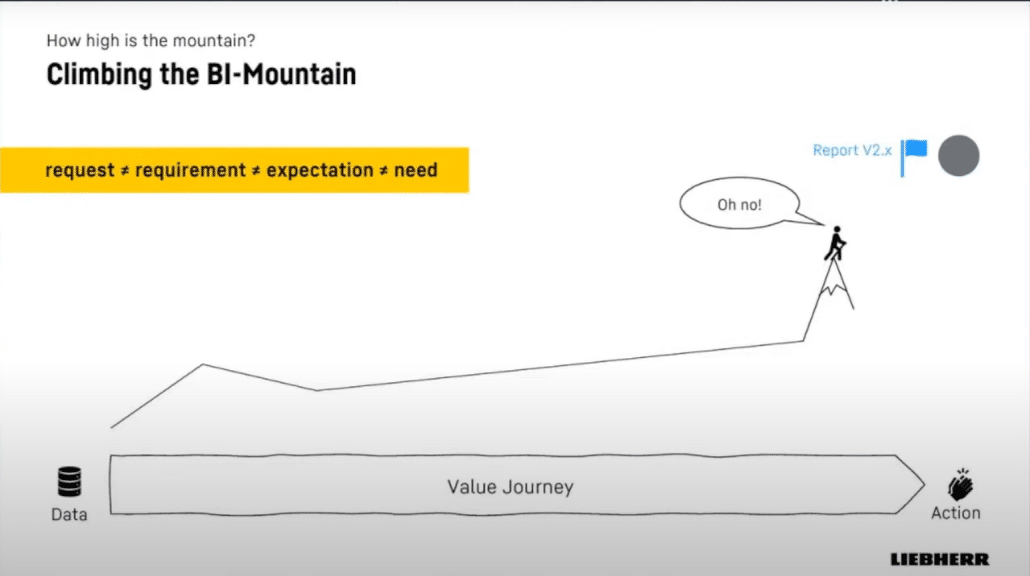
Mario explains this with the concept of the ''value journey''. Today, most companies collect data and use tools to visualize it. But the true changes happen at the last mile of the process. This refers to data analysis, insight communication, and taking action. Therefore, most companies are still missing the critical steps to turn their data into action.
Why is that? The answer lies in the difference between the actual need and what users request.
If a person is developing reports for himself, there is no problem. With the self-service scenario, there are no feedback loops, exact requirements are known, and the result always meets expectations as the consumer is also a developer.
But as soon as the solution/report needs to also serve another user the report creators start on a journey that Mario calls the BI mountain… You don't know how high & far the next peak is until you climb the one before you. Only in hindsight, you see the journey and the steps required clearly. It means creating and sharing reports.
In the beginning, the task is easy: you need to create a report, and everything is clear. But soon you discover that the first version is not what was expected. This is due to a difference between the user's request and the actual requirement or need behind it. It's like hiking a mountain: you don't know how high or far it is.
When implementing reporting consistency at Liebherr the team used two assets. Referring to climbing the mountain, Mario calls them the ''Standards backpack'' and the ''Best-practice shoes''.
What does that mean in practice?
Step 1: You need to be informed, have the right equipment, and also use existing best-practice solutions.
"For example, Zebra BI provides many templates. Additionally, in some organizations, there are some best practice reports that you can use, copy, and adjust to your needs."
Step 2: Use conformed data if you have a data warehouse team.
Step 3: Create prototypes and MVPs to get fast feedback.
Step 4: Know your goal. When climbing the mountain the actual goal is to come home. In business reporting this means taking action based on data & insights.
''Standardization accelerates the value journey. It’s not the goal, it's just a way to accelerate the journey.''
The harsh reality that the Liebherr team was faced with is that this path is not linear. In big companies, there are a lot of employees and every role has different requirements when it comes to using reports, changing data, etc. Communication between different teams is very difficult and the task can seem like a big puzzle to assemble. In this scenario even the best BI tools are useless.
To overcome this challenge and get all the pieces together, communication feedback is essential.
''The best tool is useless if you don’t have good communication within your company.''
Mario shared some key aspects and methods that proved successful for Liebherr when implementing reporting consistency in Power BI.
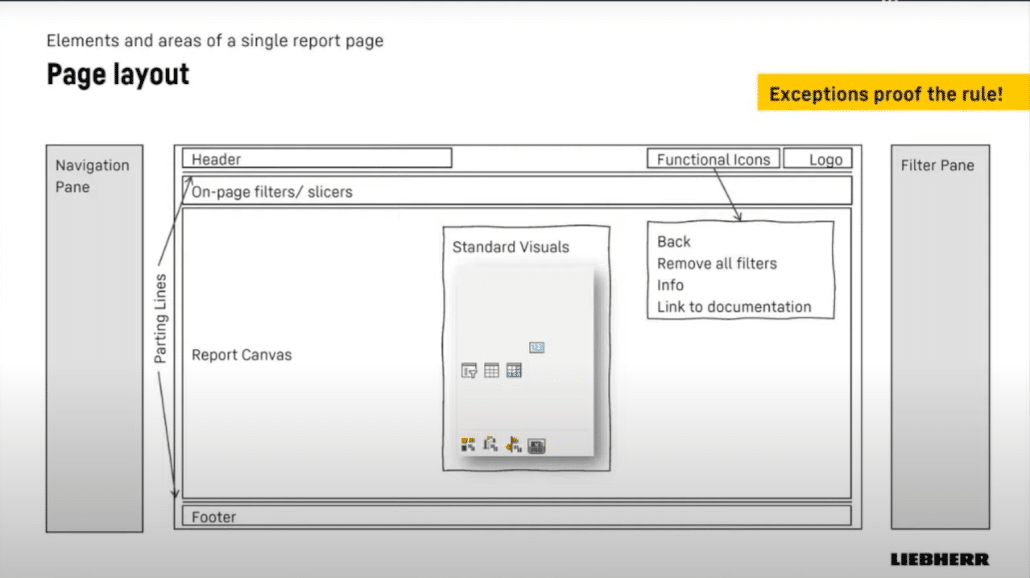
A page layout is one of the most important things to consider. Report creators usually start with a blank page.
Mario's tip 💡: For the layout you have to consider that in the Power BI service, you have the navigation pane on the left and a filter pane on the right. This might be counterintuitive if you put some on-page filters on the left side.
From the blank page, you can divide it into different areas:
''You’re free on creativity regarding functionality, but not on the layout basically.''
Another important point to consider is the on-page filters and slicers area. There is no specific rule for this according to Mario, who emphasizes that this should be created based on users' feedback.
Mario's tip 💡: Include filters that provide interactivity or frequently used elements. For more advanced filter functionality consider the filter pane.
Then comes the heart which is the report canvas. Here it is critical to set some standard visuals as it is often the place for the most creativity.
''The standard visuals should be reduced to the basic set of visuals: table, matrix, slicer, card. Spice them up with some magical and cool additional visuals. This covers 80% of all requests.''
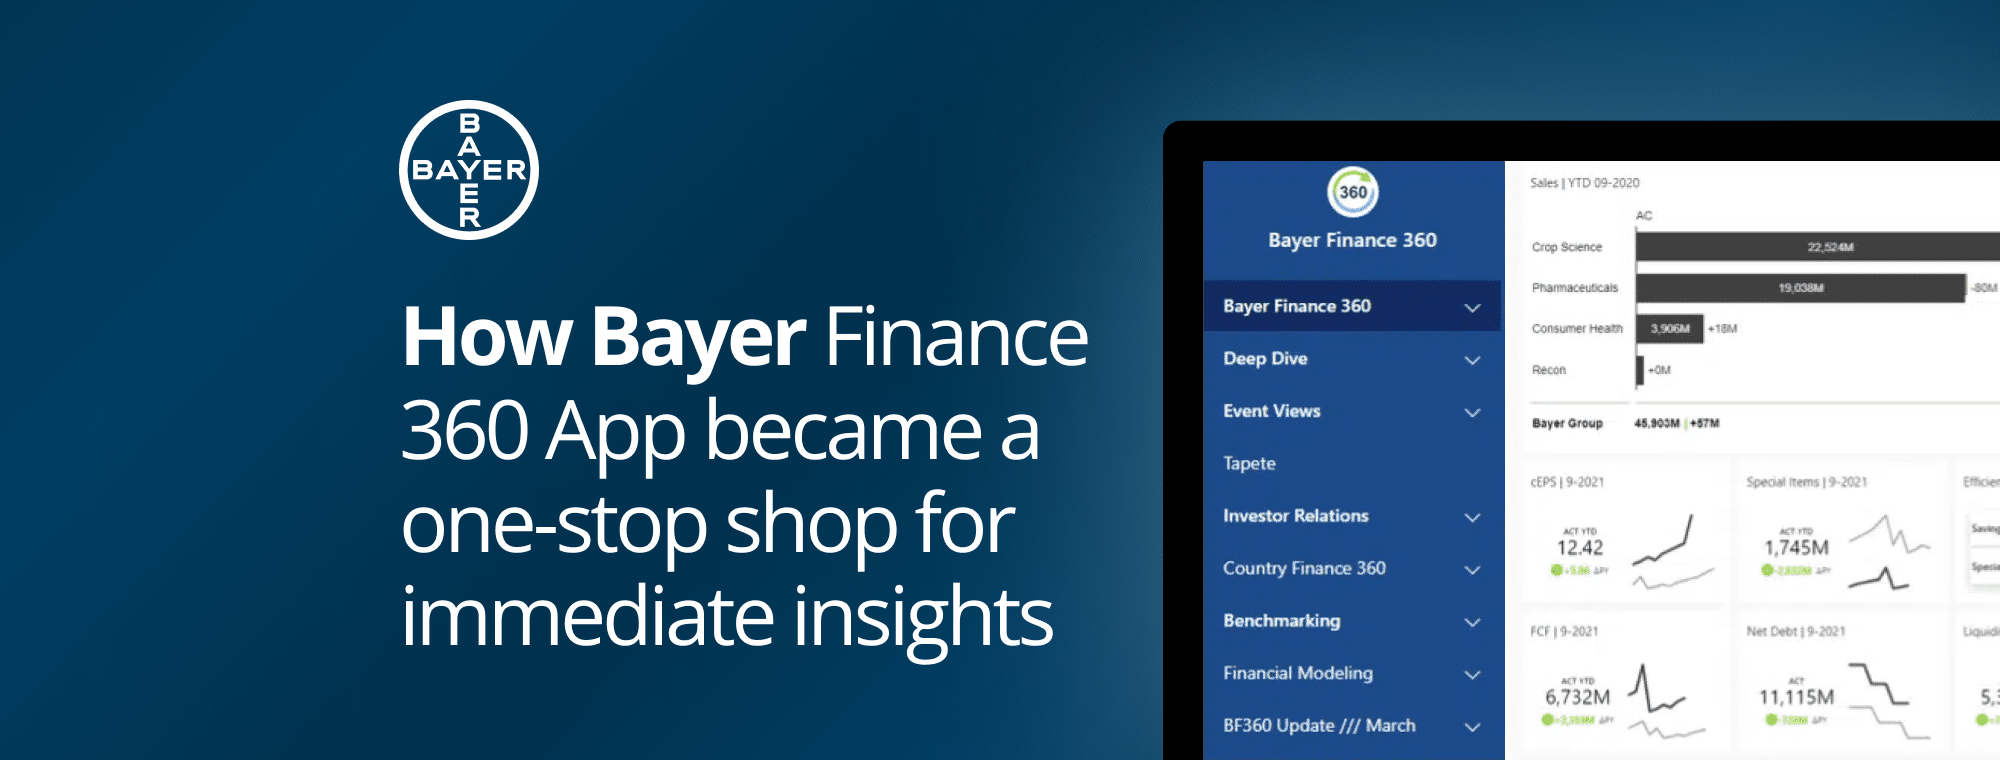
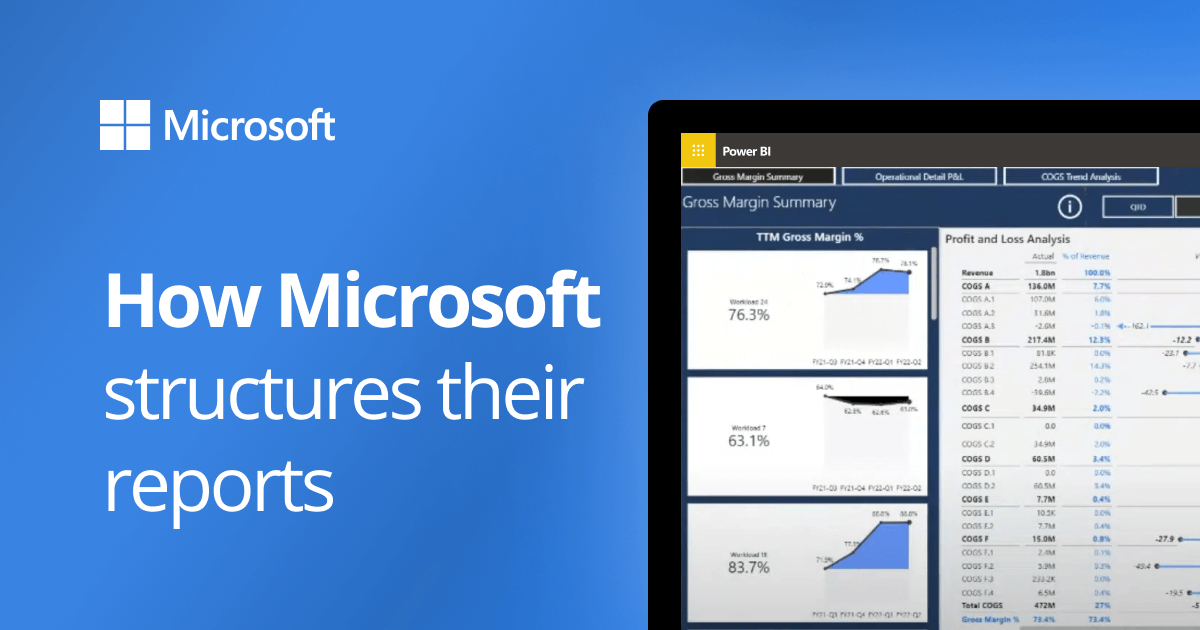
To demonstrate the power of reporting consistency and custom visuals, the Liebherr BI team lead reassembled an actual business report he got. It looked like this:
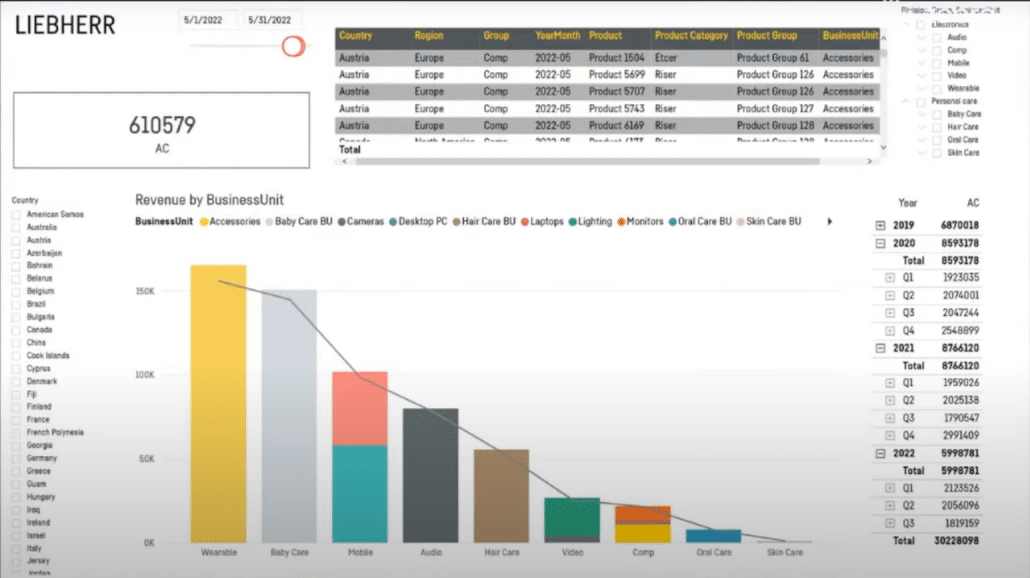
To make the report clearer and point out crucial information, he made some changes.
TITLE: in the initial report it appears somewhere in the middle so users don't immediately know it's about revenue. To improve this you should put the title on top of the page.
DETAILS: in this case, a detailed table at the top of the landing page is too much. To provide more information you should create a drill-through to a more detailed page. This would make the report clearer.
FILTERS: the first report contains many filters across the whole page (country, BU hierarchy, month). To make it easier for the end-users put all filters on the top area and use the Smart filter Pro and the standard slicer.
VISUALS: Add some Zebra BI magic to it and immediately see some recognizable patterns and have room for more detail (add product and country).
DATA LABELS: Add the currency and the unit to the title. Then, you can remove the little 'k' behind each data label to make the report more straightforward.
FOOTER INFORMATION: Narrow down the range of the line chart to add some footer information with the last refresh which is very informative.
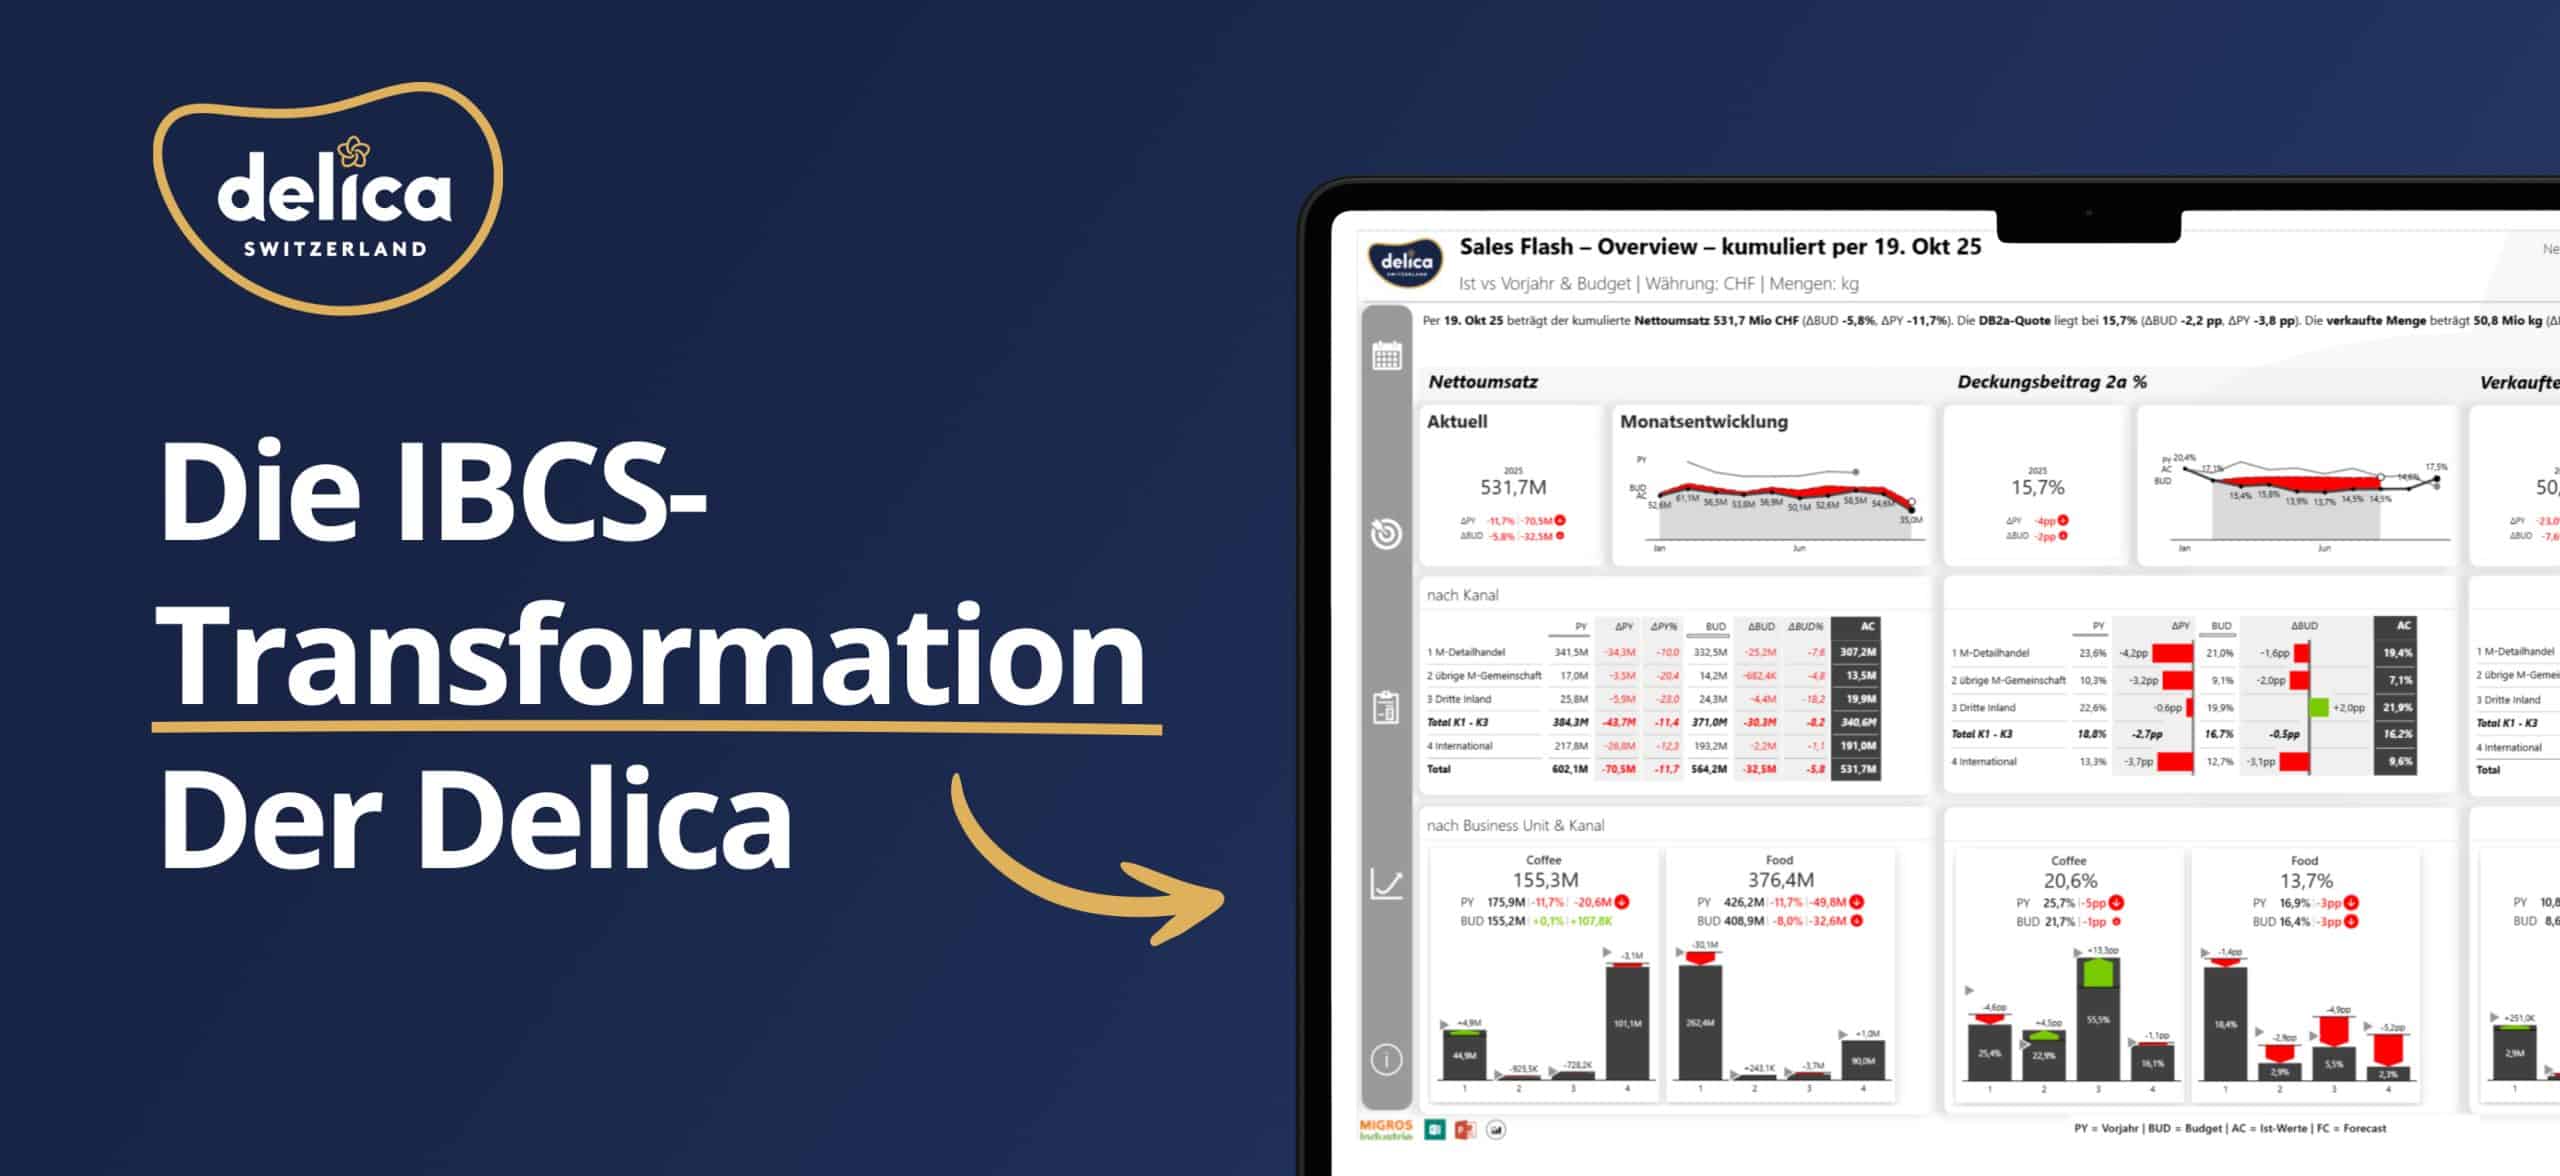
And this is what an IBCS-compliant report looks like:
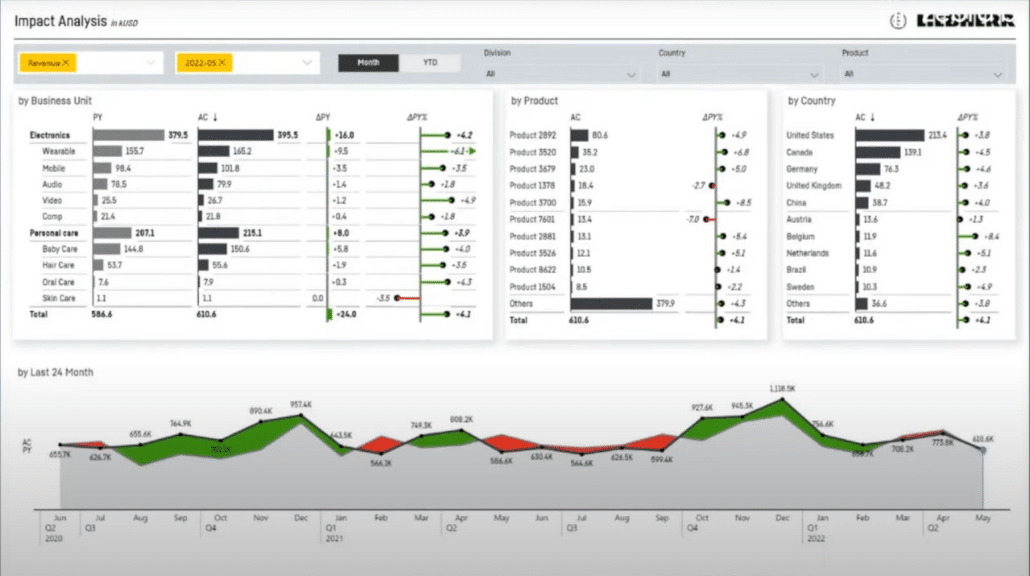
At Liebherr, the top management often commented that an IBCS-compliant report looked all black and wanted more colors. But Mario explained them that the IBCS philosophy is based on the idea that colors should be reserved for when you need to convey a meaning like showcasing the good (green) or bad (red) variances. That's because you should use colors only where you need your reader's attention. And even there you should stick to the same logic always as the same color should always have the same meaning.
It is also very important to add context to the report. For example, you can add some data for the previous year or plan to compare the actual values. It not only looks good but you immediately get insights thanks to automatically calculated variances.
Another advantage is that different reports look similar. Both the sales and finance reports will have the same structure and elements, allowing management to recognize them more quickly. This will enable them to look for insights rather than trying to understand the report.
''If you work with Zebra BI it’s not only easy and fast, but you can focus more on the actual data and the insights.''
At Liebherr, they identified some key elements to use when standardizing reports in Power BI:
However, you need to be careful and patient as there is a learning curve when it comes to incorporating reporting consistency into your company. There are still many controllers and financial professionals who haven't heard about the IBCS and its rules so education is essential.
To sum everything up, Mario prepared some key takeaways for you to remember when you embark on your own journey of report standardization in Power BI:
Ready to accelerate your decisions with consistent reporting?