September 8th
 February 22nd
For years, TÜV NORD GROUP's financial reporting relied on Excel templates and PDFs distributed by email leading to manual work, error-prone reporting, and producing different figures depending on who you asked. Moving to Power BI was an improvement, but native visuals couldn't produce the structured financial reports the controlling team needed. The gap between having data and being able to act on it remained.
When Group Controller Stefan Mahler discovered Zebra BI while searching for a better way to build income statements in Power BI, that changed. Today, TÜV NORD GROUP runs financial reporting for 500 users on a single live platform with dashboards that answer questions rather than raise them, and a C-level that discusses strategy instead of debating which number is right.
TÜV NORD Group is one of the world's leading testing, inspection, and certification organizations, headquartered in Hanover, Germany. Starting from around 2,000 employees, the group has grown significantly through acquisitions to around 15,000 people operating internationally, providing technical services to clients in sectors including energy, mobility, aerospace, and industry.
Stefan Mahler has been Group Controller at TÜV NORD GROUP for over 24 years. The team of approximately ten group controllers reporting directly to the C-level, is responsible for setting the financial reporting standards and governance rules for the entire organization.
TÜV NORD GROUP's reporting journey went through three stages; each an improvement, each with a ceiling.
For years, financial reporting was built on top of SAP Business Warehouse: large tables, complex Excel joins, and PDFs sent by email every month. Each business unit ran its own process, and the results reflected that.
We had a lot of problems with broken references and formula errors in our Excel templates. We spent a lot of time searching for failures in our reporting.
Beyond the manual effort, the business cost was higher: every unit was working with different reports. So sometimes there were disagreements about the figures.
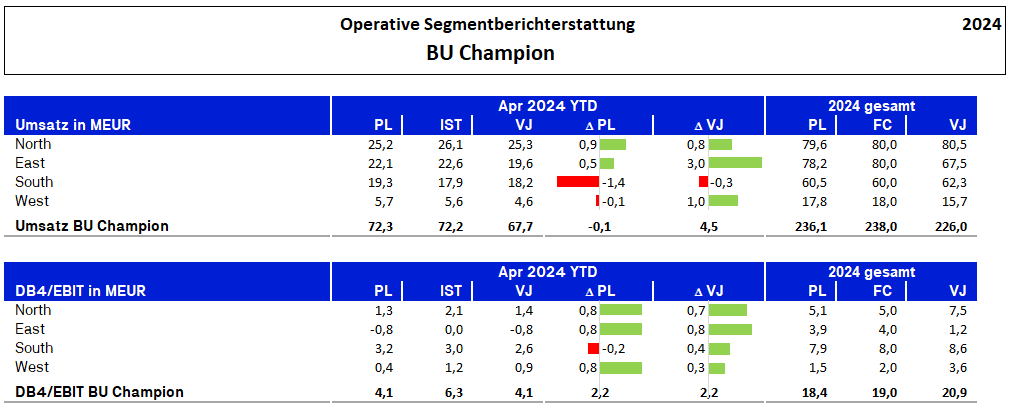
Income statement in Excel & PDF. Disclaimer: The data in the image is fictional and intended solely to demonstrate the layout and structure of the report.
A major infrastructure project changed the data layer. Reporting sources from across the global organization, including subsidiaries without direct SAP connections, were consolidated into a unified Power BI data model. For the first time, the group had one data lake feeding reporting for the whole organization.
But the decision-making problem remained. Native Power BI visuals couldn't produce the structured income statements and variance analysis the finance & leadership team needed. Building financial-grade reports required significant custom development, and the output still didn't communicate clearly to management.
With native Power BI visuals, you have no chance of getting a nice income statement.
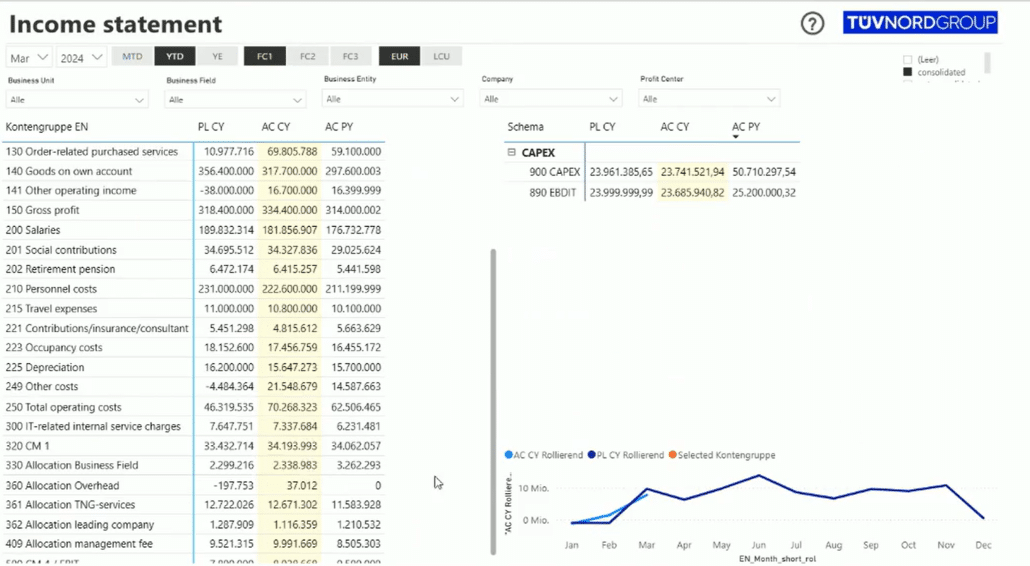
Income statement with native Power BI visuals. Disclaimer: The data in the image is fictional and intended solely to demonstrate the layout and structure of the report.
Stefan found Zebra BI while searching for a way to solve the income statement problem. He found the YouTube channel, watched the tutorials, and downloaded the trial before making the case internally. After thorough testing, he got the green light to move forward, starting with 10 licenses.
For the first time, every business unit was working from the same numbers in the same format. Stefan rebuilt the core reports using Zebra BI custom visuals: income statements, EBITDA tracking, seasonal monthly results, all pulling live from the unified data model.
I didn't change anything from Zebra BI's default settings, they're clear and understandable for our needs
The reaction when people first saw the reports was telling. Immediately, users asked: can I download this for PowerPoint? Stefan's answer was deliberate: you don't need PowerPoint anymore. That shift, from static file to live dashboard, was part of what changed.
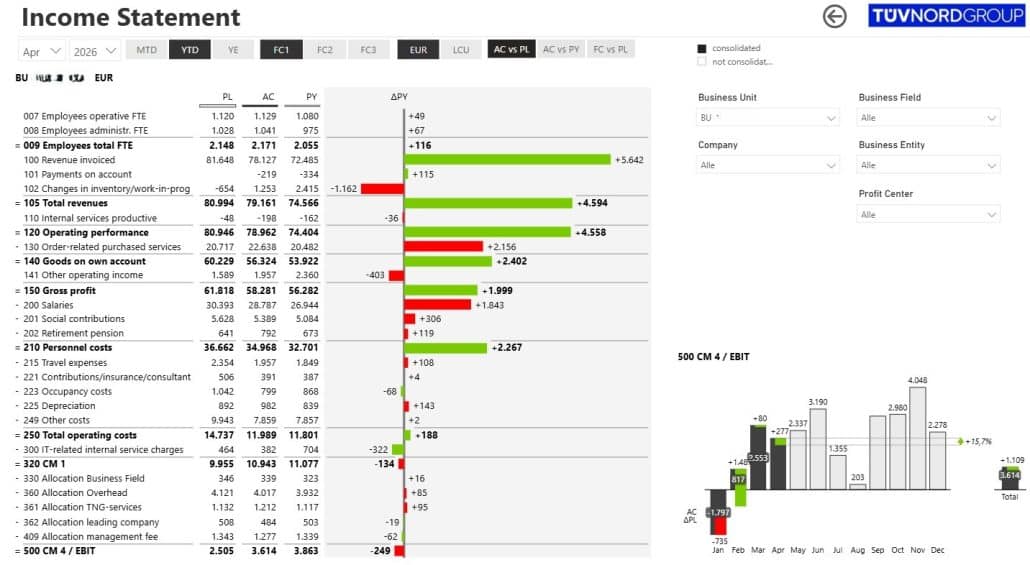
Income statement with Zebra BI visuals inside Power BI. Disclaimer: The data in the image is fictional and intended solely to demonstrate the layout and structure of the report.
The most significant change wasn't visual. It was conversational. Different reports sometimes produced different numbers. With reports built on a unified data model and visualized consistently in Zebra BI, those disagreements stopped.
The most important impact is that everyone now discusses the same figures. Before, we sometimes debated the numbers. Now we have time to focus on understanding why the figures are what they are and what to do.
For a team responsible for financial governance across a global organization, this was the real shift: the meeting could start with the decision, not the data.
With live dashboards replacing monthly PDF distributions, management across TÜV NORD GROUP now accesses financial data on demand. Around 300–400 users access reporting every month. Increasingly, people are opening dashboards during meetings to check recent developments, including at C-level. One report serves both: a high-level view of revenues and EBITDA with direct navigation into the income statement, without a simplified summary deck sitting alongside it.
Adoption at this scale doesn't happen because reports look better. It happens because they become genuinely useful and trusted enough to replace the old process entirely. Growing from 10 initial licenses to 500 users across TÜV NORD GROUP is a reflection of what happened when people saw reports they could actually make decisions from.
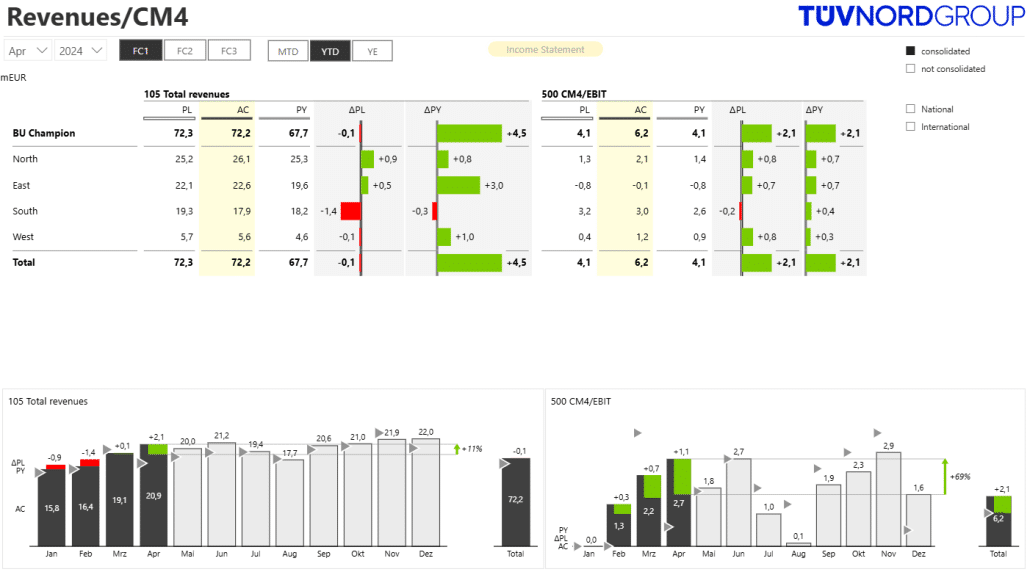
Disclaimer: The data in the image is fictional and intended solely to demonstrate the layout and structure of the report.
When financial data lives in multiple systems and gets reconciled in Excel, the real cost isn't the hours spent formatting; it's the meetings that start with the wrong question. Standardized, decision-ready reporting doesn't just save time. It changes what your leadership team is able to talk about.
Make Power BI work for financial reporting, like TÜV NORD GROUP