Share this
 September 8th
 February 22nd

How awesome would it be if you could apply your preferred font size, style, or color to the elements on the Zebra BI Cards visual?
Based on the number of requests, it would be monumental. 😎 The 1.2 update of Zebra BI Cards enables you to apply your preferred font settings to all the elements on a single card: KPI title, value, variances, and chart label by simply opening the global toolbar and clicking on Fonts.
It has for sure made our day. But a friendly reminder: consistency is the key to actionable reports. Once you change the colors of the elements, keep in mind that one color must always keep the same meaning.
Is it possible to make the Zebra BI’s dynamic comments even better? The answer is: yes!
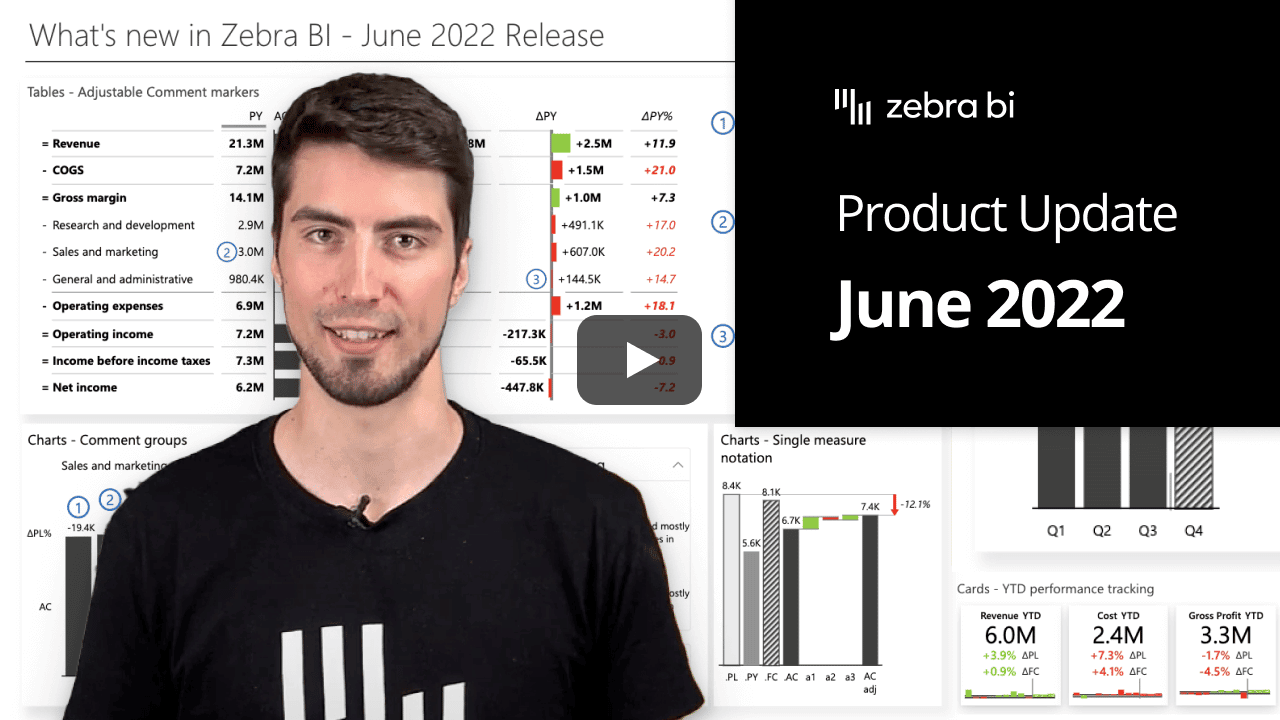
The exciting updates from the 5.3 release of Zebra BI Tables have received an upgrade. The comment markers are now also dynamic. In practice, this means that you can move the marker from one column to another. Changing the placement also updates the comment value in the comment box.
Result? Full flexibility over which column is explained by the comment. This gives even better visibility to your reports. Could it get any better? 🤩
The flexibility of a chart is essential to fully match the needs of a designer or end-user. We got you. The single-measure waterfall chart has just received a major upgrade. You can now apply patterns for scenario design settings to the elements on the chart.
To do that simply right-click on the respective x-axis element (category) and mark it as a Result. Then, right-click again and choose the appropriate Scenario pattern option.
You do not have to worry anymore about the legibility of the legend when you apply custom colors or use black color as a chart’s background.
From now on, the legend entry is the same color as the lines or columns, depending on the chart type. How to do that:
Displaying multiple plans with one table is one of the biggest advantages of your reports. It lets you stay agile, and it helps you adapt more quickly if the circumstances change.
To improve the user experience and make your reports more actionable, you can now also separate different plans. Each value is marked with a different notation following the IBCS guidelines. The report is clearer, and it shortens the action distance even further. 🎉
To completely understand the performance of the first five months of the year, you cannot compare it to the total value. Instead, you would want to compare it with the same period in the previous year. That is the only way to put data into the right perspective and make the right business decision.
Discover the feature that allows you to display the year-to-date (YTD) value for each of your KPIs. You will always know if a KPI is performing better or worse than it did in the same previous period. And the best part? It is just one click away! 🎯
If you're using the AppSource version of Zebra BI (version 4.0.0 or higher), then your Zebra BI will be updated via Microsoft's AppSource marketplace automatically once processed. Expected release dates according to the Microsoft Power BI team:
If you're using an older (private) version of Zebra BI (e.g. 3.x.x or older), then this is a perfect opportunity to update your Zebra BI! When ready, just shoot us an email at support@zebra.bi and we'll help you migrate to the latest version.
Haven't tried Zebra BI before? Opt-in for our 30-day free Pro trial here: