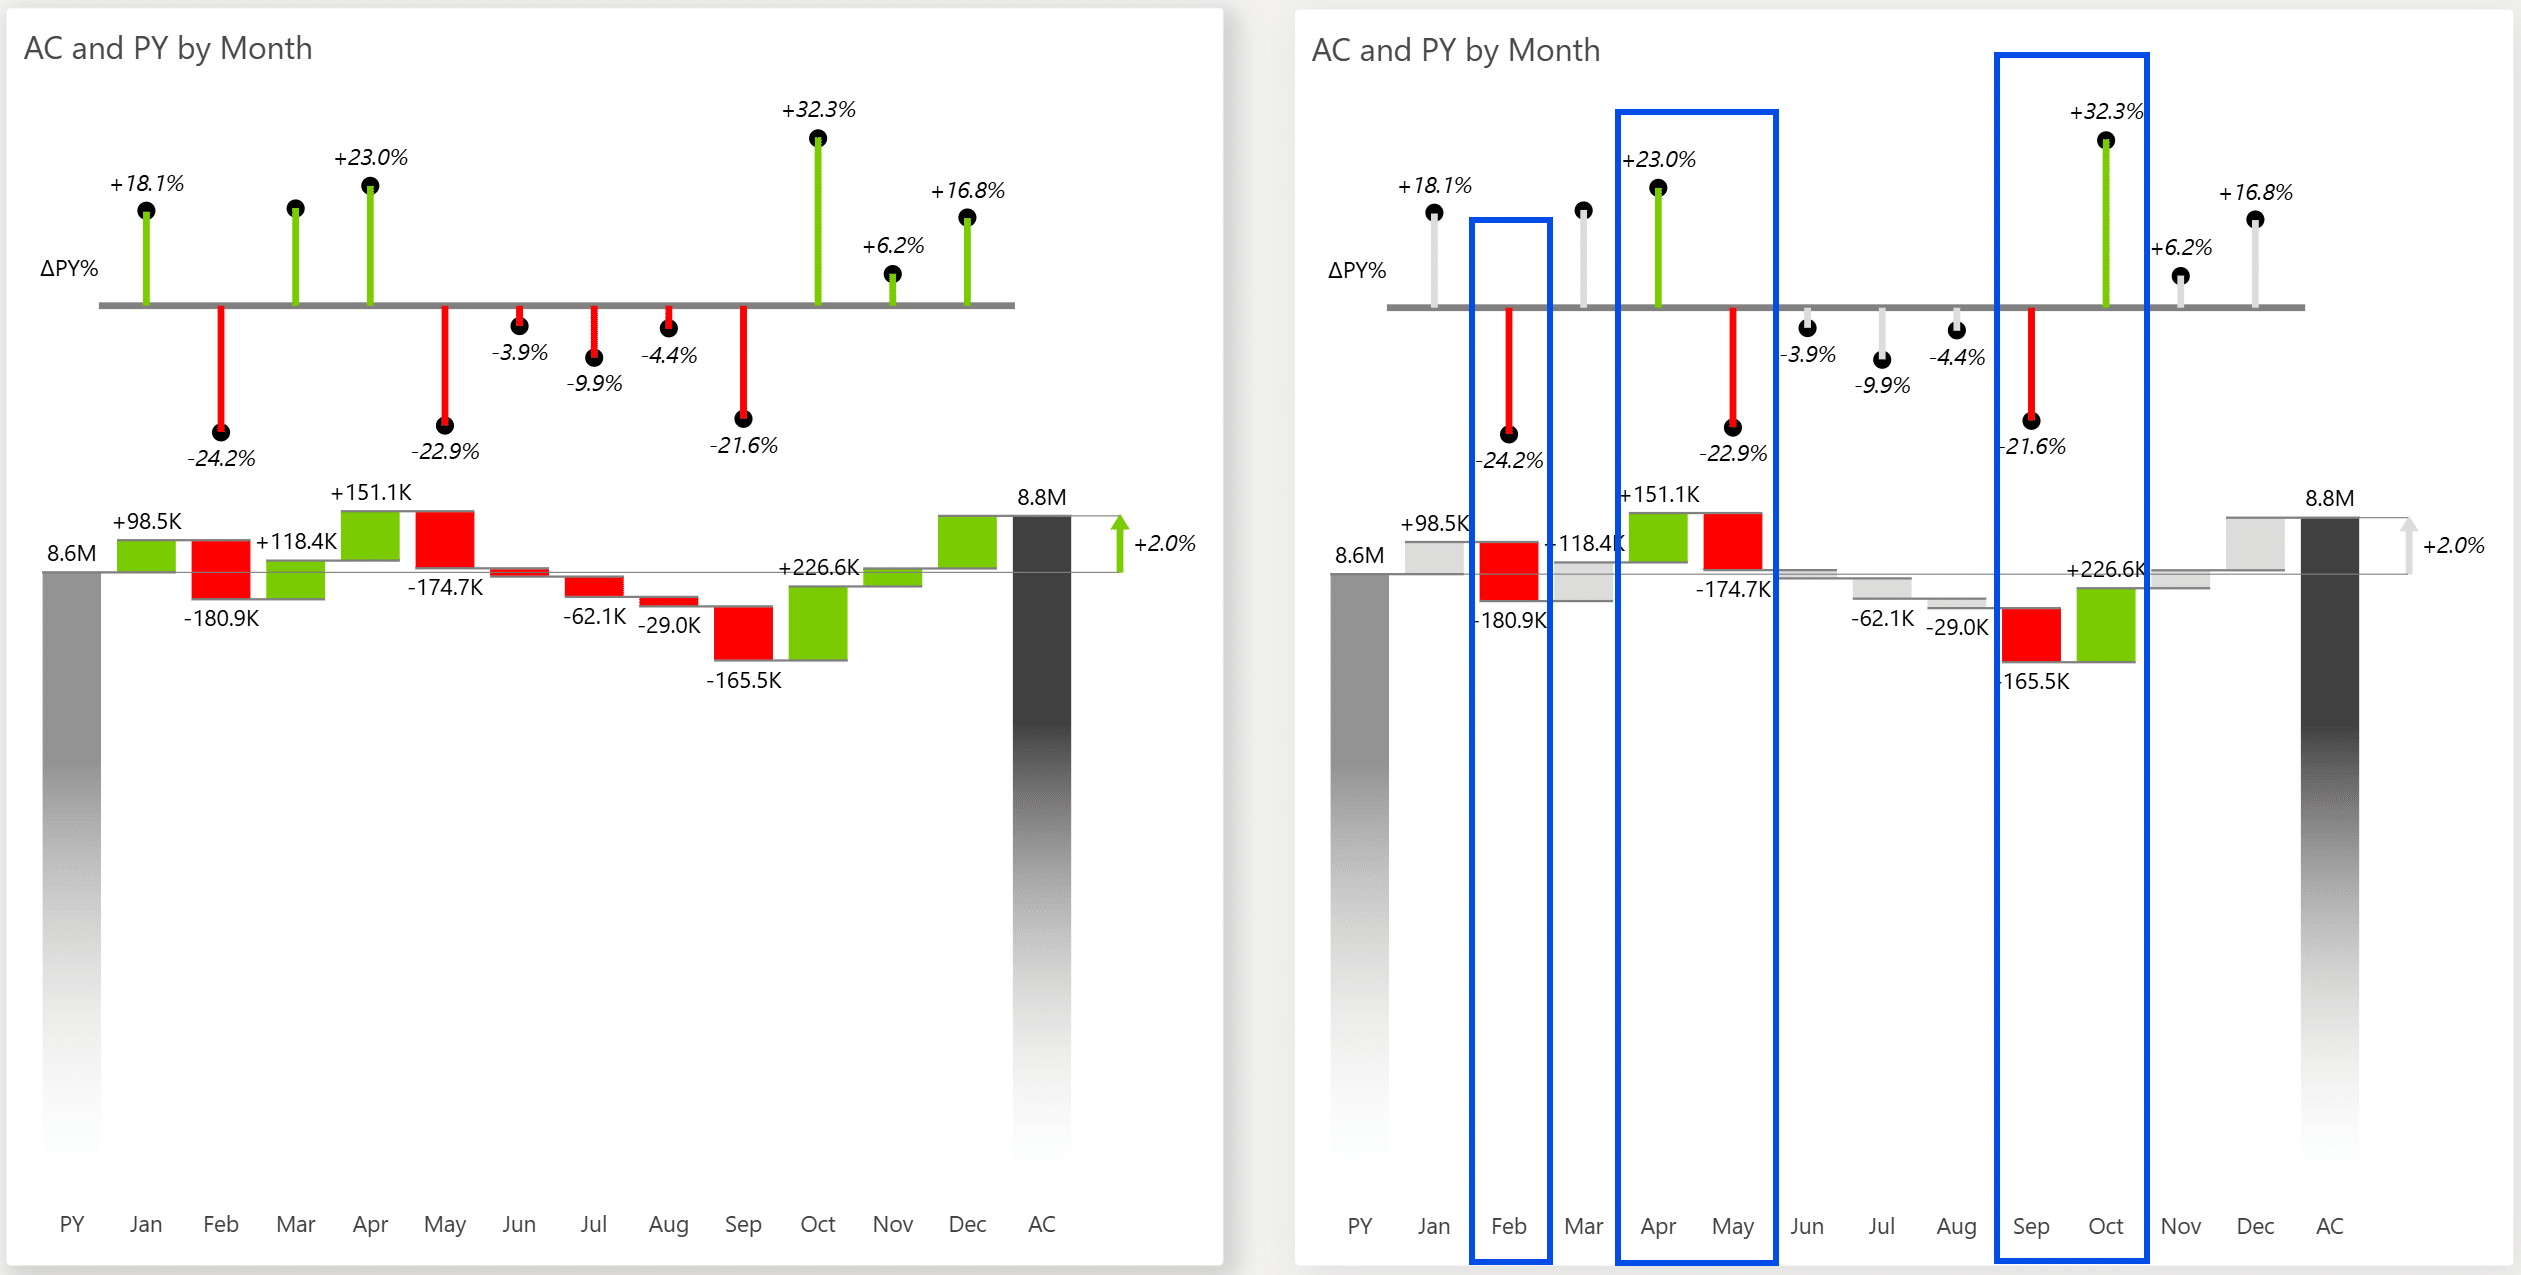
Sometimes, not every variance signals a problem. Now your reports can reflect that.
With Zebra BI Charts and Tables, expected fluctuations can now stay quiet, and only what truly needs attention stands out.
Share this
 September 8th
 February 22nd
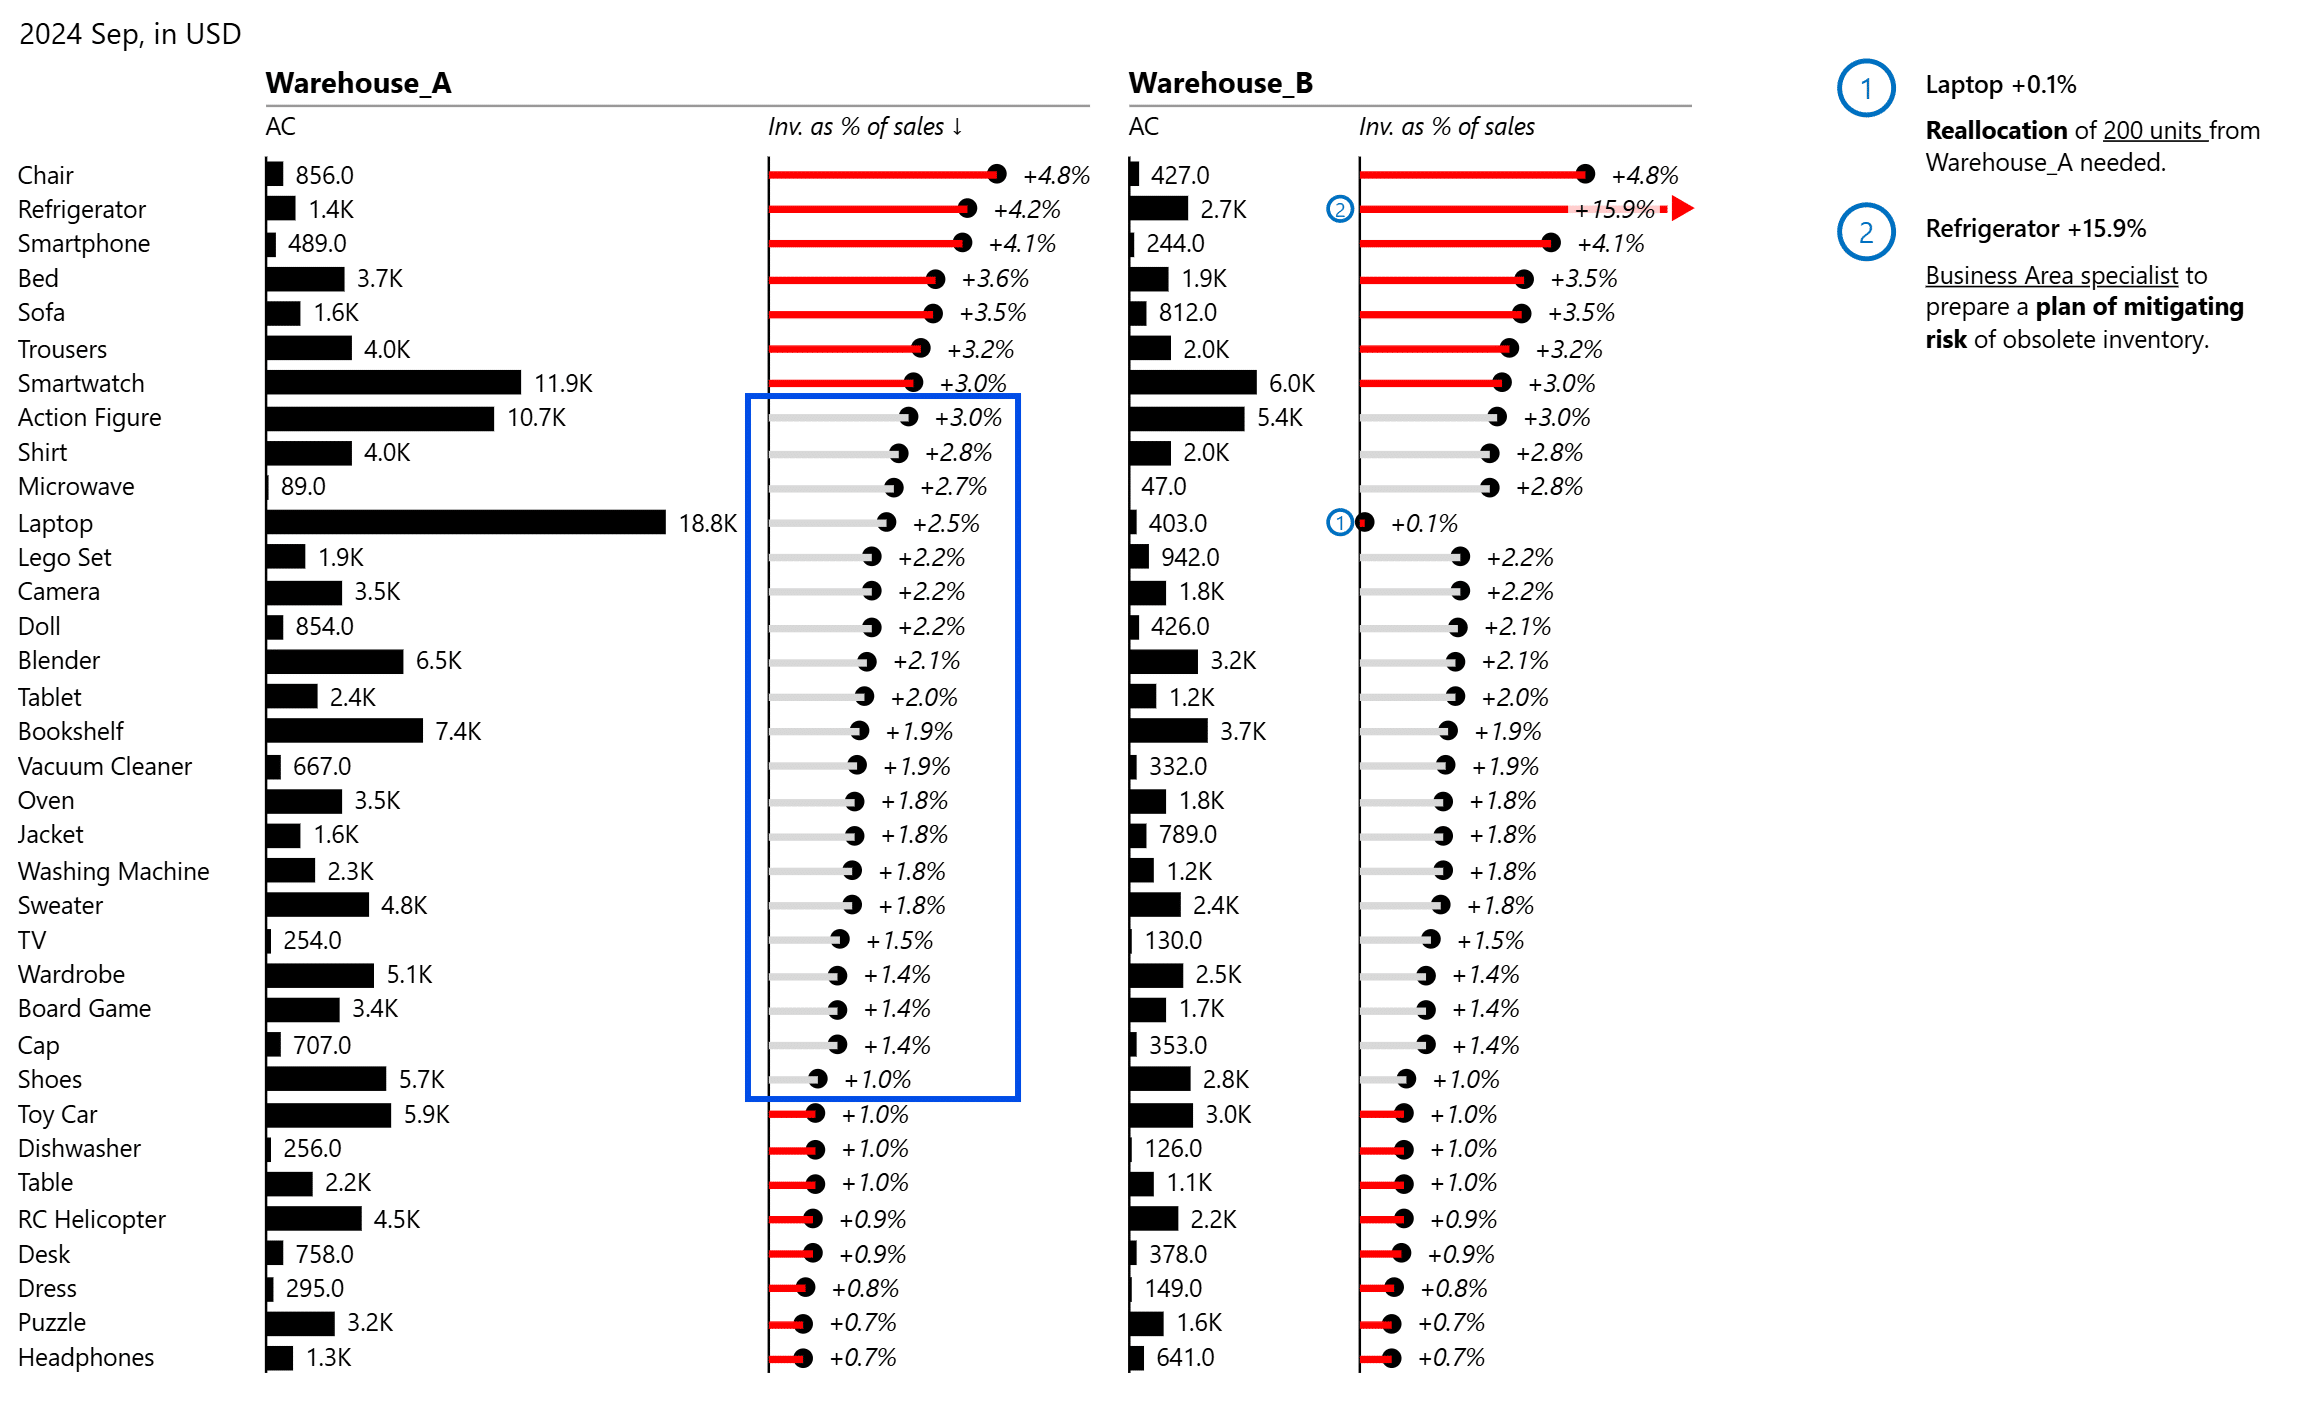
In real-world reporting, not all variances are simply binary.
In an inventory report, a 1–3% stock level is healthy. Values inside that range stay neutral. A shortage at 0.7% or an excess at 4.8% stands out immediately.
Your team sees exactly where to act.
In native Power BI, achieving this requires complex DAX measures and hardcoded boundaries.
Now, simply open the on-visual settings in Zebra BI Charts (legend) or Tables (column header), set your tolerance band and colors, and you're done.
*To maintain IBCS compliance, neutral variance color is off by default.
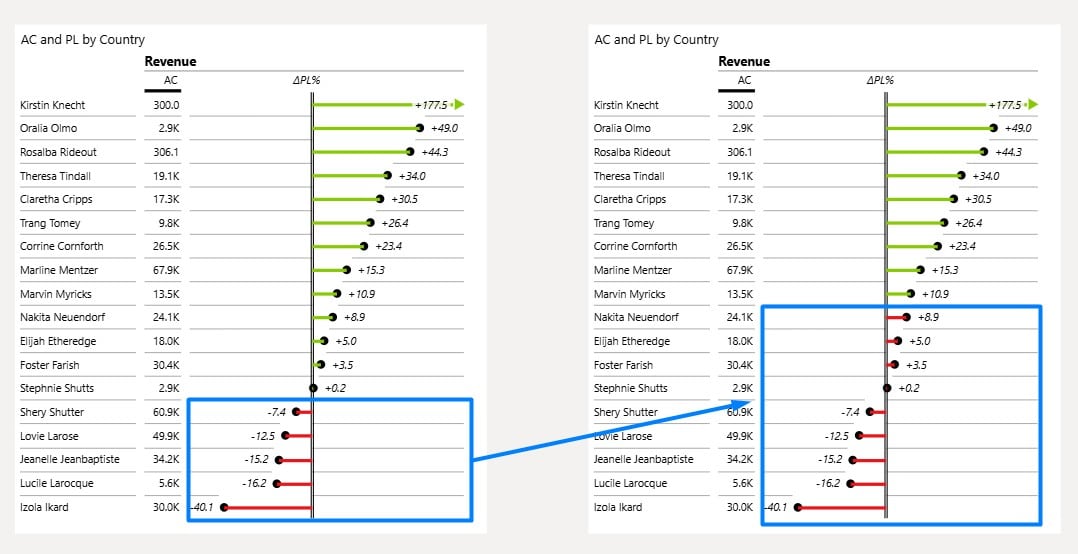
In high-growth markets or aggressive sales campaigns, being above zero is not good enough.
Set both thresholds to your real benchmark (+10%, for example), and the color flip point moves with it. A country at +8% growth now shows red, not green.
Only what genuinely hits your target counts as success.

If you're using the AppSource version of Zebra BI (version 4.0.0 or higher), then your Zebra BI will be updated via Microsoft's AppSource marketplace automatically once processed.
If you're using an older (private) version of Zebra BI (e.g. 3.x.x or older), then this is a perfect opportunity to update your Zebra BI! When ready, just shoot us an email at support@zebrabi.com and we'll help you migrate to the latest version.
Haven't tried Zebra BI before? Opt in for our free trial here: