IBCS® Certified
PBI Certified

Zebra BI for Power BI – 5.0 Update

The latest major release of Zebra BI visuals for Power BI 5.0 is delivering on its promise. By introducing an exceptional commenting experience, advanced stacked charts with innovative functionalities, flexible row formatting, and many other design options, Zebra BI is enabling you to truly express yourself and make sure your reports are as actionable as possible!
Download the Demo PBIX file that contains all the latest features illustrated with many practical examples.

Note: This is a private version of our Power BI visuals (not the AppSource version).
Download PBIX

Watch the Video

Watch the video below for a quick and practical overview of all major NEW features & updates:
(0:04) - Intro to 5.0 Release
(0:45) - Smart Comments
(4:08) - Advanced Stacked Charts
(12:39) - Flexible Row Formatting
(16:04) - Dark Themes Support
Share this

Interact with Zebra BI for Power BI 5.0 👇

Play with our interactive example to get inspired and see all the new features in action. 
Tip: Make sure you put the interactive report in the full-screen mode (⤢) and check out all the pages by pressing the navigation arrows.

So, what’s new? 🎉

Integrated dynamic comments

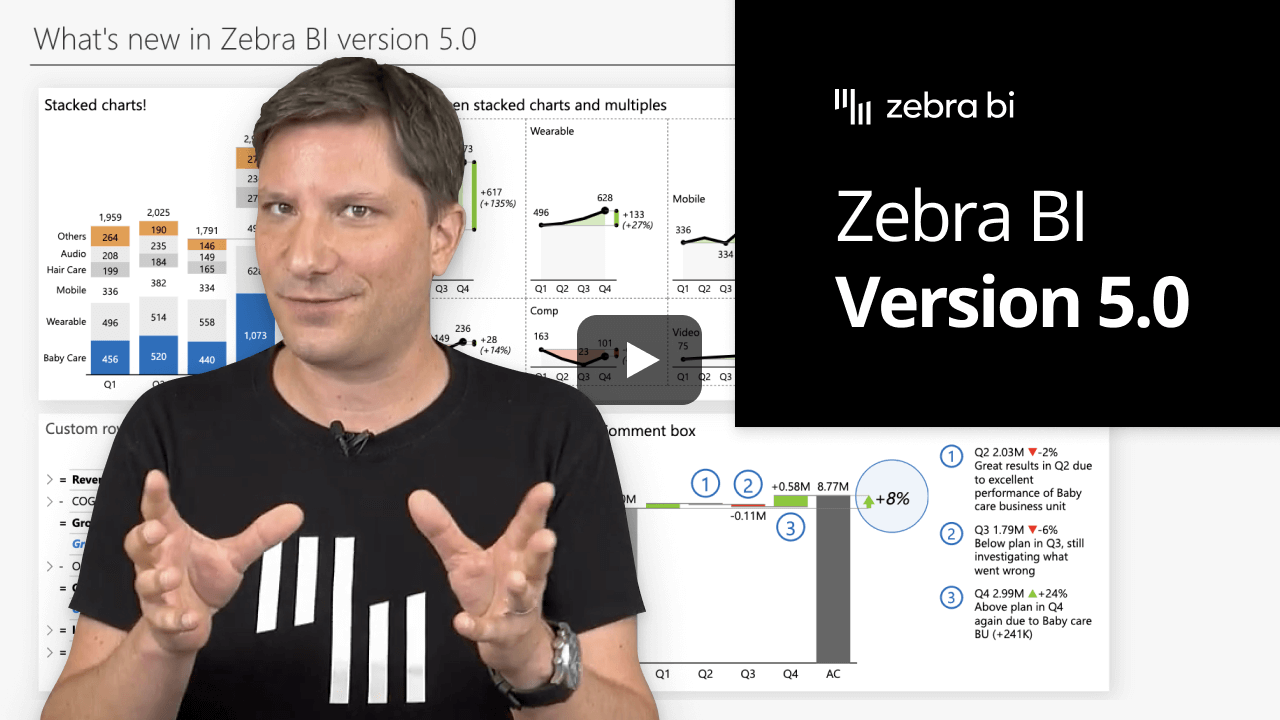
Did you ever wish to have the comments displayed directly next to the chart or table? No worries, we got you!

With the 5.0 release, adding comments to your reports has never been easier.

Simply add your comment data field to the visual to display your comments beautifully. Right inside the visual!

💡 What are the main advantages?

  • Automatically generates the title based on the category name and even calculates variance for you in case you have a comparison. The red or green triangle marking the difference will help users understand the message even quicker.
  • Responsive and adapts to the size of your table.
  • Completely dynamic so you can simply switch the time period to see only the relevant comments.

Example: Changing the time period in a P&L Statement

Advanced Stacked Charts

Stacked charts are quite popular charts, however, up until now they easily became too confusing and difficult to understand if there were many data series displayed. To bridge the gap in data visualization, we're introducing Zebra BI Charts 5.0 with one of the most powerful stacked area and column charts out there.

Comparison Highlight

Show the comparison of multiple measures within a stacked chart! Simply take the measure, put it in the right placeholder and your stacked chart will present the comparison!

Sticky Highlight

Simply right-click on the legend to highlight any data series and steer the attention of the end-user in the right direction.

Top N + Others

Avoid the confusion of showing too many data series! Zebra BI automatically sums up the data into Top N + Others for you. It's up to you to decide how many data series you'd like to display and you can easily change the number of data series in 1 click.

Responsive Filtering

Use responsive filtering to highlight one data series and automatically change other graphs for the most appropriate ones. This way you can easily display even more information (e.g. difference highlight, variances, etc.) related to that selected series. If you want you can easily switch between charts to further customize the appearance.

Switch to Small Multiples

For small multiples fans: this chart is completely integrated with Zebra BI functionalities, so the viewers can simply switch between stacked charts and small multiples anytime!

Flexible Row Formatting

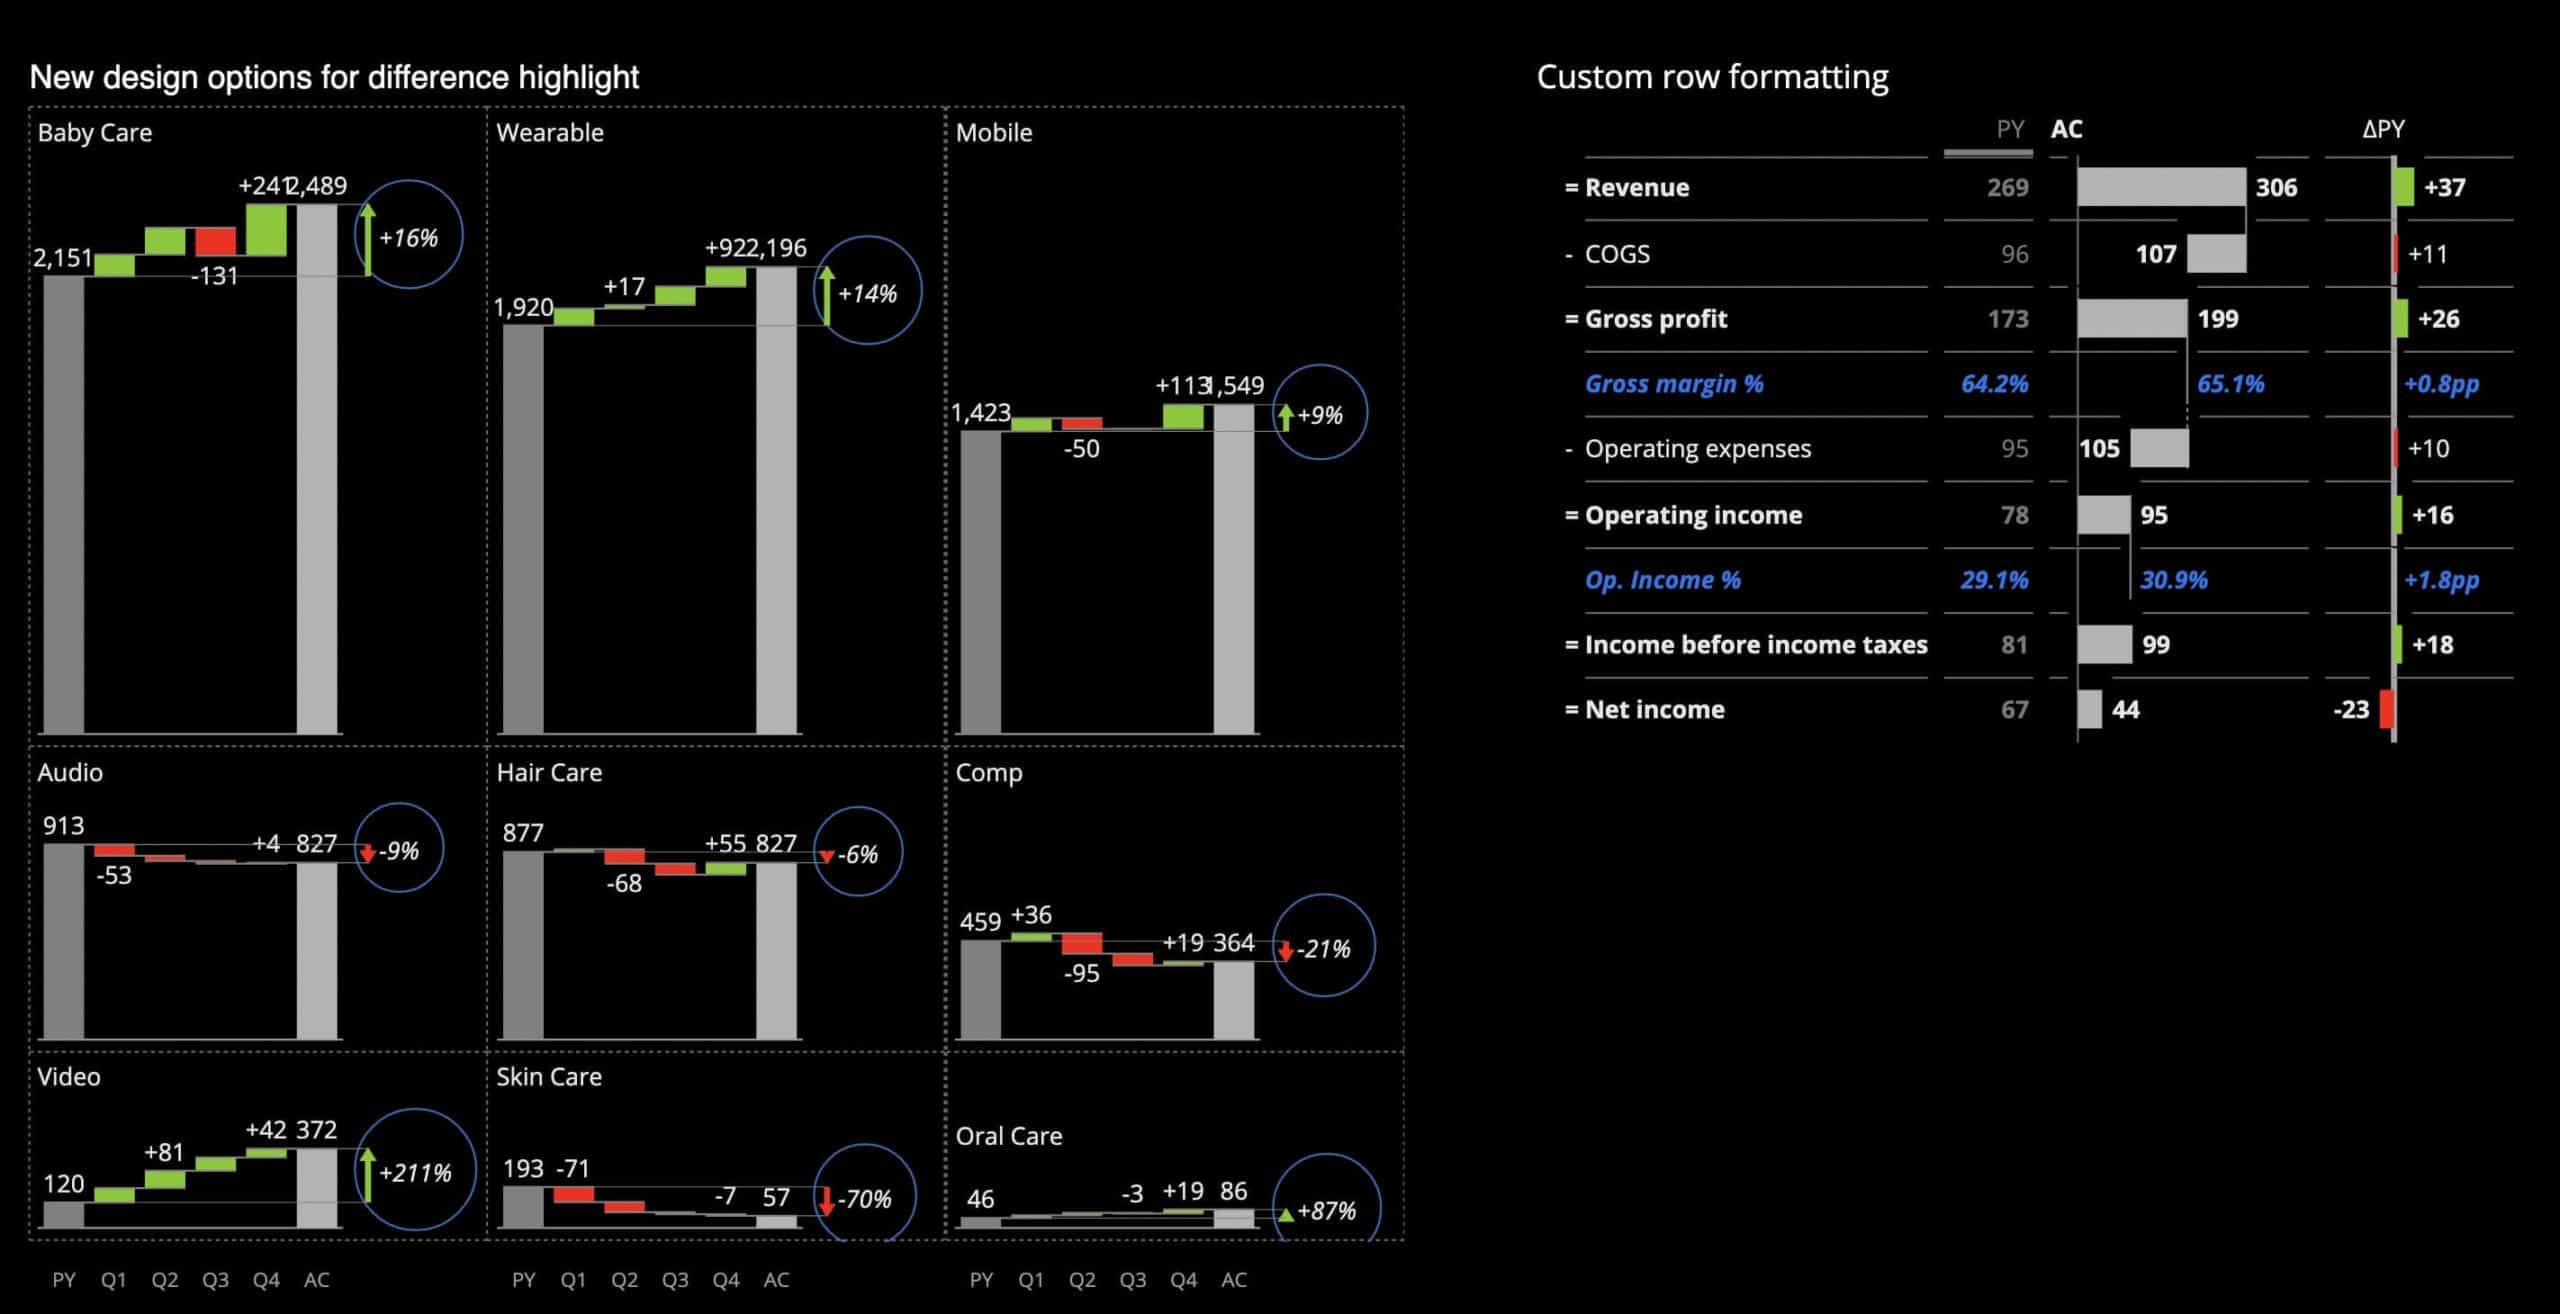
If you want to highlight important elements in your table or when displaying different KPIs in the same table, you can now completely customize the design of each row (font, colors, number format).

You can now easily change the font color, number format, bar color, and many other features for every row.

How to do that?

  1. Right-click on the selected value (e.g., COGS) to open the menu.
  2. Choose the Format option and play around with different settings for the selected row.

Dark Mode Support

Until now we were only 0.1% away from the complete compatibility with dark themes in Power BI. With this update, we reached 100%.

From now on, even the background of your zoomed chart (that used to be white) can be formatted according to your needs.

Simply go under Format, scroll to Small Multiples and find the Zoomed chart background where you’ll see a new color picker, so you can just pick the color that suits you best.

Bright or dark theme? You don’t need to hesitate anymore, because we will support you 100% either way.

Other Improvements

Zebra BI Tables 5.0

  • The Suppress empty columns setting now supports Zebra BI formula calculations. You can dynamically switch comparisons between for example PY and a plan in a Zebra BI Table even if it contains custom formulas added with Zebra BI Formula Editor.
  • Upgraded Microsoft Custom Visuals API to version 3.6. This fixes an issue where MS Power BI returned wrong DateTime values under certain regional settings.
  • Added the column format drop-down menu to columns in all matrix (cross-table) layouts.
  • Fixed an issue in certain cases where drag&drop reordering of columns was not working correctly.

Zebra BI Charts 5.0

  • Upgraded Microsoft Custom Visuals API to version 3.6.
  • Fixed an issue where the difference highlight was not displayed correctly in a single-measure waterfall chart with negative totals.
  • Fixed an issue where the axis break was not working correctly in a single-measure waterfall chart with negative totals.
See full changelog

Time to give it a spin!

If you're using the AppSource version of Zebra BI (version 4.0.0 or higher), then your Zebra BI will be updated via Microsoft's AppSource marketplace automatically once processed. Expected release dates according to the Microsoft Power BI team:

  • Zebra BI Tables 5.0: July 7, 2021
  • Zebra BI Charts 5.0: July 14, 2021

If you're using an older (private) version of Zebra BI (e.g. 3.x.x or older), then this is a perfect opportunity to update your Zebra BI! When ready, just shoot us an email at support@zebra.bi and we'll help you migrate to the latest version.

Haven't tried Zebra BI before? Opt-in for our 30-day free Pro trial here:

Start Your 30-Day Free Pro Trial