IBCS® Certified
PBI Certified

Zebra BI Tables 6.0 for Power BI

The highly anticipated performance update of the Zebra BI Tables is here! 
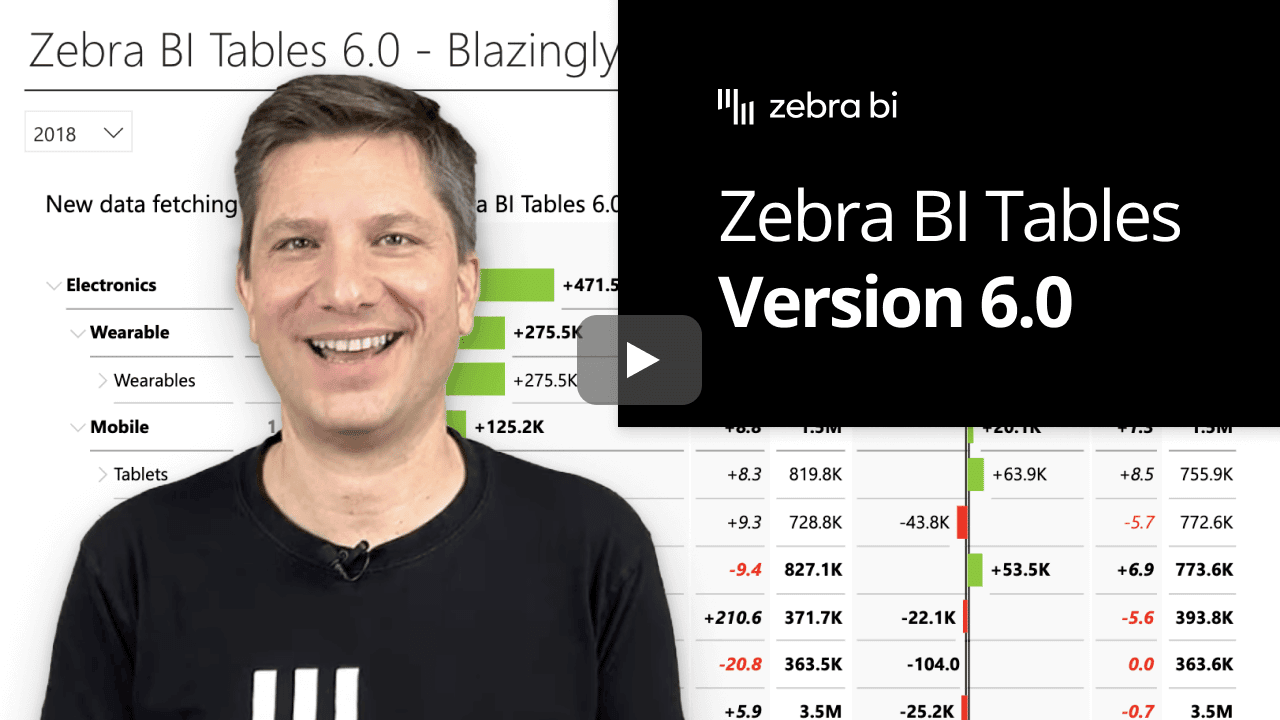
With the 6.0 update, we are making data loading time in tables with hierarchies up to 50x faster making it the fastest custom visual for complex matrix scenarios! 🚀 Together with some other significant new features like new highlighting options, more drill options, a new calculations manager, and the possibility to bookmark all settings, this will take your report to the next level and present a game changer in your dashboards!

Since this is a completely new Zebra BI visual, read below more instructions on how to use it in your reports. 
Download the Demo PBIX file that contains all the latest features illustrated with many practical examples.

Note: This is a private version of our Power BI visual (not the AppSource version).
Download PBIX

Watch the Video

Watch the video below for a quick and practical overview of all major NEW features & updates:
(00:02) Intro to Zebra BI Tables 6.0 release
(00:51) Performance optimization
(02:30) New highlighting options
(03:41) Drill up, drill into, expand all down one level and go to the next level
(06:57) Bookmarkable settings
(08:51) Calculations manager
(11:17) Important information about using the Zebra BI Tables 6.0 visual
Share this

Interact with Zebra BI Tables 6.0 for Power BI👇

Play with our interactive example to get inspired and see all the new features in action. 
Tip: Make sure you put the interactive report in the full-screen mode (⤢) and check out all the pages by pressing the navigation arrows.

So, what’s new? 🎉

Major performance optimization

Zebra BI Tables 6.0 is the fastest custom visual for complex matrix scenarios as it is the first one using the latest Microsoft API! 🥇 What changed?

The visual now only fetches the data that is necessary when a user expands a row. While you are clicking on expand, e.g., to business unit, division, etc., the data is loaded on-demand and not all at once. As a result, the rendering of the visual is blazingly fast.

This visual is optimized for speed in complex scenarios with different hierarchical tables. Do not miss this one and save some precious time!

Custom highlighting

Did you ever want to customize the highlighting of the rows but could not? Not a problem anymore!

Besides huge performance gains, the latest version of Zebra BI Tables brings better accessibility options for your audience. A new setting for row hover is now available under Interaction settings. Switch between bold and highlighting on row hover or turn this off completely. What is better than that? With the color picker, you can apply your preferred color and adjust the report to your needs.

This will make your data storytelling even more accessible for your end-users! 🎯

New drill options

It has never been easier to drill into every detail of your data blazingly fast!

The Zebra BI Tables 6.0 visual now supports all native Power BI drill functionalities. Besides the basic expanding and collapsing of rows, you can now explore the complete set of options at the top of the visual: drill up, drill into a specific branch of your row structure, expand all branches down one level, or go to the next level.

Gain a deeper understanding of your data and increase the interactivity of your reports with even the last detail available! 🔎

Bookmark all settings

When we say everything, we mean EVERYTHING. 💥

When you explore Zebra BI Tables 6.0 you can bookmark any of the settings. This will allow you to save any view for next time. Why is that so great? Within the same visual, you can have many different views that are predefined and the user can seamlessly switch between different information.

Simply, bookmark your views by using the native Power BI bookmark navigator and take your reports to the next level.

Calculations manager

Having custom calculations is indispensable for the seamless creation of many reports. But how to make this even better?

Users can now simply review all custom calculations in a visual! Right-click on the row, choose ''manage calculations'', and you will see a nice overview of all calculations used in the specific table. If you need to redesign or delete some of them, simply select them, click the delete button and save.

Take control over your custom calculations in seconds. ⏱

What do I need to know 👇

Will my reports with Zebra BI Tables visual update automatically?
No. The Zebra BI Tables 6.0 is a completely new, separate visual available in AppSource. The new API that enabled significantly faster data fetching, is not 100% backward compatible so the auto-update of the old technology to the new presented bigger risks.
When I switch to Zebra BI Tables 6.0 will this have any negative impact on my report?
Because it was not possible to automatically transfer all settings from the previous version, you will need to re-apply any Zebra BI custom calculations you are currently using in Zebra BI Tables visual (e.g., invert, skip, result, etc.). Also, if you are using bookmarks in your current reports, you will need to recreate them.
What is the difference between Zebra BI Tables 5.4 & Zebra BI Tables 6.0?
All the features available in Zebra BI Tables 5.4 (or older versions) are available in the new visual which also includes all the new features listed on this page. However, any future updates will only be added to the new Zebra BI Tables 6.0 visual.
Is Zebra BI Tables 6.0 also Microsoft certified?
Yes! The new visual is also Microsoft certified, meaning that it passed the rigorous testing processes, and it ensures the highest security standards are met.

How do I get add the new Zebra BI Tables 6.0 visual in my reports?
Get the visual in AppSource, add it to your report and then switch each existing Zebra BI Tables visual to the new one. We recommend you first switch the tables with the slowest load time first.
What will happen with my reports that contain Zebra BI Tables visual, version 5.4 (or older)?
Nothing. We will continue to support the previous version of the Zebra BI Tables visual, however we will not update it. You can switch to Zebra BI Tables 6.0 visual at your own pace in the reports you wish.
I am already a customer. Do I need to pay more for Zebra BI Tables 6.0?
No. The new visual is part of the package for Power BI together with Zebra BI Charts & Zebra BI Cards. No additional costs involved.
I am having issues with updating my reports to Zebra BI Tables 6.0, who can help me?
Please, write an email with a description of your issues (and screenshots if applicable) to support@zebrabi.com and our team will get back to you ASAP.

Other Improvements in Zebra BI Charts & Cards

Zebra BI Charts 6.0

  • Explore the 2D Small Multiples by adding two dimensions in the Group placeholder. 
  • Rename legend entry directly in the chart. 
  • Added interaction setting for Legend settings.

Zebra BI Cards 1.3

  • The Uniform layout enables you to set all cards to the same dimension effortlessly.
  • Rename the scenario aliases directly in the chart's legend inside a card. 
  • Customize the background color on all cards at once or only change the background color on an individual card.
See full changelog

Time to give it a spin!

If you're using the AppSource version of Zebra BI (version 4.0.0 or higher), then your Zebra BI Charts & Cards will be updated via Microsoft's AppSource marketplace automatically once processed. Please note that Zebra BI Tables 6.0 is a new visual which you need to import from Microsoft's AppSource manually. Expected release dates according to the Microsoft Power BI team:

  • Zebra BI Cards 1.3: September 21, 2022
  • Zebra BI Tables 6.0: September 21, 2022
  • Zebra BI Charts 6.0: September 21, 2022

If you're using an older (private) version of Zebra BI (e.g. 3.x.x or older), then this is a perfect opportunity to update your Zebra BI! When ready, just shoot us an email at support@zebra.bi and we'll help you migrate to the latest version.

Haven't tried Zebra BI before? Opt-in for our 30-day free Pro trial here:

Start Your 30-Day Free Pro Trial