 September 8th
 February 22nd

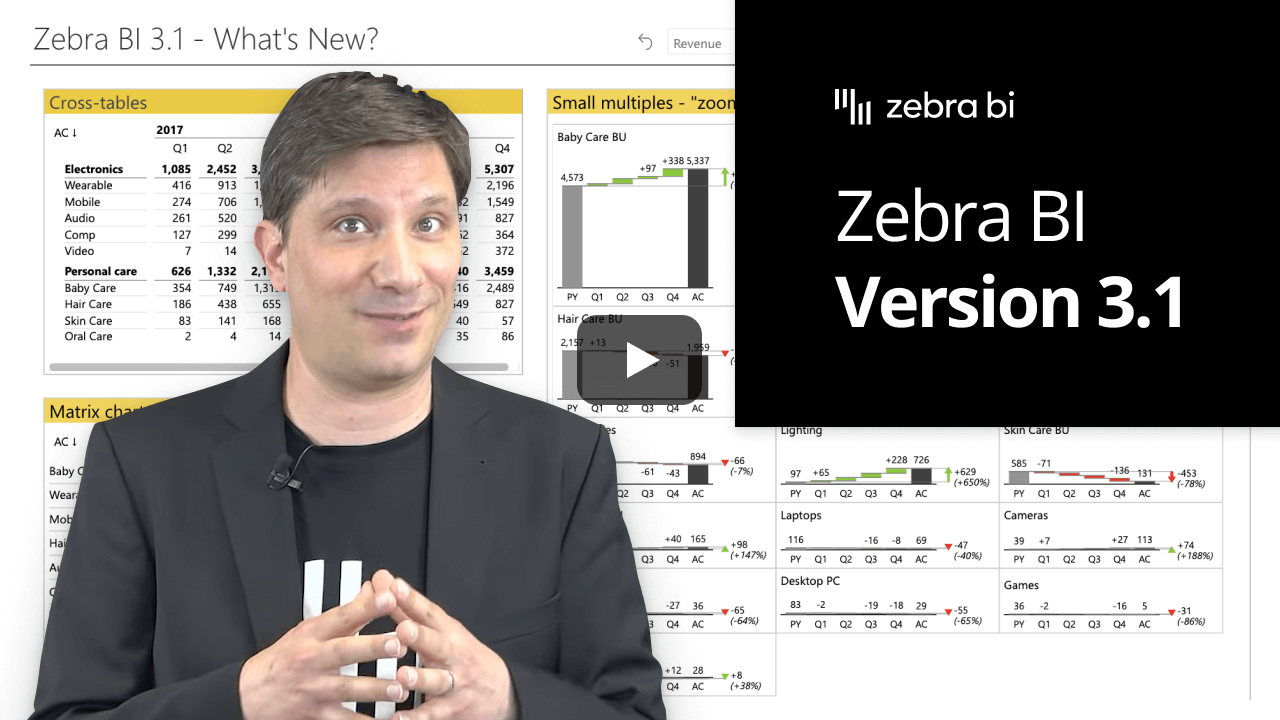
Zebra BI for Power BI version 3.1 is packed with new and improved features that will help you create even better reports and dashboards in Power BI.
One of the features most sought-after by our clients and users of our visuals are the cross-tables. You can now create cross-tables, time-tables, and P&L tables with multiple business units and across multiple years.
Another great new feature are the matrix charts, an exciting new way to visualize your data and gain additional insight. The new version also brings further refinement to our small multiples concept. Essentially, we put them on steroids and they now allow you to zoom into a single chart, resize it, drag the mouse just once to display the entire matrix of small multiples available, etc.
In short, the new version brings a lot of significant improvements. Please, take your time and watch the brief video presentation of everything we’ve prepared for you.
Enjoy. 😊
If you're using an older version of Zebra BI, then this might be a perfect opportunity to update your Zebra BI! When ready, just shoot us an email at support@zebra.bi and we'll help you migrate to the latest version.
Haven't tried Zebra BI before? Opt in for our 30-day free trial here: