IBCS® Certified
PBI Certified

Zebra BI for Power BI – 4.3 Update

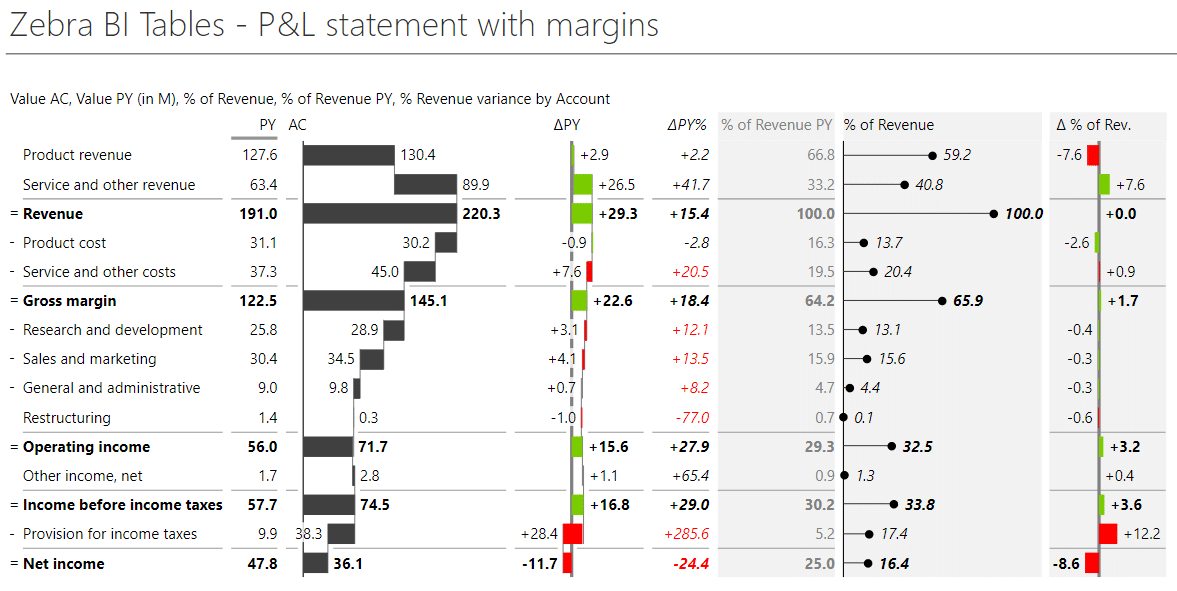
With 43 new features, improvements and bug fixes the 4.3 Update of Zebra BI visuals for Power BI is one of the most advanced so far. By far. With two major features such as a powerful algorithm for rendering small multiples and a possibility to organize multiple table columns into scaled groups, as well as more control over the design and behavior of both visuals, and many other improvements, we’re further empowering you to unlock actionable insights from your data.

Get the PBIX file

Download the demo PBIX file that contains all the latest features illustrated with many practical examples.
Download PBIX

Watch the Video

Watch the video below for a quick and practical overview of all major NEW features & updates:
(0:15) Intro to 4.3 release
(0:53) New algorithm for small multiples
(3:30) Up to 20 additional columns with full design options
(17:43) Controlling the gap between columns
Share
Share
Share

Interact with Zebra BI for Power BI 4.3 👇

Play with our interactive example to get inspired and see all the new features in action. 
Tip: Make sure you put the interactive report in the full-screen mode (⤢) and check out all the pages by pressing the navigation arrows.

So, what’s new? 🎉

Zebra BI Tables (version 4.4)

There are many new functionalities in Zebra BI Tables visuals, from the ability to visualize additional up to 20 columns to the whole new concept of Scaled groups within your tables and much more! Keep scrolling to see all of them, along with practical examples.

Display any of your additional measures as charts

If you freeze a first column or row headers, it locks them into place. This is very practical for use with data-heavy spreadsheets, where you can freeze header row to make it easier to read your data.

Select the type of your measure

You can select the type of your measure to ensure the most appropriate display or visualization of each column.

New concept of scaled group

Here's the story. Since additional measures in tables are often showing KPIs that are unrelated to other KPIs in the same visual, you can decide how they should be scaled by adding them to separate Scaled groups.

In the following example, the Gross profit is being scaled to the Gross Profit variance, completely independently of the Sales measures (AC, PY, PL).

As you may have noticed, the above table has two groups of measures that are being scaled (the Sales measures and the Gross profit measures). You can set up up to 6 scaled groups in this way.

Here's another example to get inspired.

Why not visualize the common size measures (e.g. margins, calculated as % of Revenue) to your Income statements or P&Ls?

The picture below shows a P&L statement with margins, where a ‘% of Revenue’ measure is visualized as a pin chart and also its change/variance from PY is calculated in percentage points and visualized (the red/green column on the far right):

Increased number of additional measures

To give you even more space to go wild with Zebra BI Tables, we have increased the number of additional measures to 20!

Also, you can now set the number format for any individual column in your Zebra BI Table. Simply set the units or decimals directly on any column like this:

Added tooltips for truncated categories

Sometimes you need to save space, so you decide to truncate the names of categories. We respect that and have improved the user experience for this case by adding a tooltip that displays the full name of the category when a user moves his mouse over the truncated name.

Added "Gap between columns (%)" setting

We also included "Gap between columns (%)" setting, which controls the amount of gap between columns.

Zebra BI Charts (version 4.4)

Advanced small multiples in Zebra BI Charts

New automatic layout in small multiples

Since reporting space is always very precious, we used a scientific method to find a way to save it. Our team developed a powerful new algorithm to optimize the placement of charts within one visual!

See on the example how it works.

In older versions of Zebra BI, a big chart could already span over two smaller charts. Now, however, it can span over multiple charts, as many as can fit! This spanning of bigger charts can now happen in multiple columns, while before it could only happen once. The exact allocation of space has also been improved, resulting in an extremely optimized display of small multiples where practically no space is wasted.

This feature is especially useful in situations where you have big differences in values between data categories. This is quite often the case, so make sure you check out the improved Auto layout under Small multiples group of settings.

It gets better. The new Auto layout works with all Zebra BI charts and all of their settings.

Check on example how you can change the chart type and set the display of charts to Top N with all other charts automatically aggregated to "Others" category.

Other Improvements

Zebra BI Tables 4.3

  • Added an option to hide the Calculation symbols ("=" and "-"). You can find the setting under "Chart settings -> Show calculation symbols".
  • Improved the detection of outliers.
  • Added the option to set the "Show row subtotals" using Report themes.
  • Added support for "Suppress zeros" and "Suppress nulls" when using multiple group elements and when showing Groups in columns.
  • Added transparent backgrounds to labels on Waterfall charts. The amount of transparency is controlled by going to "Data labels -> Background transparency".
  • Improved the display of tooltips by not showing the elements that were hidden from a particular group.
  • Improved the licensing window by allowing the users to scroll down when the visual has limited space.
  • Improved the display of the layout tooltip, which is now displayed in the middle of the visual. This makes it much easier to see whether we're using the "Chart" or the "Table" layout.
  • Clicking "Save" on the Color picker now closes down the Color picker.

Zebra BI Charts 4.3

  • Improved detection of outliers
  • Improved licensing window by allowing the users to scroll down when the visual has limited space
  • Improved grand total tooltip in case of two segments or all four scenarios
See full changelog

Time to give it a spin!

If you're already using the AppSource version of Zebra BI (version 4.0.0 or higher), then your Zebra BI has already been updated via the Microsoft's AppSource marketplace automatically. You're good to go!

If you're using an older version of Zebra BI (e.g. 3.x.x or older), then this might be a perfect opportunity to update your Zebra BI! When ready, just shoot us an email at support@zebra.bi and we'll help you migrate to the latest version.

Haven't tried Zebra BI before? Opt in for our 30-day free trial here:

Start Your 30-Day Free Pro Trial