Master cost management with Zebra BI. Discover advanced techniques to optimize financial reporting, enhance budgeting accuracy, and make smarter, data-driven business decisions for long-term success.
Optimize your Food & Beverage business with our Financial Analysis and Benchmarking Report Dashboard Template. Perfect for executives and financial analysts, it evaluates KPIs such as Inventory Turnover and Return on Assets to drive strategic growth, operational efficiency, and market competitiveness.
Discover how to calculate percentages in Power BI using DAX formulas. Our in-depth guide walks you through multiple methods for calculating and visualizing percentages to improve your data analysis skills.
Learn how to add rows in Power BI with our step-by-step guide. Explore different methods, including using DAX and Power Query, to efficiently manage and enhance your data for better analysis.
Discover how to hide columns in Power BI visuals with our comprehensive guide. Learn multiple techniques for managing and customizing your data display to create cleaner, more focused reports and dashboards.
Learn how to sort columns in a matrix in Power BI with our detailed guide. Explore various sorting techniques to organize your data effectively, ensuring your reports are clear, informative, and user-friendly.
Discover how to add icons in Power BI with our step-by-step guide. Enhance your reports by incorporating custom icons to improve visual appeal and communicate data insights more effectively.
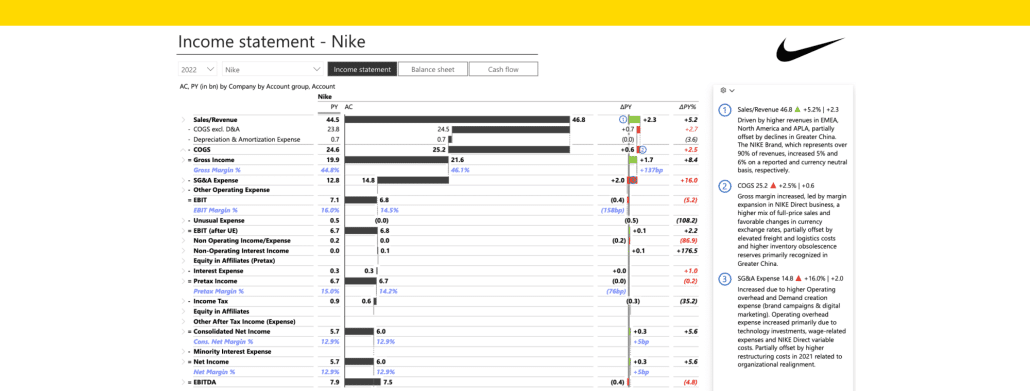
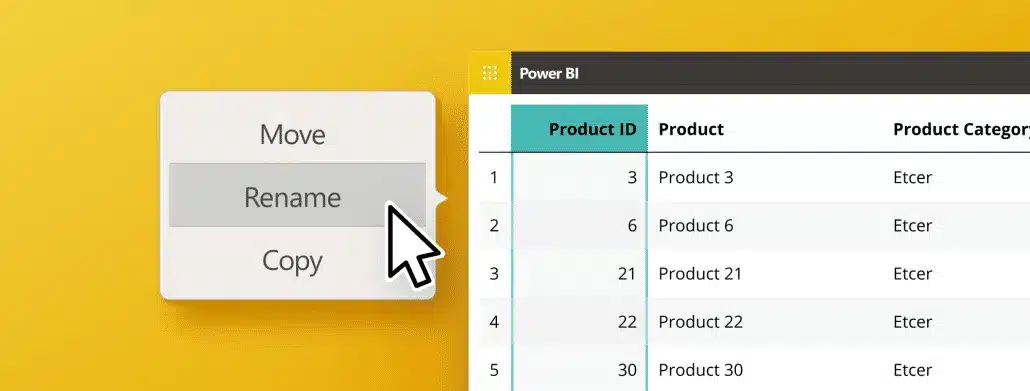
Learn how to change column names in a Power BI table visual with our comprehensive guide. Explore different methods to customize your data presentation and improve clarity in your reports and dashboards.
 September 8th
 February 22nd
 05 Mar 2026