Discover how to convert text to date in Power BI with our detailed guide. Follow step-by-step instructions to transform your data types effectively, ensuring accurate analysis and reporting in your dashboards.
Discover how to delete a row in Power BI with our in-depth guide. Explore multiple methods to efficiently manage your data, ensuring your reports are accurate, relevant, and tailored for effective analysis and visualization.
Learn how to add a new table in Power BI with our comprehensive guide. Explore various methods, including using DAX and Power Query, to effectively manage your data and enhance your reports for better analysis.
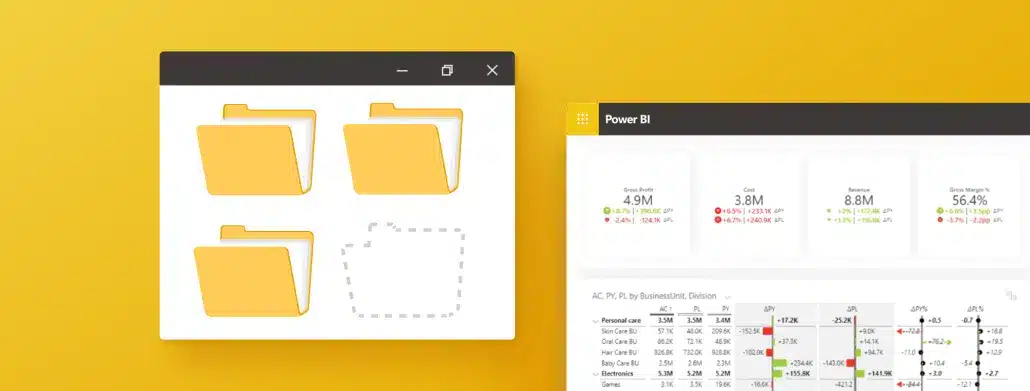
Discover how to create a folder in Power BI with our detailed guide. Learn the steps to organize your reports and data models efficiently, improving navigation and management within your Power BI workspace.
Learn how to concatenate two columns in Power BI with our comprehensive guide. Explore different methods using DAX and Power Query to combine data effectively, enhancing your reports and improving data analysis.
Discover how to get rid of the date hierarchy in Power BI with our detailed guide. Follow step-by-step instructions to customize your date fields, ensuring your reports are tailored for better data analysis and visualization.
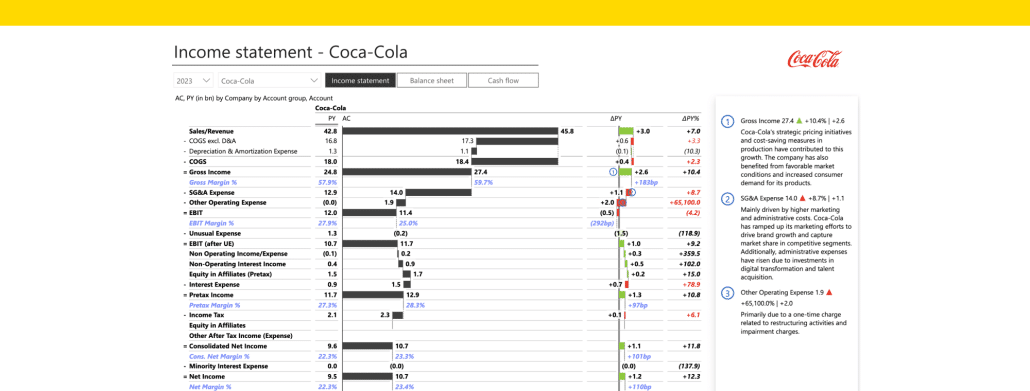
Optimize your Food & Beverage business with our Financial Analysis and Benchmarking Report Dashboard Template. Perfect for executives and financial analysts, it evaluates KPIs such as Inventory Turnover and Return on Assets to drive strategic growth, operational efficiency, and market competitiveness.
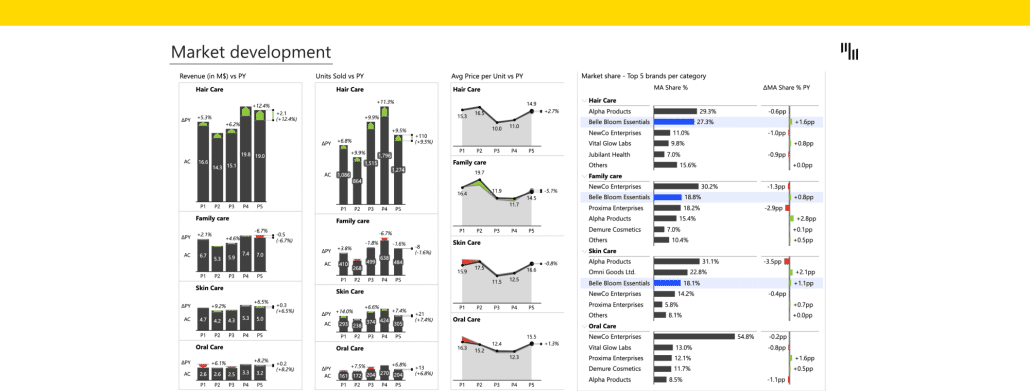
Optimize your FMCG brand's performance with our Brand and Product Portfolio Analysis Dashboard. Perfect for executives and planners, it assesses revenue, market share, and units sold to drive strategic growth and market competitiveness.
 September 8th
 February 22nd
 05 Mar 2026