Cost Variance Table in Excel (PY-AC-FC-PL)
Zebra BI for Excel
Overview
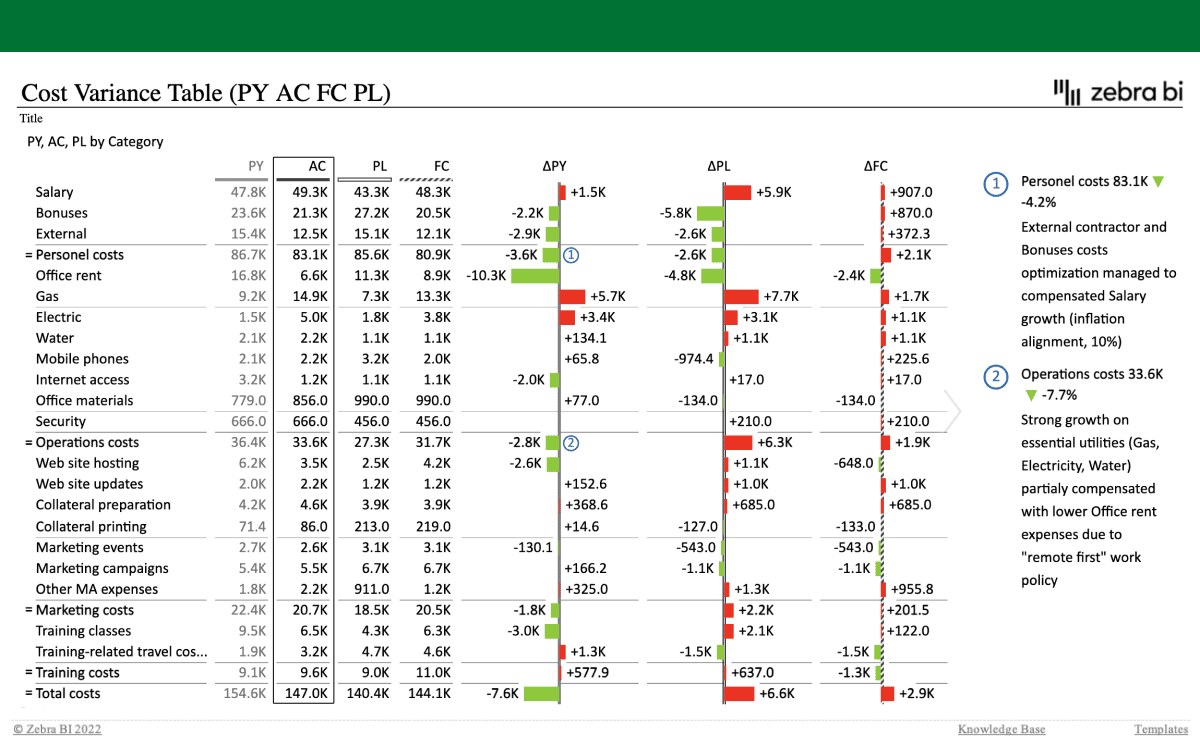
Next-level visualization of different costs with three comparison measures: the previous year (PY), forecast (FC) and plan (PL). Use Zebra BI custom calculations, grand total, dynamic comments, and other advanced features to get your message across.
Get started in 3 steps
1
Download & Open
Download the .xls file and open it in Excel
2
Connect Your Data
Replace sample data with your CRM, ERP, or database source
3
Customize & Publish
Adjust KPIs, colors, and branding, then publish to Power BI Service
Fill out the form and get the Excel template
20,000+ users have downloaded this template


