Hospital Occupancy Rates Excel Template
Overview
Healthcare management includes occupancy rates by location analysis. It offers a deep understanding of resource utilization and patient admission trends, serving as a foundation for informed decision-making. Our Occupancy Rates Excel Template equips healthcare analysts and operations managers with a comprehensive tool for conducting detailed occupancy rate analyses effortlessly.
What is the Occupancy Rates by Location Analysis and Why is it Important?
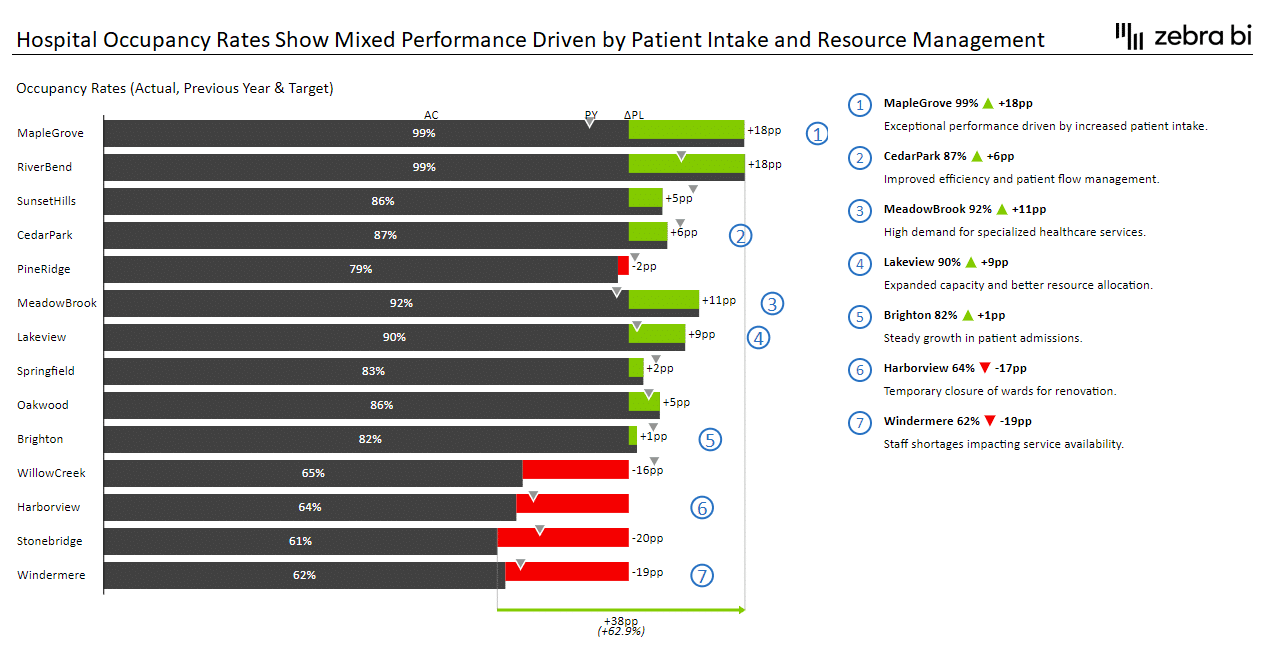
Occupancy rates by location analysis measure the percentage of occupied beds or spaces in each hospital or healthcare facility. This analysis is crucial for understanding resource utilization, identifying trends in patient admissions, and optimizing the allocation of beds and staff across different locations.
How and When is it Used, What is the Frequency?
Analysis is used for operational management, capacity planning, and strategic decision-making. It is typically conducted monthly or quarterly to provide up-to-date insights into occupancy trends and resource utilization.
Who Prepares It?
Healthcare analysts, operations managers, and data analysts prepare occupancy rates by analyzing location. They gather data from various hospital management systems, ensuring accuracy and relevance for strategic planning.
Who Reads It?
The primary readers include hospital administrators, C-level executives, operations managers, and strategic planners. These stakeholders use the analysis to make informed decisions about resource allocation, capacity planning, and operational efficiency.
What is Important in Visualizing It and Why
Scaling: Consistent scaling ensures stakeholders can easily compare occupancy rates across different locations. This helps quickly identify which locations are underutilized or over-utilized.
Variances: Highlighting variances from previous periods or targets helps understand trends and deviations. This facilitates quick identification of areas needing attention or intervention.
Standardized Formatting: Standardized formatting enhances readability and ensures consistency across reports. This makes it easier for stakeholders to interpret the data and make comparisons.
Integrated Comments: Providing contextual explanations and comments adds depth to the analysis. This transforms raw data into actionable insights, helping stakeholders understand the reasons behind the numbers and make informed decisions.


