Sales Funnel Power BI Template


Overview
Who is this template for?
This sales funnel dashboard Power BI template is designed for sales managers, finance professionals, business analysts, controllers, and FP&A teams who want to leverage Power BI to analyze and explain changes in revenue. The example of sales pipeline dashboard we created is especially valuable for:
- Sales teams and sales managers aiming to monitor pipeline health and sales goals performance metrics, for adjustments to the sales strategy and potential sales forecasts
- Marketing managers seeking valuable insights to align efforts with sales outcomes
- Revenue operations (RevOps) professionals analyzing funnel conversions and other sales KPIs
- Executives & business leaders who want a bird’s-eye view of revenue opportunities
- CRM and analytics teams optimizing lead-to-revenue journeys
Perfect for B2B companies, SaaS businesses, and sales-driven organizations across industries.
What is a sales funnel dashboard in Power BI?
A Power BI sales funnel dashboard visualizes each stage of your sales process—such as lead generation, qualification, proposal, and closed deals—so you can identify bottlenecks and optimize conversion.
What business insights will it give you?
This Power BI Sales funnel dashboard helps sales managers answer critical business questions such as:
- Where are we losing potential revenue in the funnel?
- Which sales stages have the lowest conversion rates?
- Is our marketing and sales activity generating enough leads to meet our revenue goals?
- Which customer or product segments are driving or hindering performance?
- How are actuals tracking against plans and forecasts?
With these insights, you can:
- Optimize conversion rates at each stage of the funnel
- Identify underperforming segments or stages to prioritize improvements
- Track performance against sales targets in real-time
- Refine sales and marketing strategies based on data
- Improve forecast accuracy using actual vs. plan variance analysis
Benefits of using our template
This Power BI sales funnel template is designed to apply best practices in data visualization right out of the box.
It was designed to help teams:
- Visualize the full sales pipeline in a clean, structured way
- Spot underperforming areas with automated variance indicators
- Standardize reporting using IBCS-compliant visuals
- Streamline decision-making by turning raw CRM data into actionable insights
- Communicate complex variance analyses clearly and efficiently
- Use visual storytelling to make reports understandable at a glance
- Avoid complicated DAX measures or manual chart tweaking
- Build waterfall charts, charts with integrated variances and tables with integrated charts with just a few clicks using Zebra BI visuals
Whether you’re reporting to sales executives or diving into detailed analysis, this kind of report ensures your message is crystal clear—and your data actually drives decisions.
Zebra BI charts, tables or cards used:
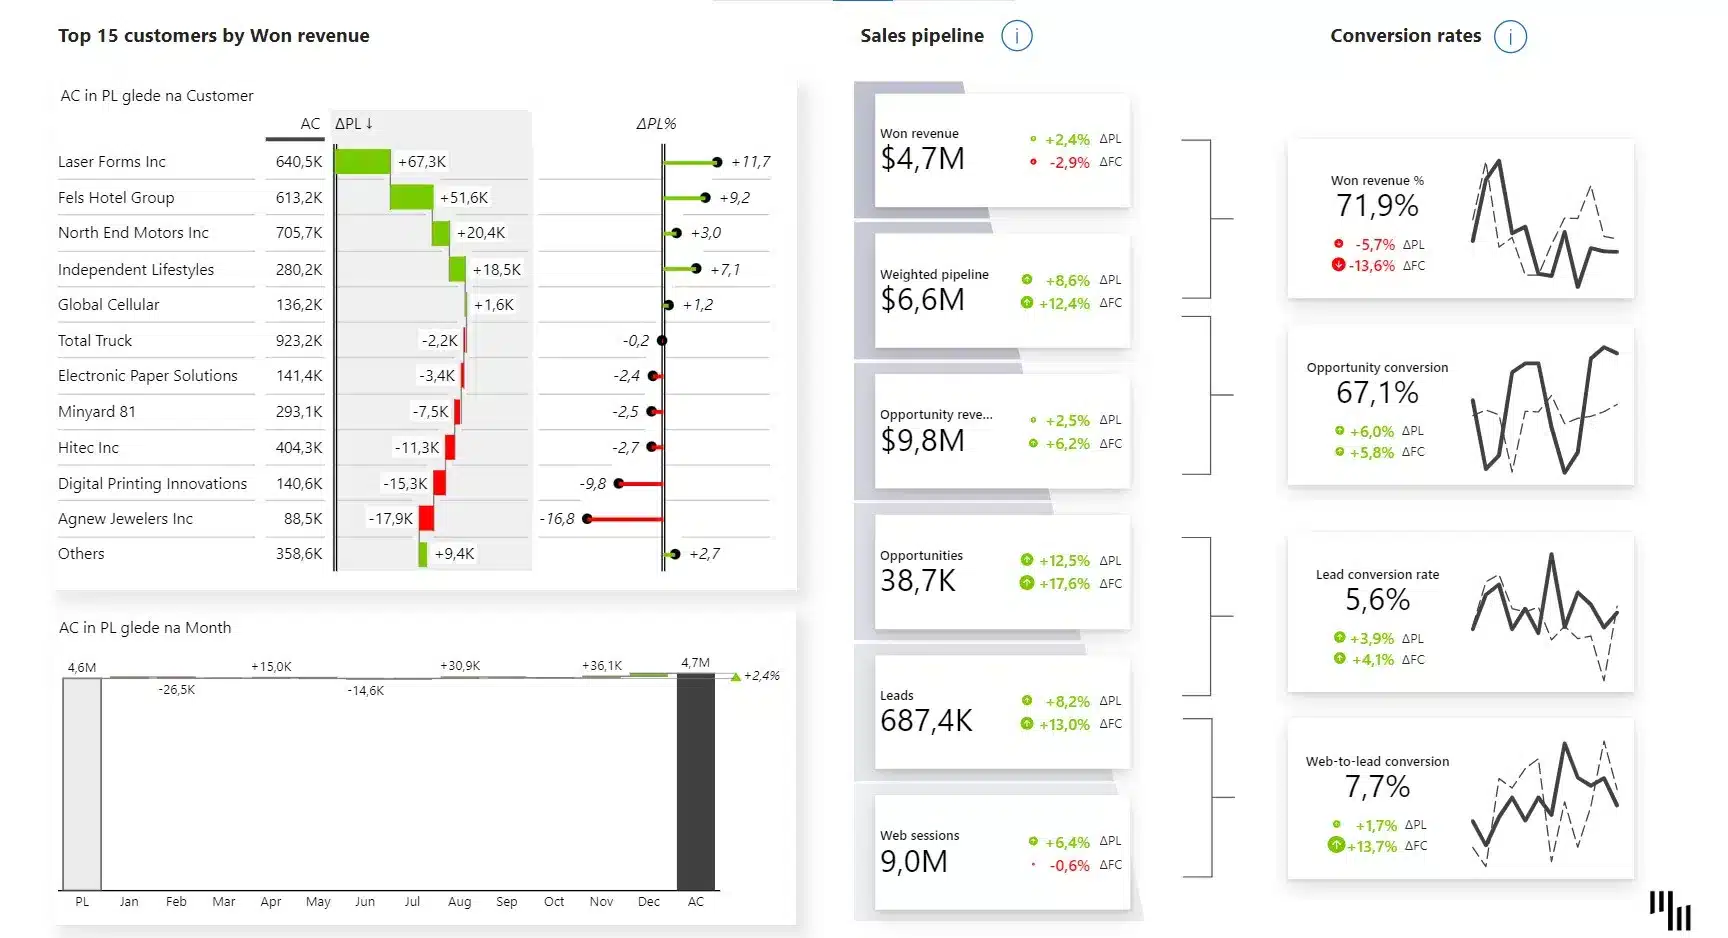
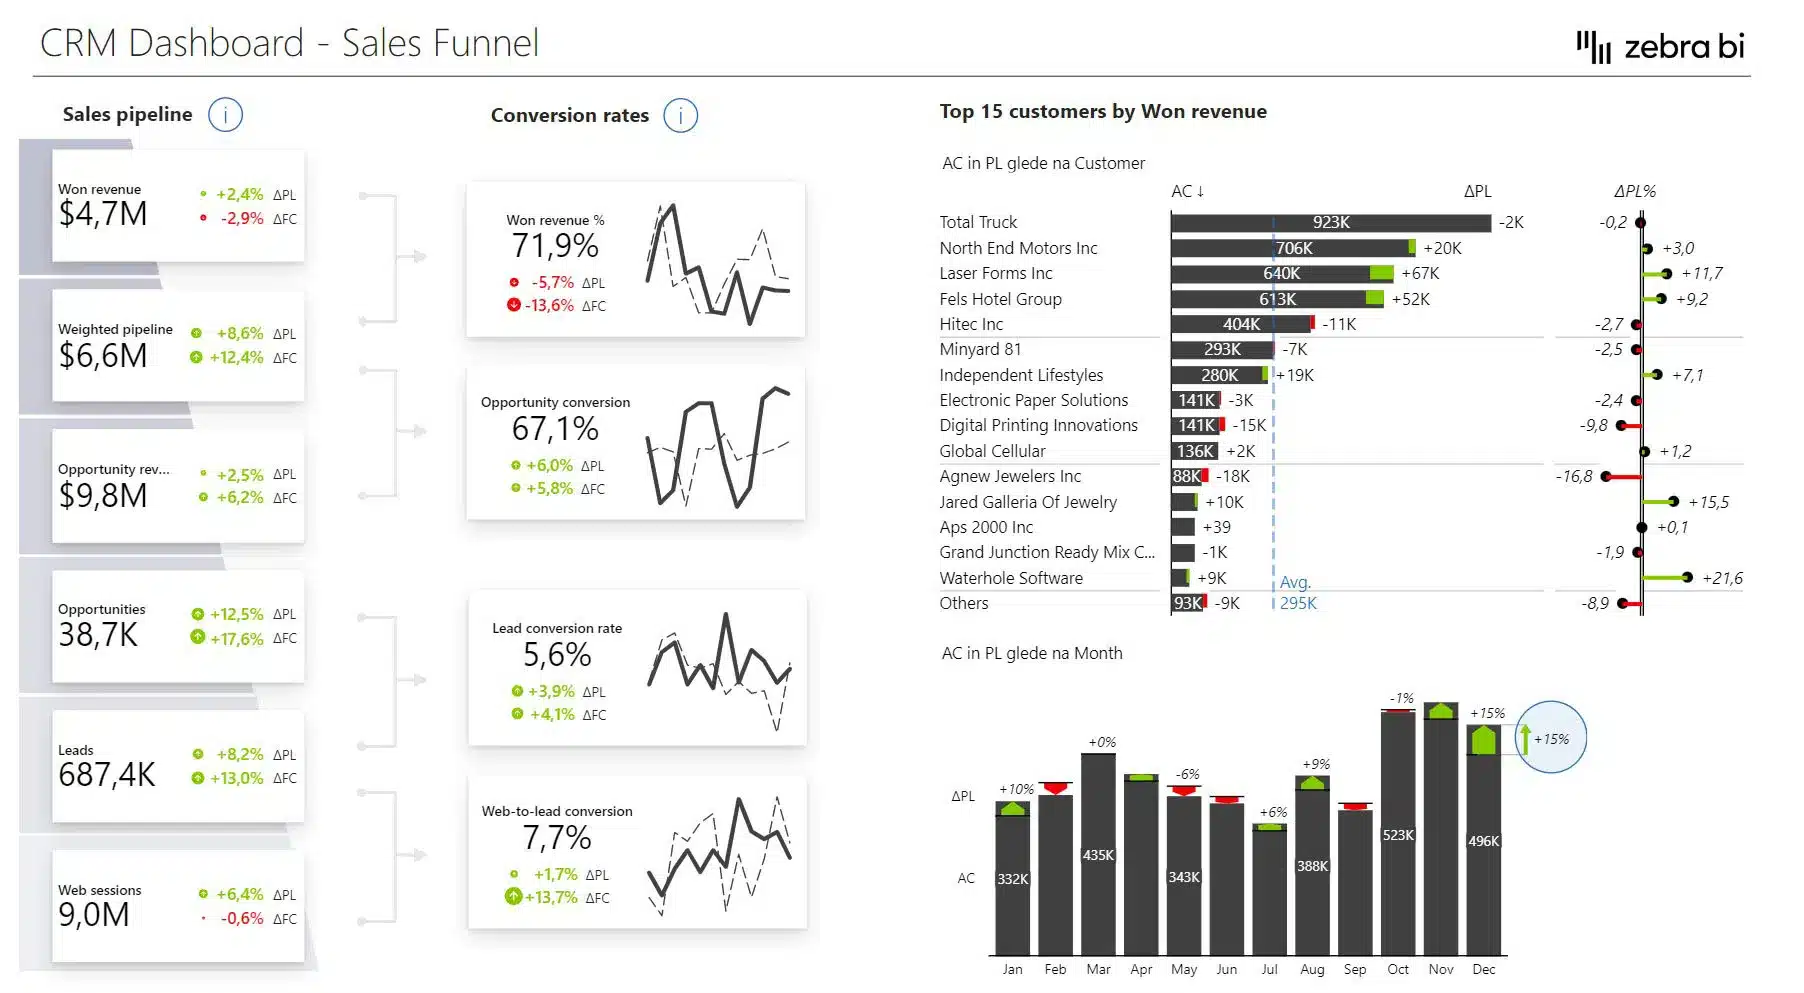
We've packed this Power BI dashboard with charts, tables, and cards that help your sales team and sales leaders provide an accurate, easy to understand visual representation of the sales process and dashboard metrics that promote data-driven decisions.
Here are some of the essential elements this Power BI sales pipeline dashboard comes with:
Zebra BI Charts
- Create waterfall and column charts to display monthly sales performance, variances, and trends
- Instantly spot seasonal patterns to improve sales team performance
- Highlight positive and negative impacts across the funnel for fast decision-making
Zebra BI Tables
- Combine tabular data with integrated variance charts to compare actuals vs. plans by segment
- Instantly detect performance gaps
- View top-performing or underperforming product groups and customers
Zebra BI Cards
- Use cards to display key KPIs for each funnel stage, along with charts inside of the card out-of-the-box
- Automatically calculate variances against plans and forecasts of conversion rates
- Apply IBCS-compliant formatting for consistent communication
Why is Zebra BI’s template the right choice for you?
All Zebra BI templates are designed using IBCS® principles and real-world reporting experience. They help you build professional reports faster, reduce manual work, and ensure your insights are clear, consistent, and actionable — every time.
How it works
Getting started is quick and easy — even if you’re not a Power BI expert. Next steps:
- Download this power bi template/example to find best practices and inspiration for actionable reporting techniques.
- Use sample data to test it out and checks what is the background to find application to your use cases.
- Use free trial or and other Zebra BI plan to create PVM analysis reports with Zebra BI visuals on your own data.
Inside this template
Get started in 3 steps
Fill out the form and get the Power BI template