Working Capital in Power BI
Zebra BI for Power BI

Overview
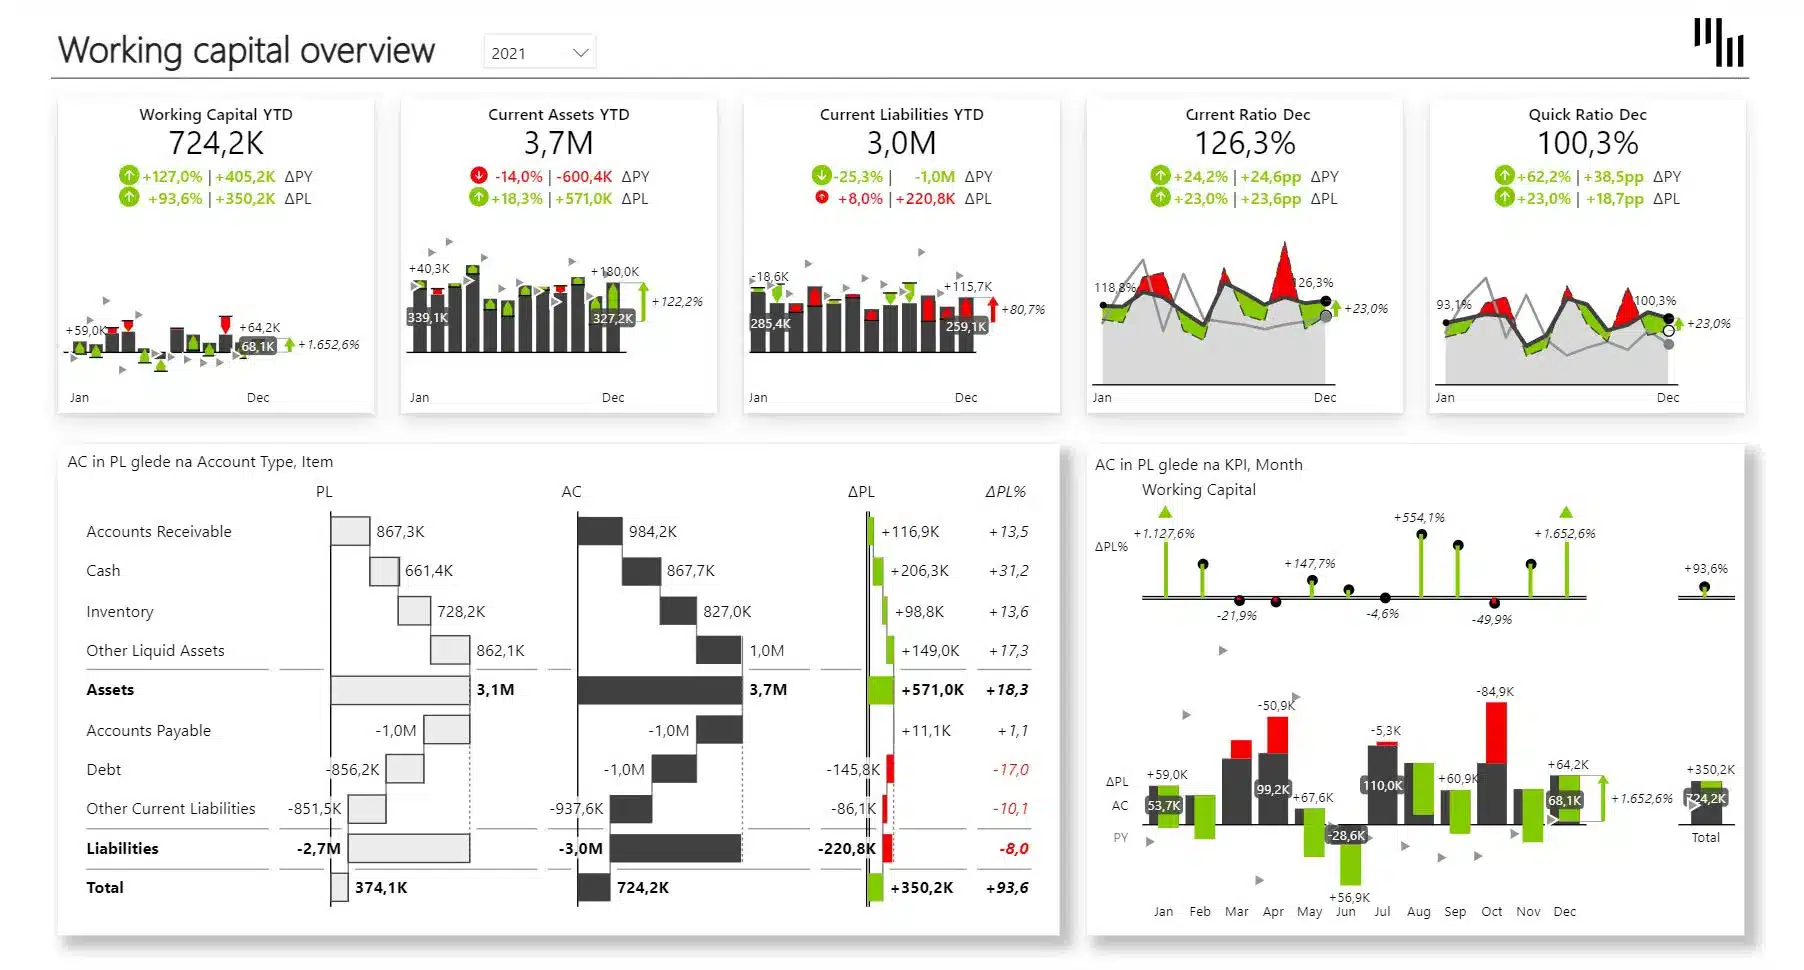
The Working Capital template for Power BI allows you to have a clear overview of the Current Assets, Current Liabilities and the difference between them - Working Capital. You can understand the balance sheet at a glance (visualized with vertical waterfall charts) and analyze the trends of each KPI.
Play with the interactive demo below. If you click the ⤢ icon at the bottom-right of the report page you'll be able to enjoy the full-screen view.
Get started in 3 steps
1
Download & Open
Download the .pbix file and open it in Power BI Desktop
2
Connect Your Data
Replace sample data with your CRM, ERP, or database source
3
Customize & Publish
Adjust KPIs, colors, and branding, then publish to Power BI Service
Fill out the form and get the Power BI template
20,000+ users have downloaded this template