 September 8th
 February 22nd
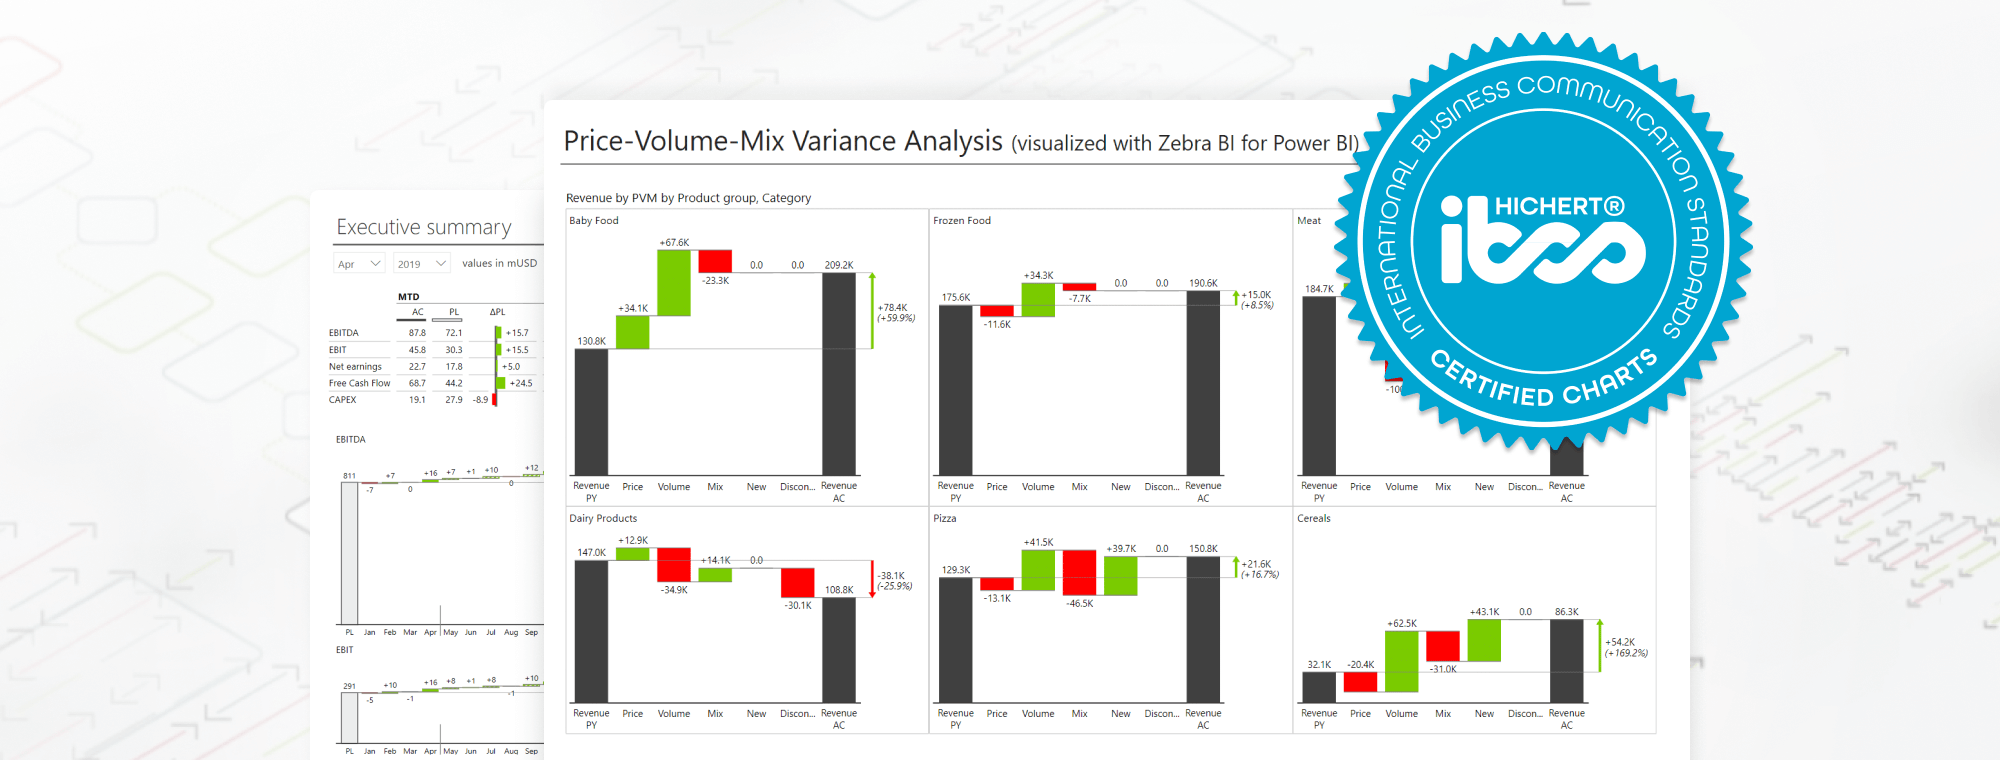
Zebra BI visuals re-certified by IBCS
Exciting news: Zebra BI visuals have been re-certified by the IBCS.
They successfully passed the examination in accordance with the provisions of the IBCS® software re-certification process, which means you can continue using our visuals and be confident that they comply with the highest standards of business reporting. The certification has been re-issued for both Excel and Power BI visuals.
IBCS standards in your Power BI
Both Zebra BI Visuals for Power BI, Charts and Tables, have successfully passed the examination in accordance with the provisions of the IBCS® software re-certification process in August 2020. All features that came out before or along with the update 4.2.0 have therefore been recognized to be in compliance with the Standards proposed by the IBCS Association.
With this update you can:
- Show up to 4 scenarios in a single Tables visual, together with 3 comparisons between them.
- Highlight individual bars and columns.
- Manually determine the gap between bars and axis density. This is especially helpful when the visual contains many elements, since the labels can start to overlap.
- Change the opacity of variance areas.
You can check out more certified features in the interactive dashboard below:
Zebra BI Visuals for Power BI are the first officially certified IBCS® tool for Power BI, certified in June 2018. With fully responsive and interactive technology they allow you to build spectacular Power BI reports and dashboards in minutes.
Still Excelling – Five years of IBCS certification for Zebra BI Excel
Our visuals for Microsoft Excel have also been newly certified. Zebra BI for Excel, version 2.3, has passed the examination in accordance with the provisions of the IBCS® software re-certification process. Zebra BI for Excel initially was certified in June 2015. So on this special 5th anniversary, we are glad to be once more confirmed as business-fit visuals.
Zebra BI Excel add-in uses a built-in semantic layer to recognize financial data within Excel and automatically convert it to IBCS®-compliant visualizations. Financial reports become crystal clear to all levels of management in real working conditions, where reader’s available attention is limited.
Zebra BI allows users to communicate actionable data, no matter if you use Excel or Power BI.
What is IBCS?
The International Business Communication Standards (IBCS) are practical proposals for the design of business communication. The suggestion of the IBCS association is to use the same expressions and the same visualizations for the same content. In order for a software tool to be officially accepted as being able to create IBCS compliant reports, the IBCS Association offers a certification process. The software must pass strict testing procedures to ensure the charts created and reports produced are in line with the IBCS specifications.
IBCS certification process is carried out by BARC, the independent research and consulting institute for business software. The examination is carried out in two stages: compliance with IBCS® and ease of use. In the first stage, software providers need to show the required level of compliance between visuals delivered by their software and the required standard as prescribed by IBCS®. In the second stage, the software is evaluated in terms of how easy it makes creating new templates from scratch without programming and using default features.
Want to try it?
Zebra BI visuals aren't only recommended by IBCS, but by Microsoft as well.
You can try Zebra BI visuals for Power BI with all features for free, for a whole month. Sign up and immediately start using both, Zebra BI Tables and Charts, with their full functionalities.

