 September 8th
 February 22nd
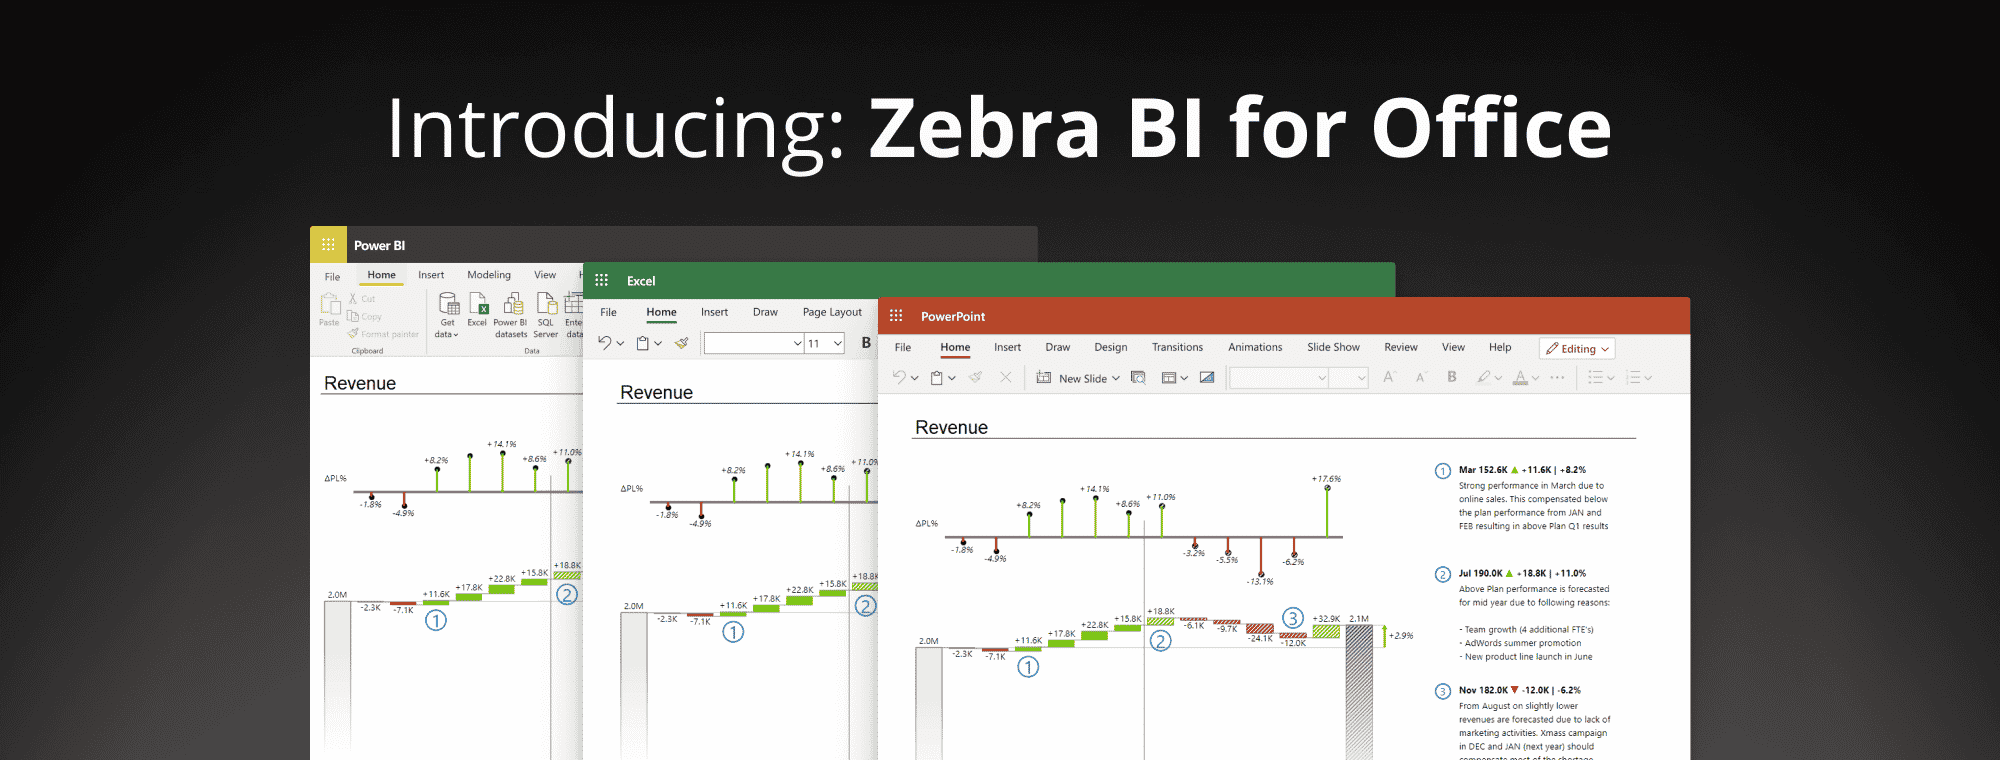
Zebra BI presents Zebra BI for Office: a game-changer for modern reporting
The all-new Zebra BI for Office is finally launched! And it's bringing your reports up to speed with the latest best practices of modern reporting. The brand-new software enables users across organizations to have immediate access to and understanding of the key business insights and empowers them to create & present advanced report visualizations in Excel and PowerPoint with just 1 single click.
You’ve got that right.
Gone are the days when every single report looked like an entirely different story, requiring you to almost use a manual to be able to create it (and understand it). Gone are the days when everyone made their own local report copies, resulting in nothing but confusion. The all-new Zebra BI for Office enables you to have a single source of truth across your organization and collaborate on it with your colleagues so that everyone is always up to date with the latest numbers.
But why is all of that so important? Here’s the thing...
We’re seeing 3 key trends across different industries
1. There’s a significant increase in online collaboration
With an increasing number of companies adopting hybrid workspaces, the need for online collaboration is drastically increasing. This, of course, is also changing the way meetings are done. In fact, there has been a 55% increase in Teams meetings, and the Gartner report predicts that in-person business meetings will drop from 60% to 25% by 2024.
And let’s face it, meetings cost, especially if poorly organized. According to Doodle's 2019 State of Meetings report, the cost of poorly organized meetings in 2019 was estimated to hit a whopping $399 billion in the United States alone. With 61.9% of hiring managers in the US intending to rely more on remote work in the future, this is an alarming piece of information.
2. Analytics are evolving
When it comes to analytics, the trends dictate the move from descriptive analytics (what happened in the past) to predictive analytics (what’s going to happen in a particular period). But the most important type is actually prescriptive analytics (what should a business do, how should it act upon the data once they understand it).
This is what we call actionable reporting and it's all about actual insights instead of just monitoring the data. It's about digging up the relevant insights and acting upon them.
3. BI platforms are being integrated with productivity tools
To make sure they get the absolute most out of their data, businesses today are moving towards integrating BI platforms with productivity tools. In the Microsoft world, this would of course mean a combined use of Power BI and Excel. Why would you want that, you may wonder? It’s quite simple, really. But we’ll get to that a bit further on. For now, let’s just say they enable efficient collaboration.
And efficient collaboration is essential for understanding the data and making data-driven decisions fast, which saves you both time and money.
Excel is still the #1 BI tool
A 2019 market research revealed that roughly 54% of businesses use Microsoft Excel. Even though many are increasingly adopting platforms like Power BI, Excel isn’t going anywhere. Just the opposite, it is gradually getting more and more BI features to meet the market needs and complement Power BI better.
But there’s this one problem
Excel reports that we’re seeing today still look like this:
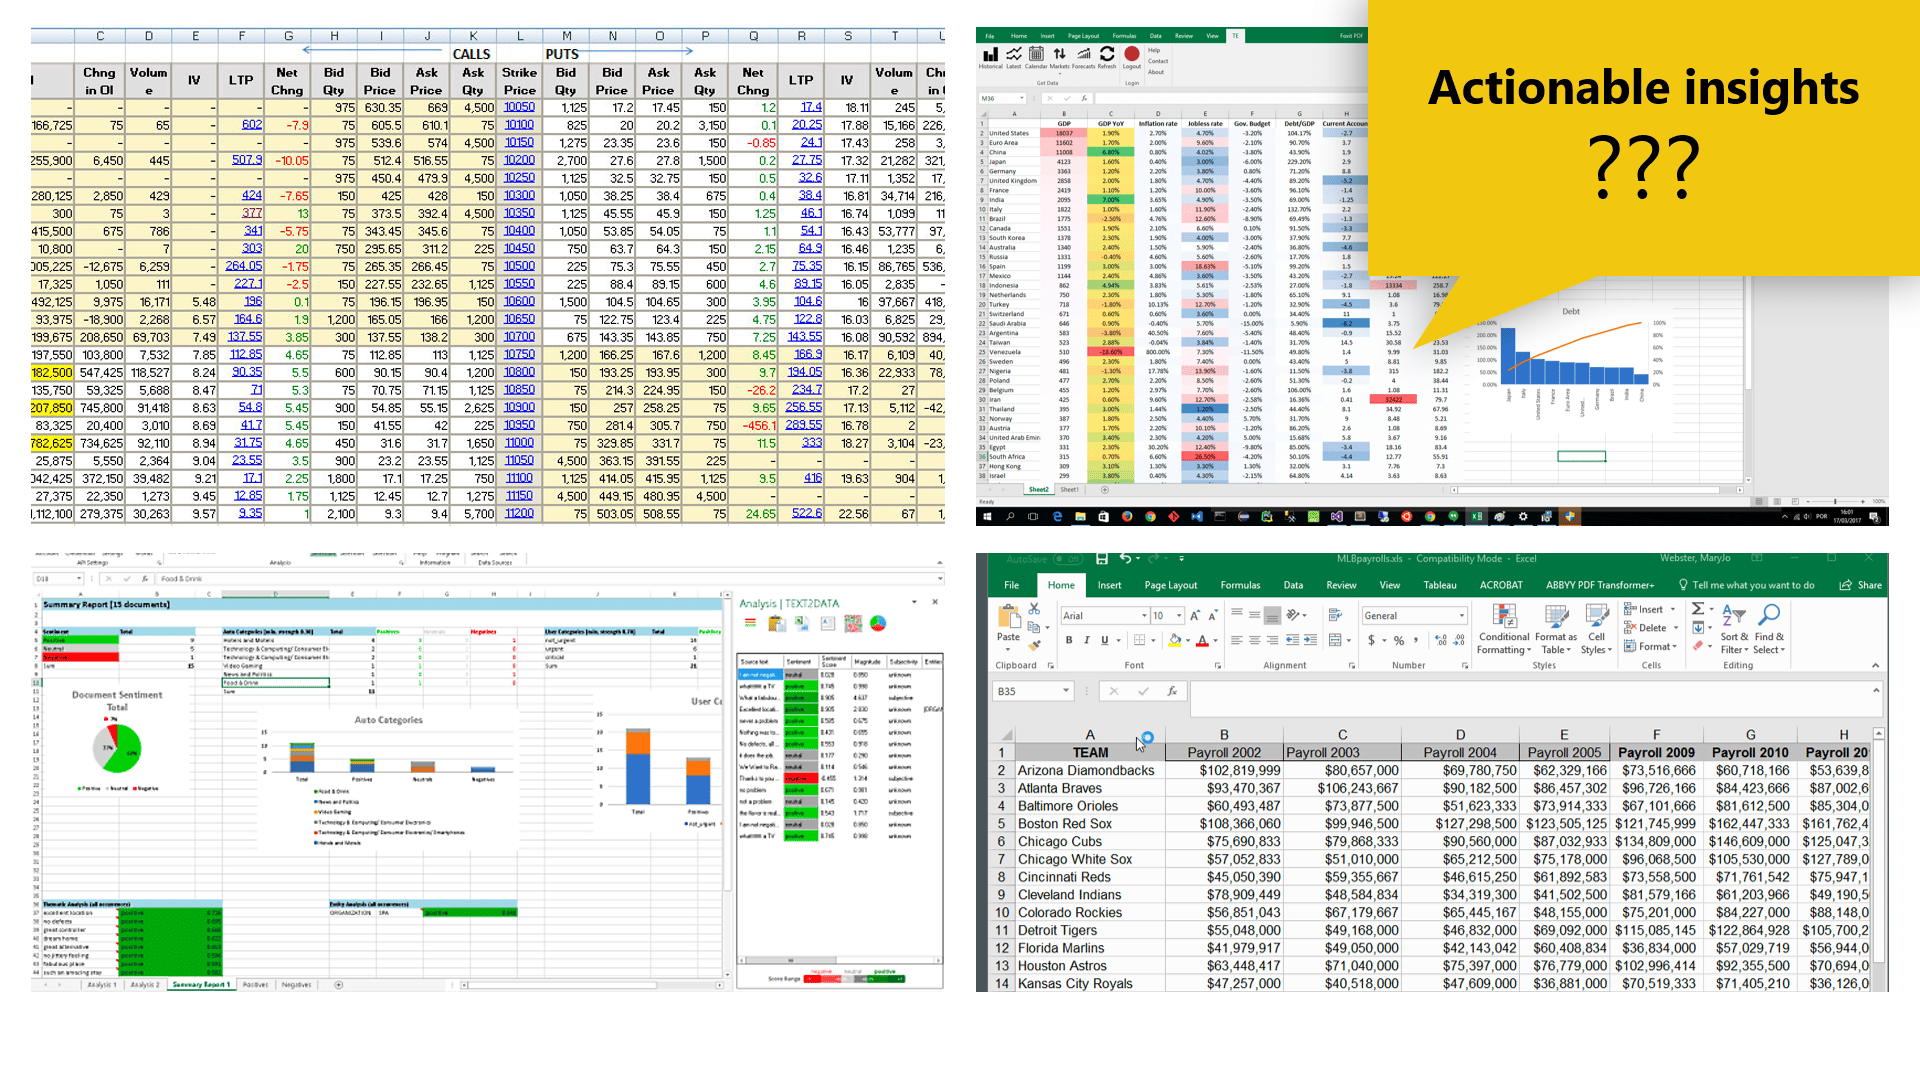
Even within the same company, there are different ways of presenting the data across departments. This often results in confusion and difficulty in understanding, since every report looks different than the rest. Not to mention, all you see are numbers in spreadsheets and a couple of graphs here and there. But where are the actionable insights, where’s prescriptive analytics?
What you need are actionable reports. You need to see your data in context and you need to understand it to be able to act upon it fast. Otherwise, you’re again losing time and money.
That’s exactly where Zebra BI for Office comes in!
Zebra BI for Office enables you to make actionable reports in just 1 click, be it in Excel or PowerPoint. All you have to do is enter your data and voilà, Zebra BI for Office automatically turns your numbers into insights.
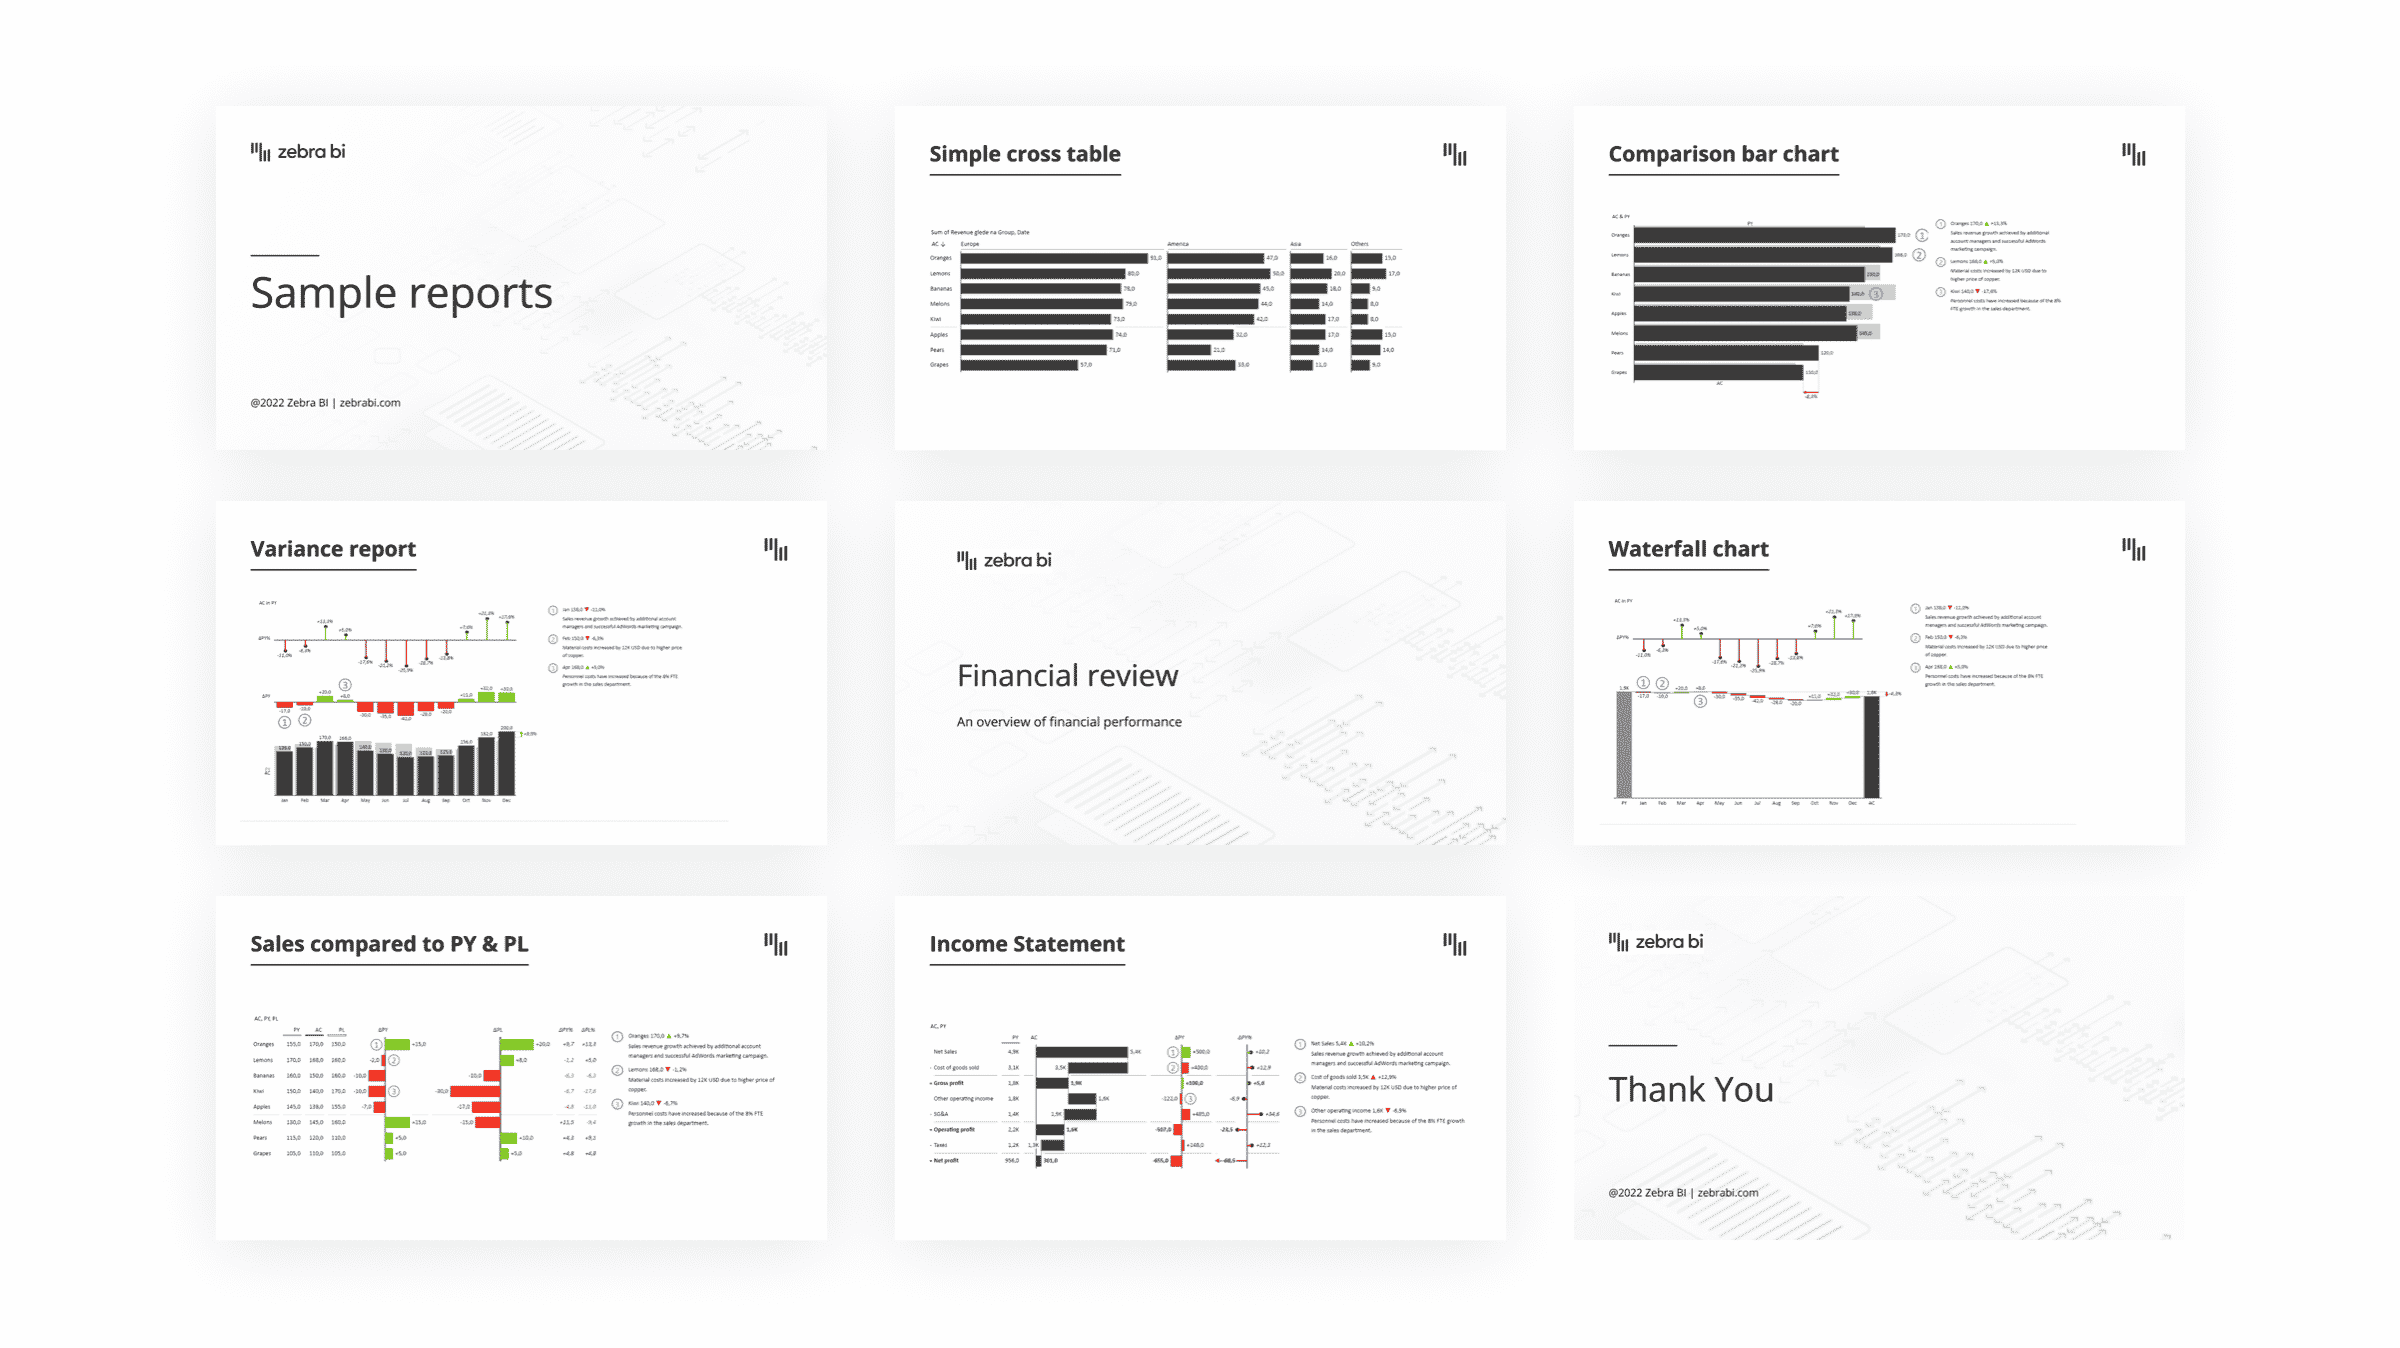
We’re talking advanced reporting and state-of-the-art visualizations
… all produced in just seconds! But don’t take our word for it, have a look at what Excel Guru & Guerrilla Data Analyst Carlos Barboza had to say:
Before, we had to build a chart, make it look good and only then could we start analyzing the numbers. With the new add-in […], with just one click, we get the information right away, we get the context, and then we can take this, and we can make decisions. No more spending time building and hacking Excel to produce the same result!
That's right. It couldn't be simpler.
And it also works splendidly with pivot tables
… whether you create them from your Excel or Power BI dataset (yes, this is also an option!). Once you have your pivots ready, all it takes is for you to insert a Zebra BI Charts or Zebra BI Tables visual – again, you can do this with just 1 click. You can have lots of slicers to filter your data, and everything is completely interactive, so you can drill into it, expand and collapse the columns at will, see all your data in context, and actually turn it into a story.
You can render 200 charts in one single visual from a pivot table – and do it all in under 1 second. The same goes for tables. You can, for instance, create a hierarchical table with a limitless number of levels in your categories and navigate seamlessly between them. The visuals are responsive, which means more info shows when they’re made bigger, while some info integrates into the display when made smaller. A super goal-oriented process with an actionable outcome!
Another HUGE feature is dynamic comments
Doesn’t it bother you to have to memorize all the explanations to communicate them to the managers, constantly worrying something might get lost in translation? Integrated dynamic comments enable you to directly add annotations to the numbers that need further explanation. Having crucial information exactly where needed helps the decision-makers to take the right steps fast.
Bill Jelen from Mr. Excel was especially thrilled with this one:
The thing that absolutely blows me away is [the] ability to add dynamic comments. […] Back when I was an analyst working in an accounting […], my signature thing was to look at [a] report, [establish] the one thing that I wanted [my manager’s manager] to realize, and […] add a comment […]. Well, with Zebra BI, you […] have the ability to add dynamic comments, so as they drill down through the dashboard, your comments […] appear at the right spot. It's just an amazing tool!
When it comes to PowerPoint, dynamic comments take collaborative meetings and sessions to a whole new level. Did your colleague have an excellent point about one specific piece of data? Add it into the visual to keep everyone in the loop.
And there’s more still!
Teamwork makes the dream work – or does it?
We’re kidding, of course it does. But only when you don’t end up with a gazillion different local versions of one original spreadsheet or presentation, leaving everyone confused about what’s what. Think ‘final-final-FINALBUTFORREAL' file names. No more!
Zebra BI for Office allows you to create your Excel reports and PowerPoint presentations on desktop and share them with your colleagues online. This way, everyone is working on the same data, which helps establish a single source of truth across your organization.
Pretty neat, right?
Now, if you’re actually a Power BI advocate, you may think to yourself: “Okay, this is all well and good for Excel users. But how does it concern me?”
Here’s how Zebra BI for Office can help Power BI users
Let’s start with a simple truth. Not everyone knows how to create reports in Power BI. To do that, they’d have to know Power Query data modeling and also Power BI itself. On the other hand, many people are still more familiar with doing reports in Excel and PowerPoint. So here’s the good news ...
The all-new Zebra BI for Office now brings many Power BI functionalities to both Excel and PowerPoint. What’s more, it delivers the exact look and feel of your Power BI reports. But why exactly should you care about this? Two words: mass adoption.
When data is consistently presented in the same way, people across organizations understand and are able to interact with it better. You reach people you wouldn’t be able to with just Power BI, and empower them to become independent report viewers or maybe even designers. You establish a seamless cross-platform experience with incredible pattern recognition. And you establish a single source of truth for the whole company, as users can now connect to the data model from Power BI and visualize it in Excel with just a simple click.
Not only are you saving time and money, you’re also facilitating a potential transition to Power BI, which can help you get more users on board the Power BI express. And that’s another reason why combining Power BI with Excel and PowerPoint can be so cool!
With Zebra BI for Office, we are completing our vision to offer Zebra BI on the three leading BI and productivity platforms: Power BI, Excel and PowerPoint. You can now take advantage of a seamless cross-platform experience and your users can use Zebra BI anywhere, be it in PowerPoint, Excel or Power BI – or just in all three so that everybody in your company can produce actionable reports.
Zebra BI's CEO & Founder Andrej Lapajne
Want to learn more about Zebra BI for Office?
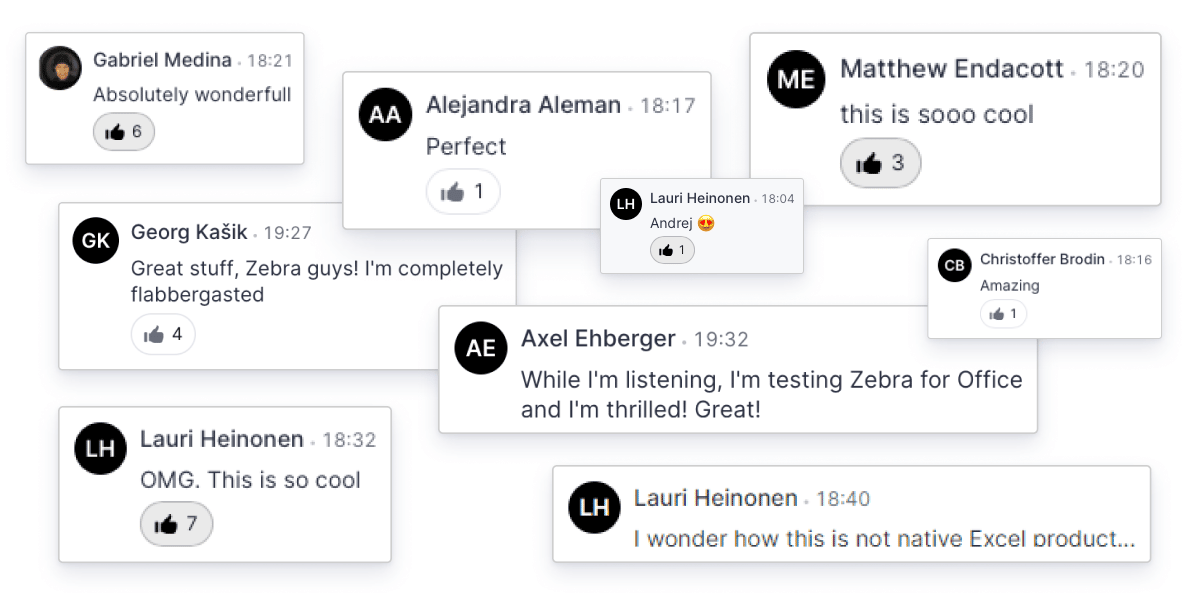
Watch the recording of the big reveal, in which Zebra BI’s CEO and Founder Andrej Lapajne showcases the product and introduces its functionalities in more detail. We really recommend the watch – people were blown away by everything it has to offer!
For some extra inspiration, we've also prepared 20 financial & sales report templates based on the latest best practices. Feel free to download them & make some impressive reports yourself.
Prefer a more hands-on approach? Grab the free version of Zebra BI for Office and explore it yourself.