 September 8th
 February 22nd
Zebra AI for Microsoft Fabric: Bringing the Analyst to Your Data
Featured ahead of FabCon Europe 2025
This September at FabCon Europe 2025 in Vienna, Microsoft will unveil the next stage of its all-in-one data platform: Microsoft Fabric. Fabric brings together everything from data pipelines and storage to governance and analytics under one SaaS umbrella.
For most enterprises, Fabric promises a simple but powerful shift. No more juggling multiple services. Data flows from ingestion to insight in one unified environment.
But there is a question many business leaders ask: “What does Fabric actually mean for me?”
The answer lies in reporting and decision-making. This is where Zebra BI and Zebra AI come into play.
If Fabric is the operating system for data, Zebra AI is the analyst that helps every user make sense of it.
What is Microsoft Fabric and how does it relate to Power BI?
Microsoft Fabric is a unified data platform. It combines services that were once scattered across Azure, such as Synapse, Data Factory, and Data Lake, into a single, integrated SaaS product.
For different roles, Fabric delivers different value:
- Data engineers use it to ingest and prepare data through pipelines.
- Data scientists run advanced models and experiments.
- Business users access and analyze data through Power BI, which is now embedded directly in Fabric.
Think of it like this:
- Fabric = the supermarket (all ingredients in one place)
- Power BI = the kitchen (where meals are prepared)
- Zebra BI = the professional cookware (ensures dishes come out clear, precise, and standardized)
- Zebra AI = the chef (who assembles, explains, and suggests next steps)
By embedding Power BI into Fabric, Microsoft ensures every business user has a familiar entry point to this ecosystem. Partners like Zebra BI extend that value by adding clarity and intelligence.
Why reporting matters in Fabric
Fabric is broad and technical. Many users, such as engineers, architects, and scientists, may never touch a Power BI report. But for executives, controllers, and analysts, the value of Fabric becomes visible mainly in reporting.
Reporting is the front door of Fabric:
- It translates raw data pipelines into clear dashboards and insights.
- It gives leaders answers to three fundamental questions: How well are we doing? What should we focus on? What actions should we take?
- It makes Fabric relevant to business decision-makers, not just IT teams.
- Beyond reporting, Fabric also delivers value through cost savings, streamlined data flows, and the integration of other tools such as Notebooks and Semantic Link Labs—enabling capabilities that were previously out of reach.
- It supports full data translations, easier migrations, automation of repetitive tasks like data cleanup, and stronger governance.
For business and especially C-level leaders, these combined benefits ensure that Fabric is not just an IT platform but a driver of smarter, faster decisions.
This is why the story of Fabric must include both:
- Zebra BI for Power BI: the toolset for building clear, standardized reports.
- Zebra AI for Fabric: the analyst that automates analysis, summaries, and explanations.
Zebra AI for Fabric: Bringing AI to the Data and Reporting
The most exciting part of Zebra BI’s Fabric story is Zebra AI.
Now available in preview as a Fabric workload, Zebra AI brings artificial intelligence directly to governed data stored in Fabric. Instead of exporting or duplicating data, Zebra AI runs where the data already lives.
Who is Zebra AI for?
- Business users in finance, operations, and sales who need insights in plain language
- BI specialists who want to speed up commentary and reduce repetitive work
- Executives who expect summaries and recommendations, not raw numbers
What can it do?
- Upload a dataset as Excel or CSV or connect a dataset from Power BI, OneLake, SQL databases like SQL Server, Snowflake, MySQL, Databricks and more.
- Automatically assemble reports such as a P&L or sales variance overview
- Generate narrative summaries that highlight key changes, explain drivers, and suggest next steps
- Chat with your data
Ask questions like:
- Top 3 regions by sales growth last quarter?
- Why did women’s apparel sales drop in December?
- Compare 2024 vs 2025 revenue by customer segment.
- Show monthly sales trend for the last 3 years.
- Forecast next quarter’s sales if discounts rise by 5%.
Zebra AI Security in Microsoft Fabric
- Today, Zebra AI runs on Zebra BI’s Azure servers, designed to safeguard customer data and maintain privacy.
- In the future, it will support tenant-level deployment, which means a fully isolated AI service inside a customer’s Fabric tenant. This ensures data never leaves their environment.
Zebra BI for Power BI in Fabric
While Zebra AI is the headline Fabric story, Zebra BI visuals remain essential in Power BI.
- For report creators: Fabric provides centralized models and cleaner data pipelines. Zebra BI ensures reports are standardized, compliant, and decision-ready.
- For report viewers: The experience looks the same in Power BI, but with a stronger Fabric-powered data backbone. Zebra BI visuals (Tables, Charts, Cards) turn those reports made from a single source of truth into tools for decisions.
Example Use Cases: How Zebra AI and Zebra BI Work in Microsoft Fabric
- Finance: Generate a P&L in Zebra AI with commentary, or build one in Power BI with Zebra BI for formal management reporting
- Sales: Analyze performance data in Zebra AI to uncover drivers, while building structured dashboards in Power BI
- Operations: Use Zebra AI to surface bottlenecks and next steps, while sharing governed KPIs via Zebra BI in Power BI
Two Ways to Turn Fabric Data into Decisions with Zebra BI
Whether you’re building governed financial reports or exploring data with AI, Zebra BI offers two powerful ways to unlock the full potential of Microsoft Fabric:
- Path A focuses on structured, decision-ready reporting in Power BI with Zebra BI visuals.
- Path B highlights AI-driven sales data analysis and exploration with Zebra AI for Fabric (currently in preview).
Path A: Governed Financial Reporting with Power BI + Zebra BI
- Connect Power BI to a OneLake source (e.g. Fabric Lakehouse or Warehouse)
- Create a Fabric data model with accounts, time, org structure, and scenarios
- Add Zebra BI Tables visual with embedded charts to automatically show subtotals, variances, and hierarchies.
- Add on-visual comments to ensure added context behind the numbers.
- Publish and govern through Fabric Service, with Microsoft Purview providing unified data governance, compliance, and DLP (data loss prevention) across the environment.
Output: a decision-ready P&L report in Power BI, enhanced with Zebra BI visuals
An excerpt from our recent webinar Future-Proof Financial Reporting
Path B: Zebra AI for Fabric (AI-driven analysis)
- Enable Zebra AI workload in Fabric (preview)
- Upload or connect your sales dataset from Fabric Warehouse or Lakehouse.
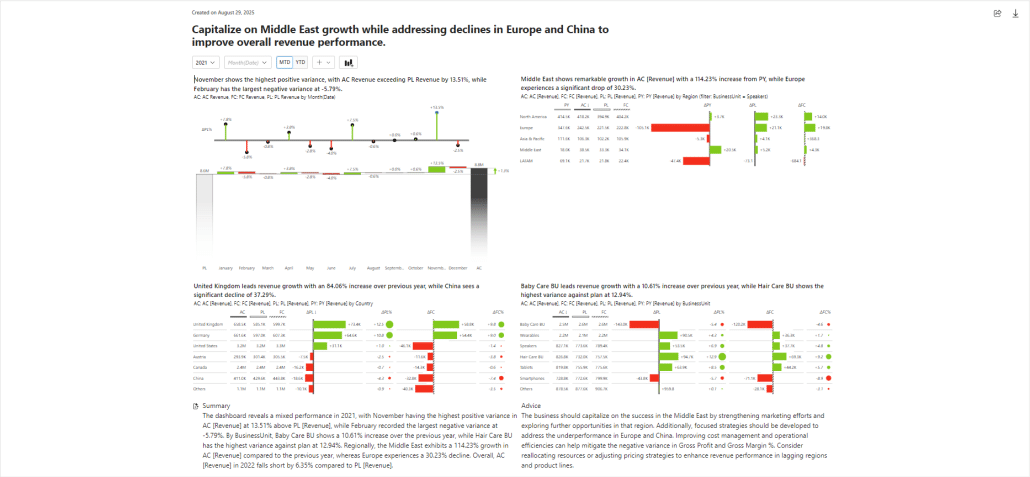
- Zebra AI automatically generates a sales report with summaries, key drivers, and variance explanations.
- Use chat to explore trends and insights, for example: “Show monthly sales trend for the last 3 years.”
Output: An interactive sales performance report in Zebra AI with automated commentary, trend analysis, and conversational exploration.
Conclusion
As Microsoft ushers in a new era with Fabric, organizations need tools that make this platform actionable for business decision-makers.
- Fabric is the foundation
- Power BI is the front-end
- Zebra BI ensures reporting clarity and standards
- Zebra AI is the analyst that lives inside Fabric, turning governed data into automated insights, narratives, and next steps
At FabCon Europe 2025, Microsoft will showcase innovations shaping the future of Fabric. Zebra BI is proud to contribute with Zebra AI for Fabric, currently in preview.
Want to see it in action?
- Meet us at FabCon Europe 2025 to experience how Zebra BI and Zebra AI can transform your financial reporting.
- Prefer a 1:1 conversation? Talk to our sales team to discuss how to turn your Fabric data into faster, smarter decisions.
FAQs about Zebra AI/BI in Microsoft Fabric
How secure is Zebra AI in Fabric?
Today, Zebra AI runs on Zebra BI’s Azure servers, ensuring strong security and compliance. The roadmap includes tenant-level deployment inside each customer’s Fabric environment, meaning data never leaves the tenant. Combined with Microsoft Purview for governance and DLP (data loss prevention), Zebra AI is designed for enterprise-grade security.
Is Fabric replacing Power BI?
No. Microsoft Fabric is a unified data platform that brings together storage, pipelines, governance, and analytics. Power BI remains the reporting and visualization layer inside Fabric. Think of Fabric as the foundation, while Power BI continues to be the front end where business users interact with data.
Who should use Zebra AI in Fabric?
Business users in finance, operations, and sales who want plain-language insights
BI specialists who need to speed up analysis, commentary, and repetitive reporting tasks
Executives and C-level leaders who prefer summaries and recommendations, not raw tables
What’s the difference between Zebra BI and Zebra AI in Fabric?
Zebra BI: ensures standardized, governed reporting in Power BI (tables, charts, variance analysis).
Zebra AI: adds an intelligent analysis layer inside Fabric, generating automated narratives, variance explanations, and interactive Q&A on governed data.
Together, they cover both formal reporting and conversational insights.
How does Zebra AI compare to Microsoft Copilot in Fabric?
Microsoft Copilot provides general AI assistance across Fabric services, while Zebra AI focuses on financial and business reporting scenarios. Zebra AI is specialized for P&L, variance analysis, and management reporting, making it a complementary solution for decision-making.
Can Zebra AI be used outside Fabric?
Yes. Zebra AI also supports Excel, CSV, SQL databases, Databricks, and OneLake sources. However, its deepest integration and governance benefits come when used directly inside Microsoft Fabric.
What are common use cases for Zebra AI in Fabric?
Finance: Build dashboards with automated commentary and scenario comparisons
Sales: Identify growth drivers, regional performance, and forecast trends
Operations: Detect bottlenecks, surface KPIs, and recommend next steps
Each use case combines automated reporting with interactive Q&A, reducing manual effort and accelerating insights.