New · Zebra BI Tables+ and Charts+

Everyone can comment on the report. No edit rights.

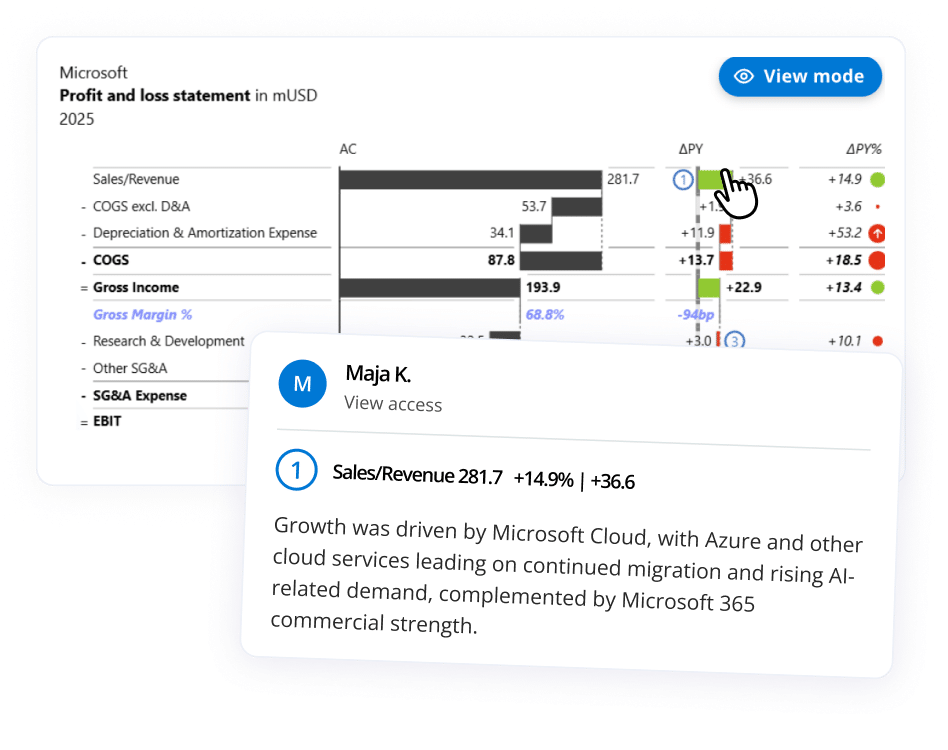
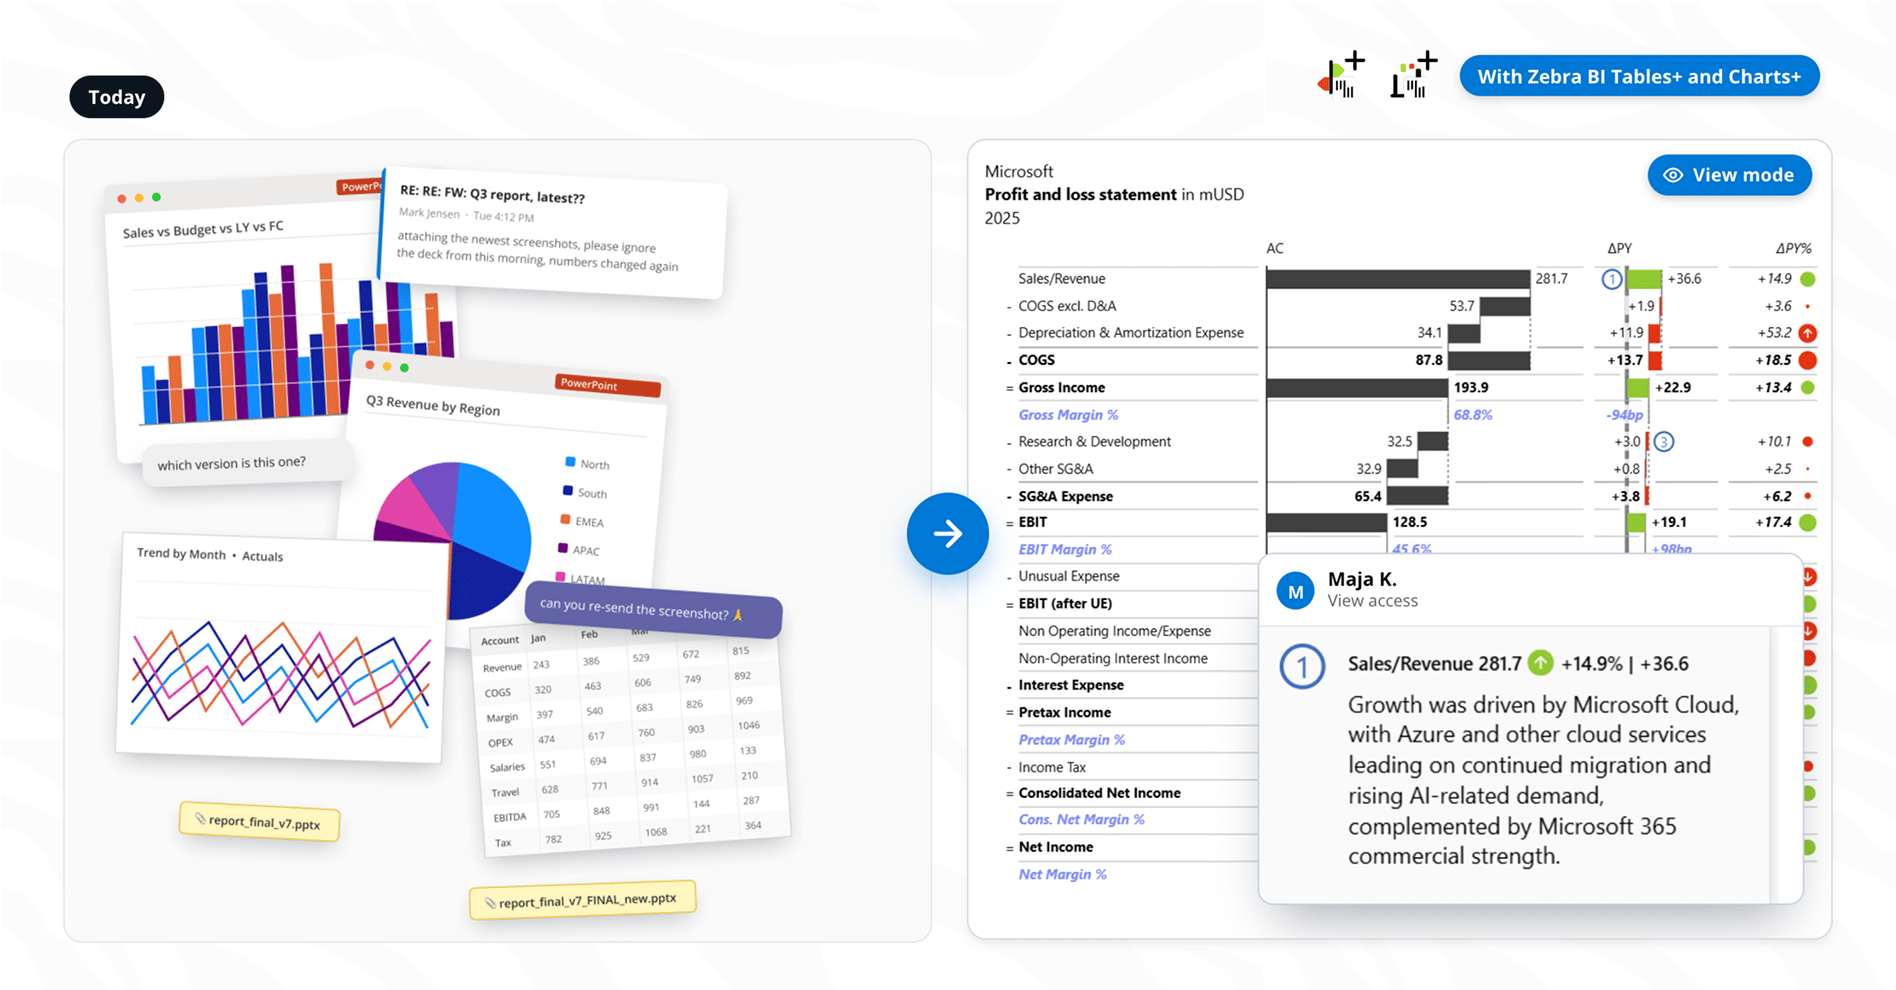
Report viewers add comments right on the data point, in view mode. No screenshots, no workarounds, no waiting for the report owner.

The people with the answer usually can’t add it to the report

The problem
The collaboration gap is real. A regional manager knows why a variance in their region happened, but the report isn’t theirs to edit. So the context lives elsewhere, detached from the number. The why and the what next leave the report and get lost.
Zebra BI Tables+ and Charts+ close the gap. Explanations live with the data, governance isn’t compromised, and the right decisions get made.

Connect. Comment. Act.

HOW IT WORKS
Step One

Connect

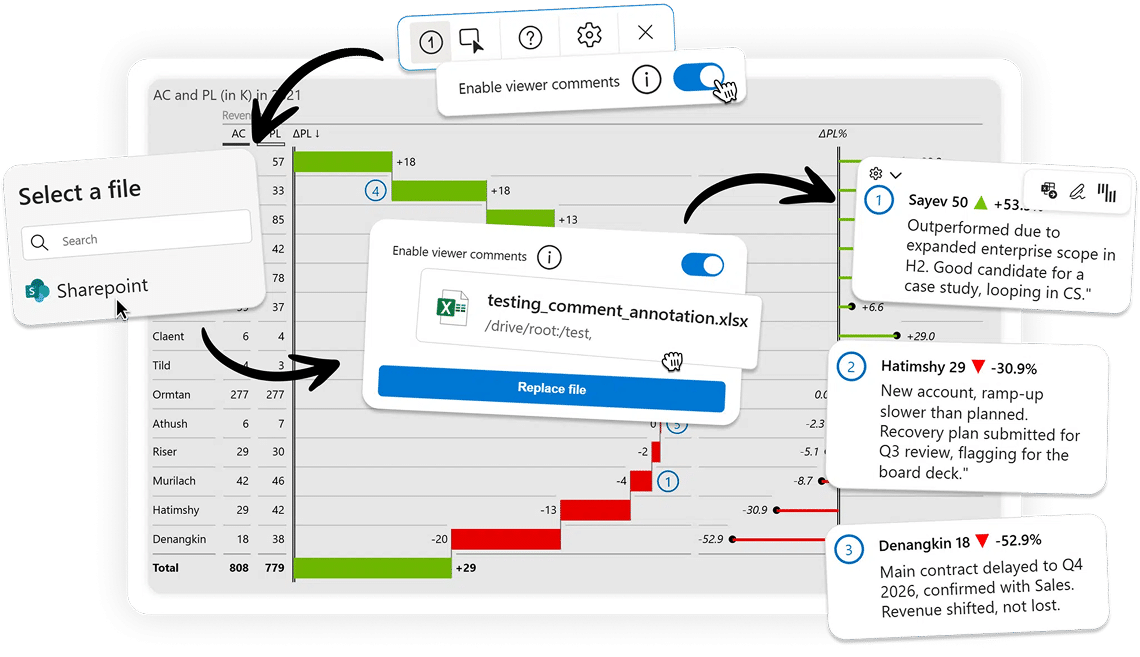
Link a SharePoint file to your Zebra BI Tables+ or Charts+ visual. Once per report.
Step Two

Comment

Anyone with SharePoint access comments directly on data points, in view mode.
STEP THREE

Act

Decisions get made where the data is. No email threads, no separate slides.

Everything Zebra BI Tables and Charts already do

The foundation
Zebra BI Tables and Charts turn data into decisions for 3,000+ teams every day. Tables+ and Charts+ carry every bit of that, and open the report up: the people who understand a number can put their reasoning on it, without anyone handing out edit rights.

No more DAX workarounds

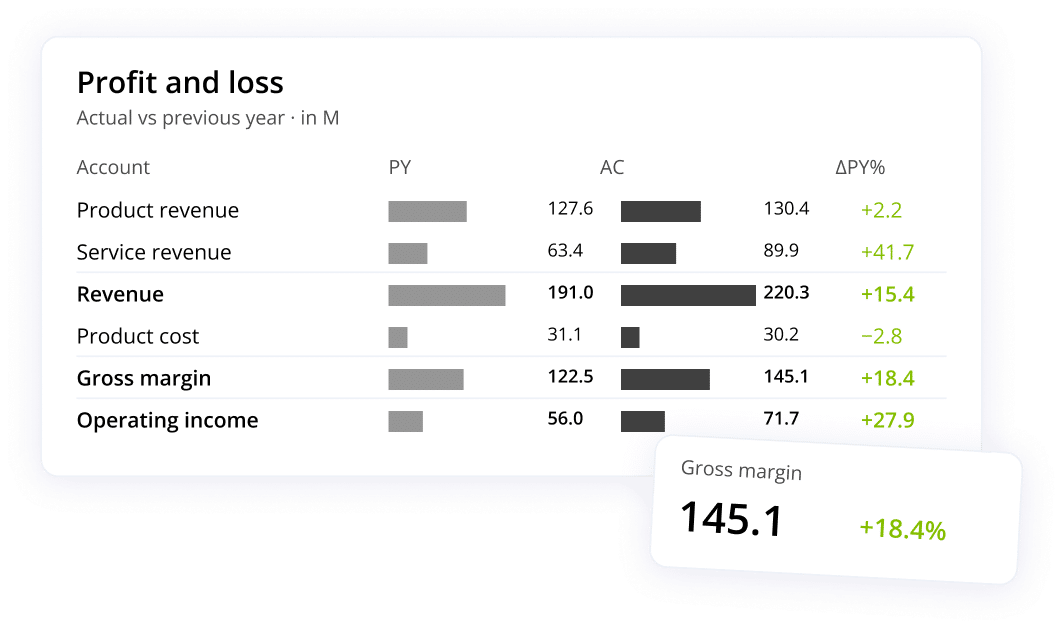
Automatic variance calculations, financial hierarchies and P&L structures are built in, so you are not losing days to building the report.
P&L table
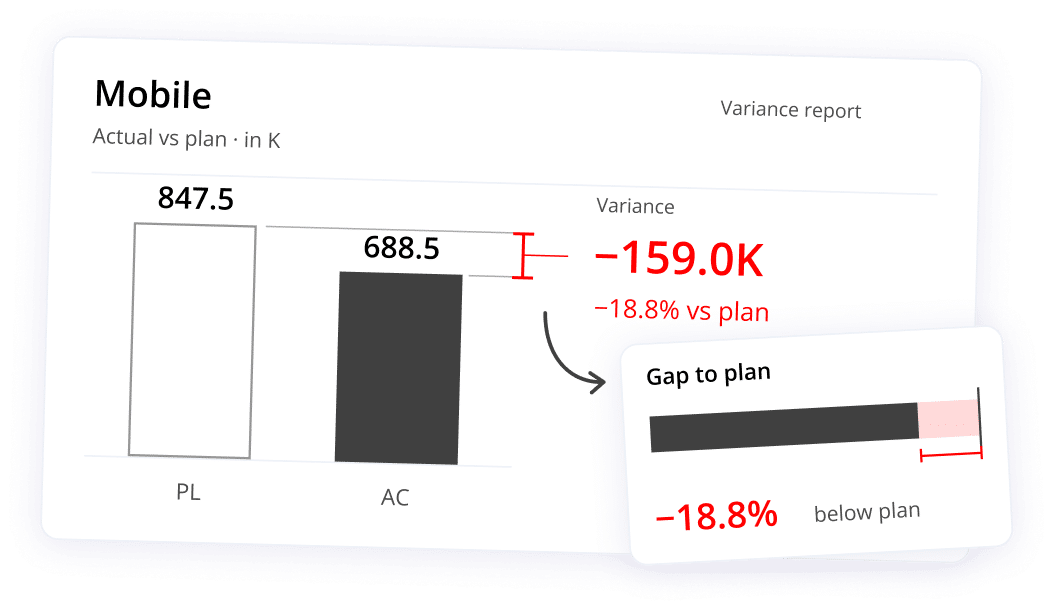
Variance report

Every number in context

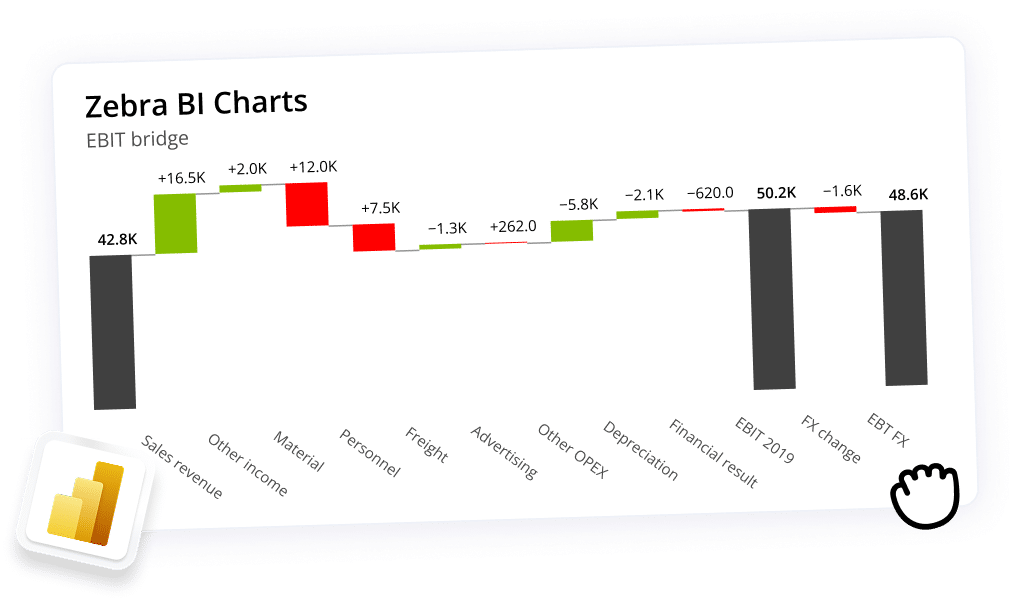
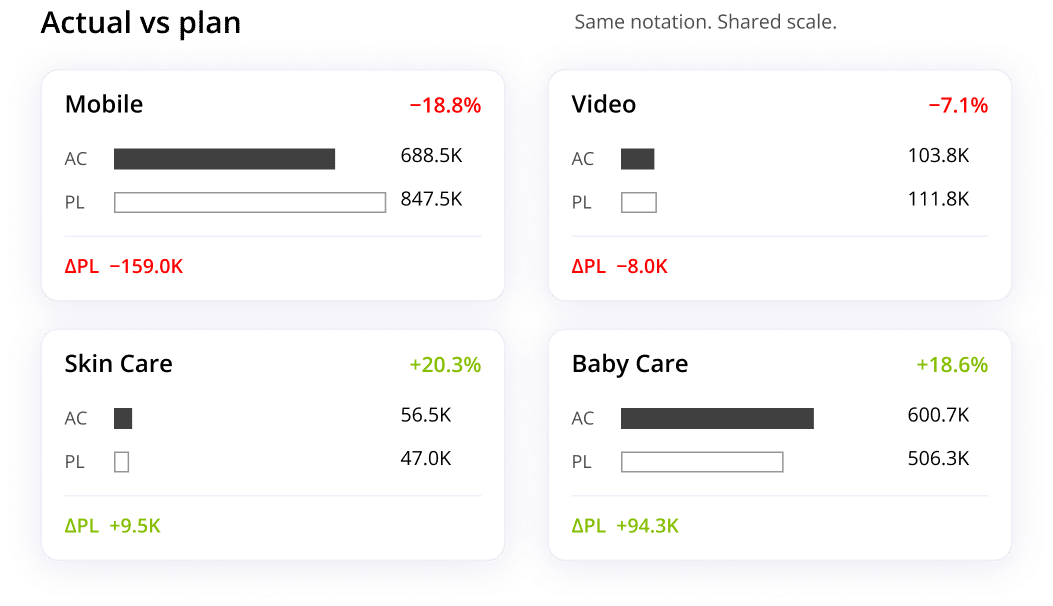
Actual, plan, last year and forecast side by side, with waterfalls and small multiples for the breakdown. The comparison is drawn, not left in a footnote.

Up and running in no time

Drag and drop inside your Power BI canvas. No new environment, no migration, nothing for the team to learn from scratch.
Waterfall
Small multiples

Consistency out of the box

Every report follows the same visual language (IBCS), so people read any report the same way and spend their time on what to do next.

Plus or certified?

Two tracks
Your Zebra BI licence now covers all five visuals. Both lines are fully supported, nobody has to switch, and existing reports are unchanged. Which one you use depends on the report:
You need

Plus

Tables+, Charts+

Certified

Tables, Charts, Cards
Viewers to add context without edit rights
To cut screenshots and workarounds out of the review
Native PDF, PowerPoint or subscription email export
To comply with a certified-visuals-only policy
Both, because different reports have different needs
Use both

Zebra BI Tables+ and Charts+ are not Microsoft-certified, by design: viewer commenting reads and writes a file in your own SharePoint, which a certified visual cannot do. Everything stays in your own tenant and Zebra BI stores nothing. Read more

  The line built for this
—   Use the other line

This is the first step

The beginning
Here is what works today and where in-report collaboration is heading.

Here today

  • Viewers comment in view mode, with no Power BI edit access
  • Comments pinned to the data point, not the page
  • Unlimited comments on every plan, no per-visual cap
  • Comments stored in your own Microsoft 365, we store nothing

Where this goes

  • Editing your own comment after you have posted it
  • Replies, so a comment becomes a thread
  • Mentions, to bring the right person to the number
  • More than one voice on the same data point
  • Commentary a separate Zebra AI can read and roll up into a narrative
QUESTIONS

What you need to know

The comments are not new. Who can write them is. Report builders have always added dynamic comments in edit mode. With Zebra BI Tables+ and Charts+, report viewers add them on the data point, in view mode, with no Power BI edit access, so the explanation comes from the person who has it.

No. One licence key now covers all five Zebra BI visuals for Power BI. You add Zebra BI Tables+ and Charts+ as two separate visuals from the Microsoft Marketplace, and which one you use depends on your needs.

Yes. Adding a comment means interacting with the report, so anyone who comments needs a licence, the same as any other user. What is not limited is the commenting itself.

No. Viewers can add as many comments as they need, on every plan, with no cap per visual and no higher tier to buy.

Your Power BI workspace permissions are unchanged. SharePoint permissions control who comments, and the setup is one-time and admin-controlled.

No. Power BI includes only certified visuals in native PDF export, PowerPoint export and subscription emails. If a report is distributed that way, use Zebra BI Tables and Charts which are certified.

No. Zebra BI Tables, Charts and Cards are unchanged and stay certified. Zebra BI Tables+ and Charts+ are two additional visuals you use where viewer commenting is worth having.


Trusted by BI leaders at top companies worldwide

55+
Expert Webinars
30K+
Professionals Trained
Free
On Demand Access
“Our financial landing page at KPN is completely based on the sales dashboard template. We don't need to invent the wheel again.”
“Zebra BI is the best feature that has been created for Power BI. It makes designing reports easy.”
“What a great audience, so much knowledge in one place. Watching Zebra BI videos was a game changer for me!”

See it on one of your own reports

Start with the report where reviewers already send you screenshots. That is where viewer commenting pays for itself first.

New: Zebra BI Tables+ and Charts+

Everyone can comment on the report. No edit rights needed.
See the new visuals
Matija Prijatelj
BI Specialist