IBCS® Certified
PBI Certified

Layered waterfall chart in Zebra BI Charts & other updates

Revenue is 88k ahead of plan. You know what comes next: a round of follow-up questions. 

Each one sends you back to build another report page.

The latest updates on Zebra BI Tables and Charts are built for that moment, so the answer is already in the report when someone asks.
Download the Demo PBIX file that contains all the latest features illustrated with many practical examples.

Note: This is a private version of our Power BI visuals (not the AppSource version).
Download PBIX

Watch the Video

Watch the video below for a quick and practical overview of all major NEW features & updates:
[00:00] Intro
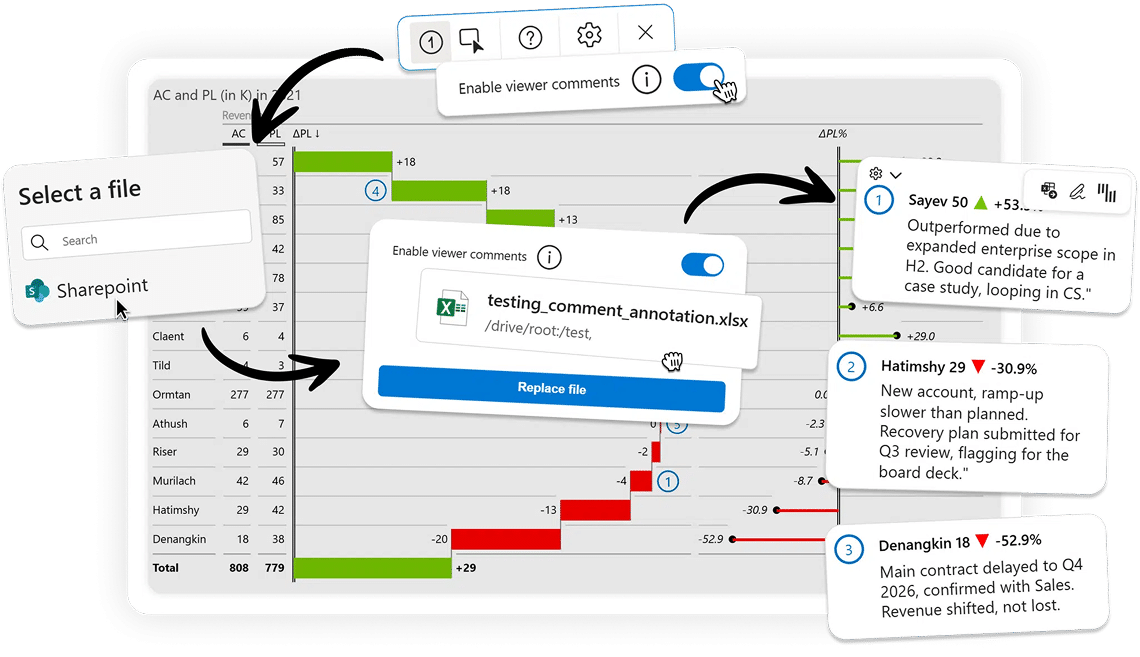
[00:43] News: Zebra BI Tables+ and Charts+ with viewer commenting
[01:40] Layered Waterfall: which region is holding us back?
[03:31] Order groups by: which countries are behind?
[05:02] Word wrap for column headers: what does that column say?
[05:53] Small multiples sorting: which ones should we look at first?
[06:54] Recap
Share this

Interact with Zebra BI visuals for Power BI 👇

Play with our interactive example to get inspired and see all the new features in action. 
Tip: Make sure you put the interactive report in the full-screen mode (⤢) and check out all the pages by pressing the navigation arrows.

Expose the gap

Which region is pulling revenue down?

With the new Layered view in Zebra BI Charts, each region gets its own row in the same waterfall with the totals still connected.

The one behind the plan can't hide.

📖When to use stacked and layered waterfall

Get more details

Is it the whole region or just a few countries?

Order groups by in Zebra BI Tables sorts column groups by the column you pick, so your biggest outlier comes first. 

No new report, no Power Query workaround, no settling for alphabetical order.

Stop guessing

What does that column say?

With word wrap for column headers in Zebra BI Tables, you can drag the header row taller, and the text wraps inside it.

Narrow columns, complete labels, so it's a win-win. 

Get full control

Which cost centers first?

Small multiples in Zebra BI Charts now sort three ways: by biggest total, biggest swing, or your model's order.

Define it right in the settings panel.

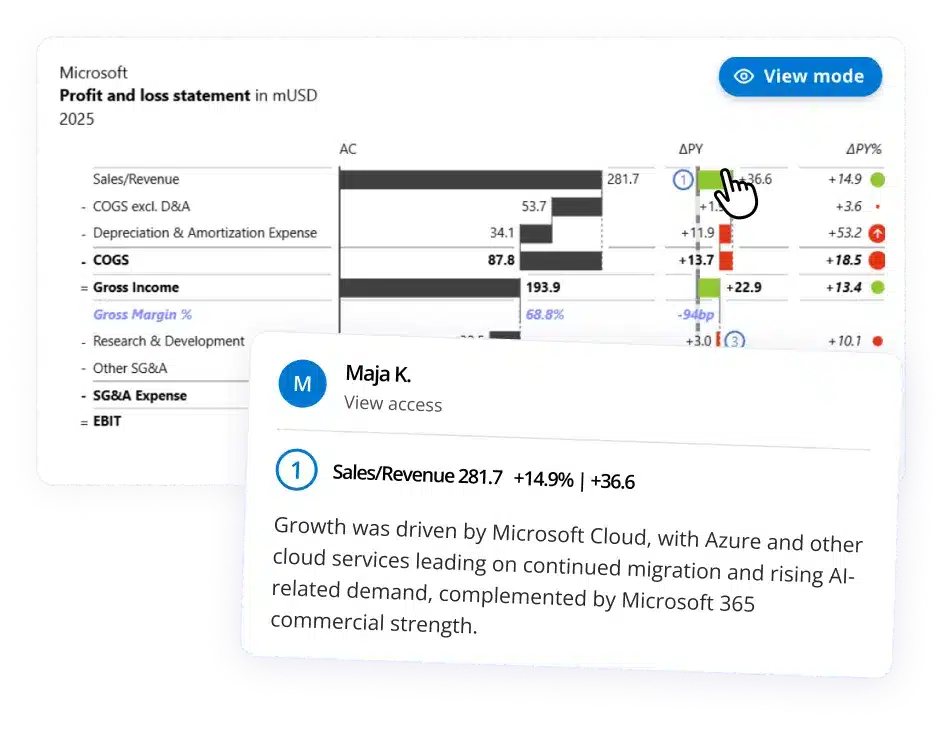
Comment in view mode

Why is APAC behind plan? Your sales rep there already knows.

With Zebra BI Tables+ and Charts+, two new Power BI visuals, viewers can comment right on the data point in view mode.

No edit access. Governance preserved. Insights connect with numbers.

Learn more

Other Improvements

Zebra BI Charts & Charts+ 8.2.1

  • The plus sign on positive variance values can be turned off, while keeping the green and red variance coloring. Data labels in the formatting pane, Show + for positive variance values, on by default.
  • The annotation toolbar can be dragged to reposition and positions itself around the title automatically.
  • Extended inverted variance setting support to Stacked Waterfall Charts

Zebra BI Tables & Tables+ 8.3.1

  • Shallow calculation data loading for further performance improvements to hierarchical calculations on large datasets.
  • The annotation toolbar can now be dragged to reposition and positions itself around the title automatically.
  • Improved handling of Percentage measures in subtotals and grand totals: a column formatted as a percentage in the model now defers to Power BI's own total rather than adding the percentages together. This covers base measures, additional measures formatted as a percentage, and rows marked as Result.
  • Variance colors and labels flip together when Invert the colors is enabled, so gains and losses read correctly on inverted measures.

Zebra BI Cards 7.5.1

  • The plus sign on positive variance values can be turned off, while keeping the variance coloring. Data labels in the formatting pane, Show + for positive variance values, on by default.
  • When Invert is enabled, variance colors and labels flip to match, so gains and losses read correctly on inverted measures.
  • Invert and Highlight interactions can now be disabled for report viewers, so the author's intended view stays intact.
See full changelog

Time to give it a spin!

If you're using the AppSource version of Zebra BI (version 4.0.0 or higher), then your Zebra BI will be updated via Microsoft's AppSource marketplace automatically once processed.

If you're using an older (private) version of Zebra BI (e.g. 3.x.x or older), then this is a perfect opportunity to update your Zebra BI! When ready, just shoot us an email at support@zebrabi.com and we'll help you migrate to the latest version.

Haven't tried Zebra BI before? Opt in for our free trial here:

Start your free trial

New: Zebra BI Tables+ and Charts+

Everyone can comment on the report. No edit rights needed.
See the new visuals
viewer commenting in zebra bi
Matija Prijatelj
BI Specialist