(1:29) Introduction to Zebra BI
(2:13) Creating better reports
(4:30) Creating better presentations
(7:10) Making better dashboards
(8:40) Introduction of Zebra BI for Excel: Visualize, report, share
(10:04) Standardized reporting (styles)
(11:07) Inserting dynamic charts: Automatically calculated variance
(16:47) Applying different styles
(17:31) Editing styles: Colors, shapes, scenarios (labels)
(20:30) Variance charts: Absolute and relative variance
(21:50) Displaying costs: Inverting the colors
(22:44) Indicating outliers: Limiting minimum/maximum values
(24:37) Already calculated variances
(25:05) Embedding charts into tables
(27:30) Switching off the labels on the chart
(28:28) Adding comments
(30:23) Exporting reports
(32:45) Adding new rows
(34:46) Waterfall charts
(36:06) Specifying the fixed columns
(37:26) Adapting scales between different charts
(39:20) Representation of calculations: Profit & Loss example
(42:13) Visualizing small multiples
(43:59) Changing the report layout: Column size, sorting
(48:58) Zebra BI resources and social media presence
(50:53) Q&A
Share this
Ready to start uncovering actionable insights from your data?
Explore Zebra BI for Office and Power BI, or start a trial instantly and test our tools on your data. You can also contact us to help you build your first test report and create a custom package for your business.
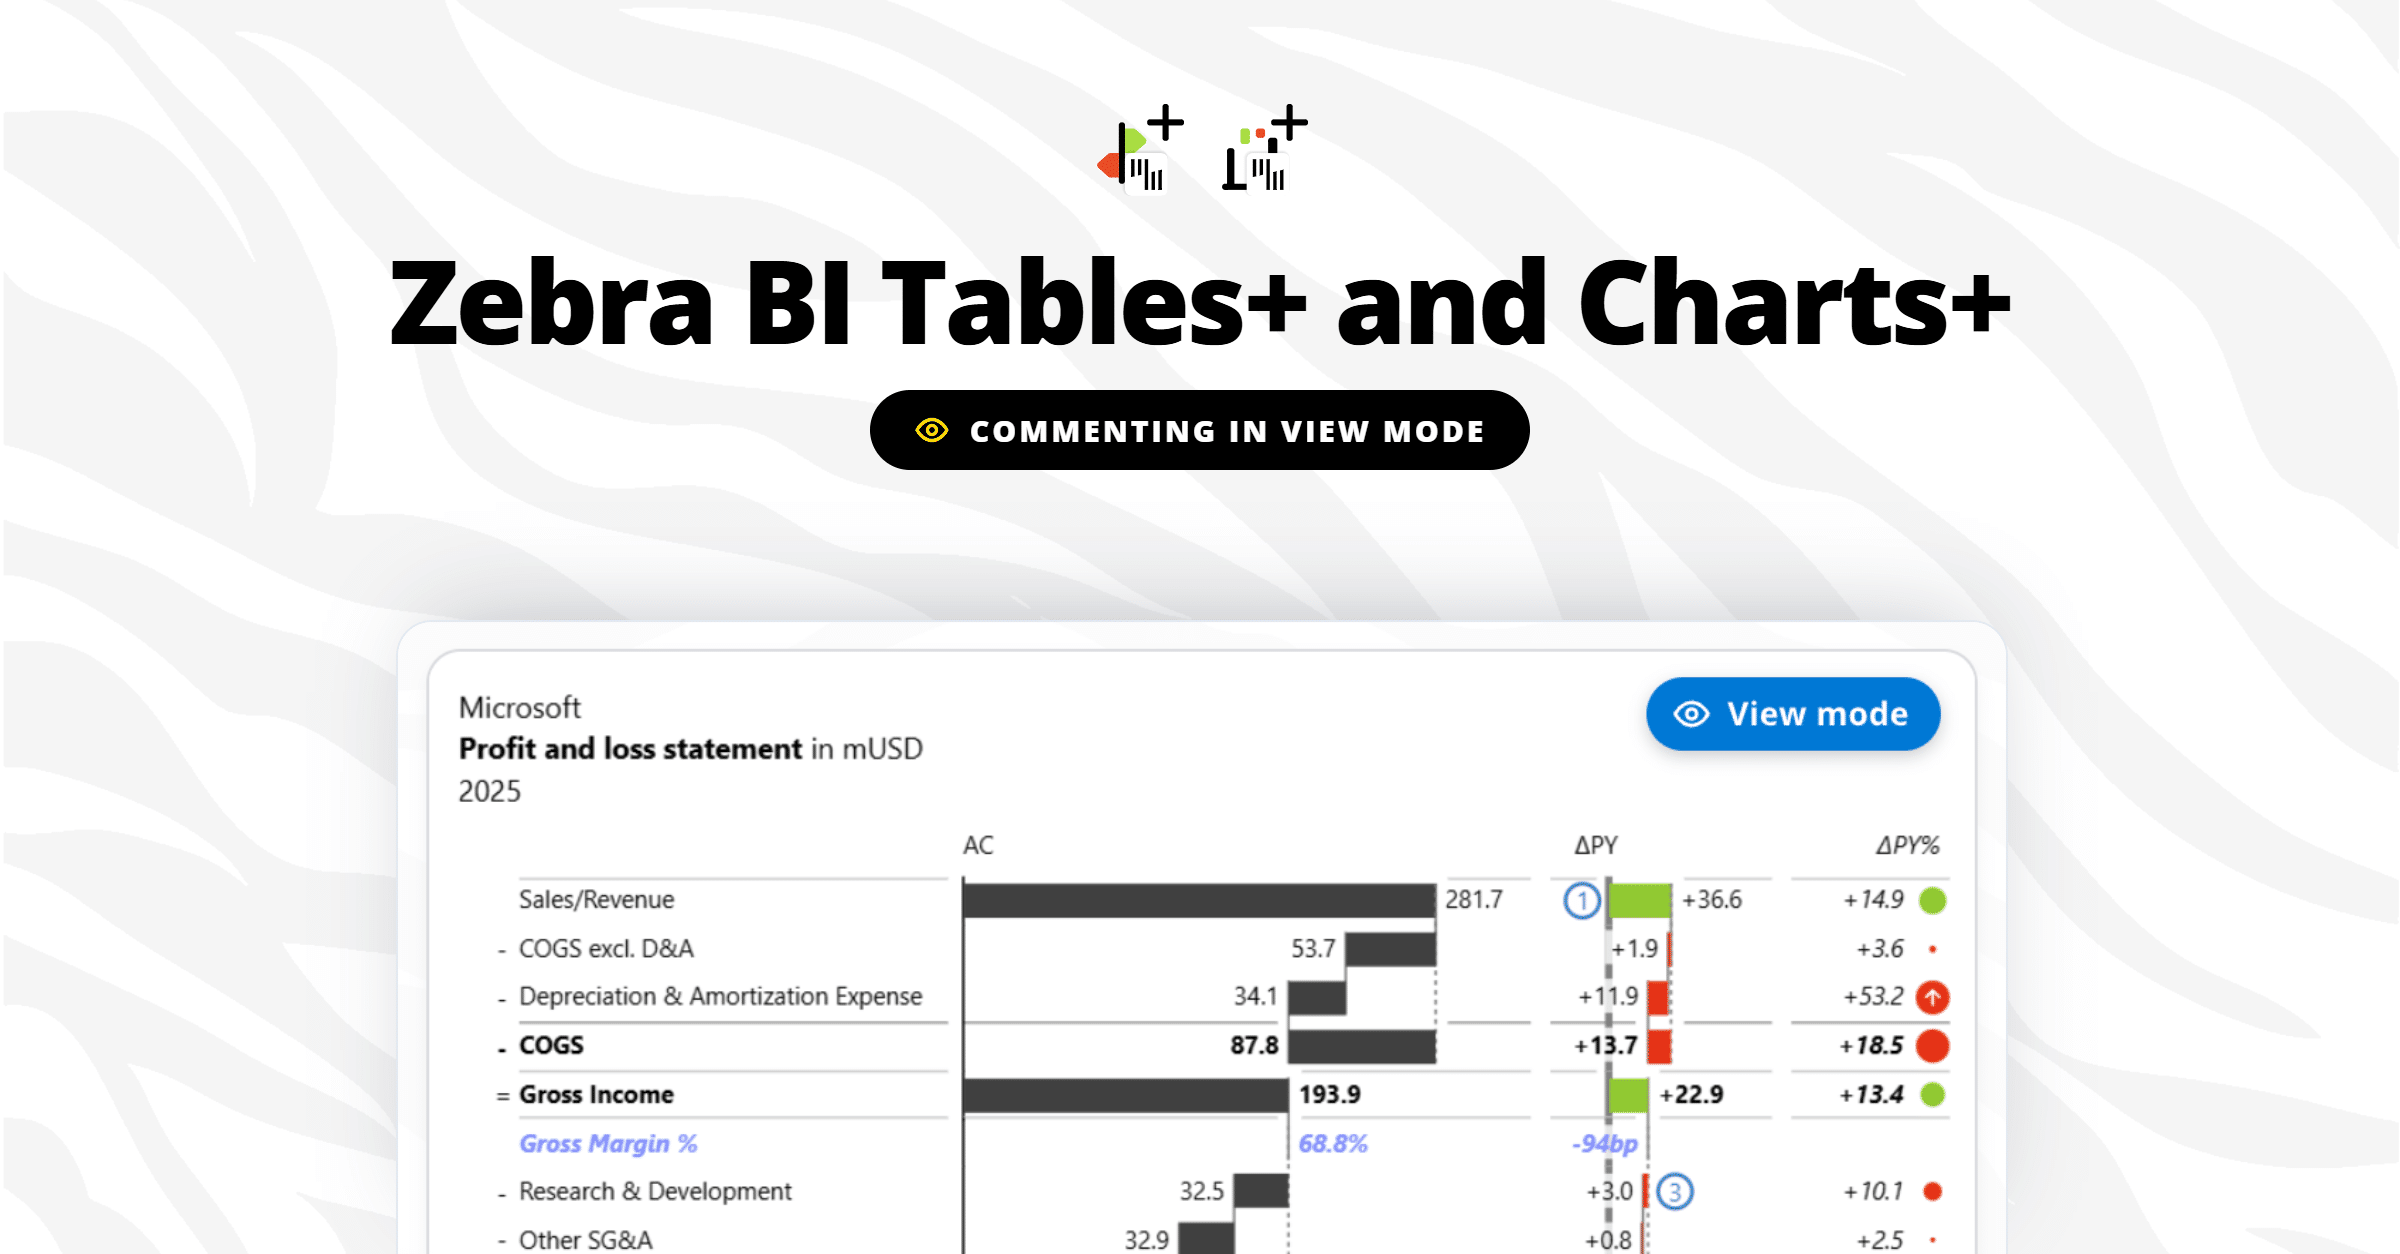
Report viewers can finally comment right on the data, in view mode, with no Power BI edit access. Andrej Lapajne and Mark Leskovšek launch Zebra BI Tables+ and Charts+ live on a real report, then take your questions.
Finance teams are debating dashboards vs AI. We're not going to debate. We're going to show. On June 4, we walk through 100 real company P&Ls (Nike, Tesla, Pfizer, Walmart, Amazon) across 6 industries and 6 years of public financial data, live, in a single report. See what great financial reporting looks like at scale.
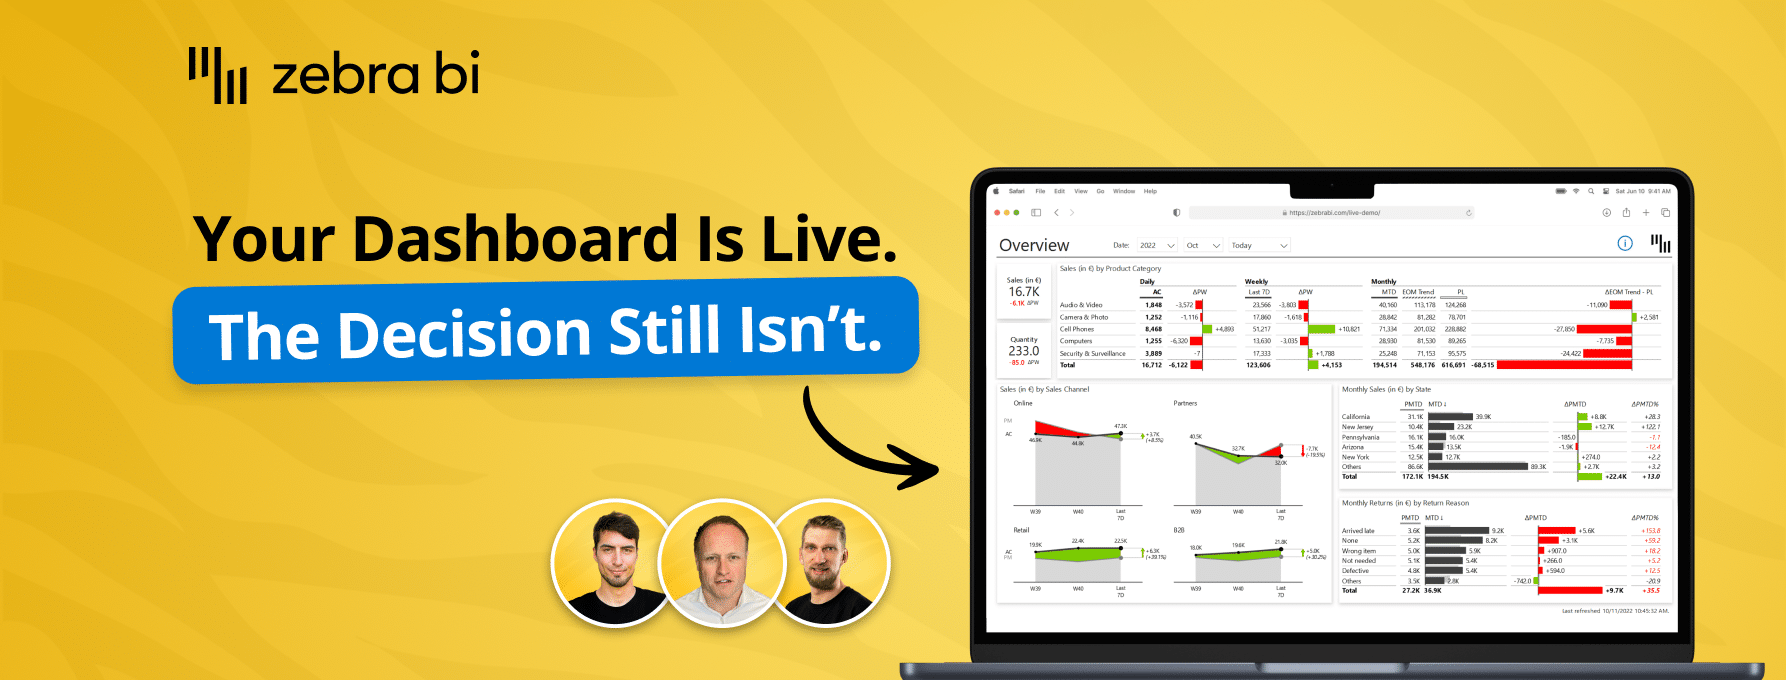
Your reports are ready. Decisions aren't. Learn how to close the Last Mile - live Power BI build, real client case, actionable framework. Free, 60 min.
Your reports are ready. Decisions aren't. Learn how to close the Last Mile - live Power BI build, real client case, actionable framework. Free, 60 min.
Kosten omlaag, opbrengsten omhoog. Zebra BI en Den of Data laten zien hoe je data centraliseert in een managed dataplatform en rapporteert volgens IBCS-standaarden, zodat dashboards direct tonen waar actie nodig is. Nu on demand te bekijken.

 September 8th
 February 22nd