How-to session: Using report prototypes & wireframes to make sure you're answering the right questions
ON DEMAND
Thursday, Jun 9
Duration 17 min
Speaker
Michael Schneiders, Enterprise Architecture | Data Transformation & Strategy at PwC
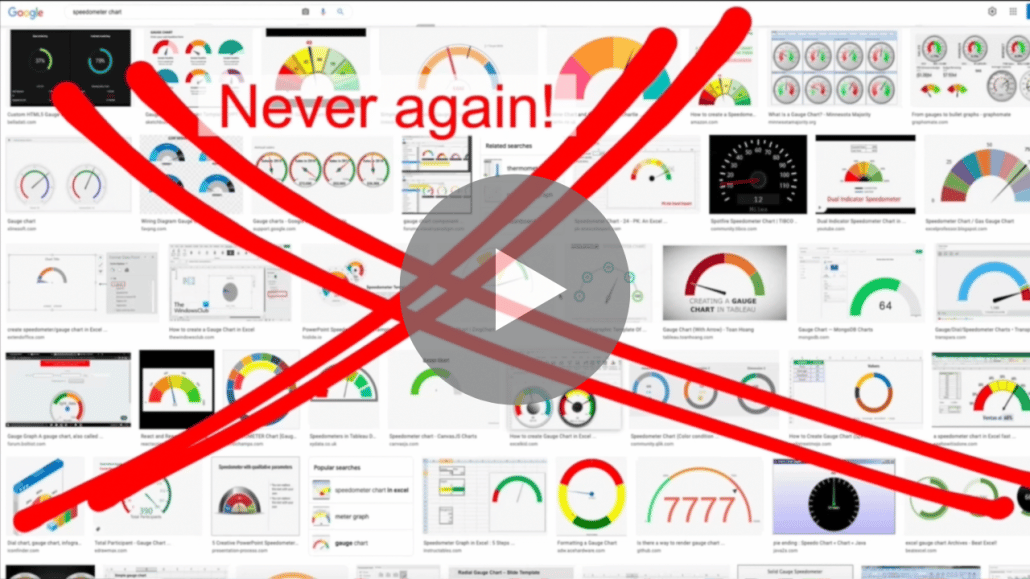
Before developing any reports, it’s crucial to define first what questions do your business users want to answer. In this session, Michael Schneiders, Enterprise Architecture, Data Transformation & Strategy at PwC, will share how his team used the design thinking process to understand what users really want, built wireframes, and went through multiple iterations to successfully prepare guidelines for report developers.
More resources
Supercharge your Power BI dashboards to drive action
Learn how to nail your dashboard landing pages in Power BI and make your KPI scorecards super actionable.
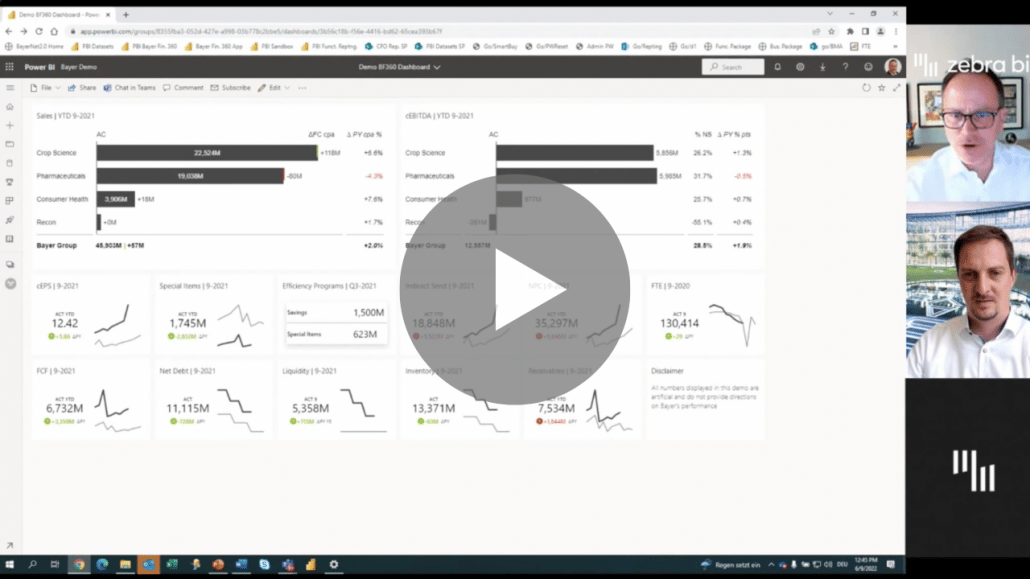
Two key people in reporting at Bayer share their behind-the-scenes story of how they built a powerful Bayer Finance 360 App and shifted focus from collecting data to extracting business-critical insights instantly.
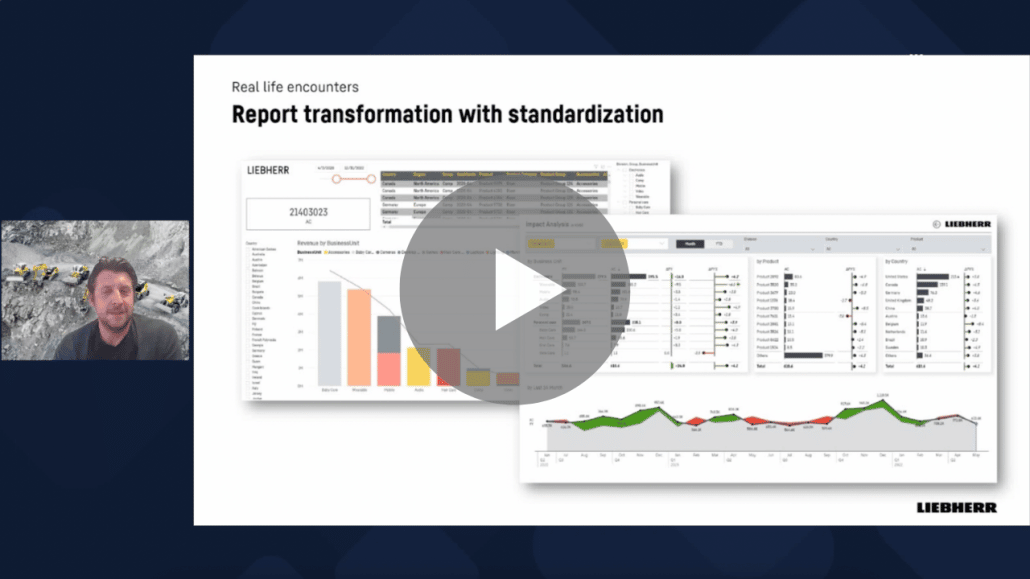
Mario Mühllechner, Team Lead Business Intelligence at Liebherr Earthmoving, shares how he and his team streamlined their internal reports and got everyone excited about it.
Rachel Guthrie, Customer Success at Microsoft, shares her approach to designing internal reports that enables her team to extract the right insights immediately.
Hear the advice from experts from KPN, Microsoft, PwC, and Enterprise DNA, who have seen what adopting the new way of reporting looks like in real-life, along with all the challenges that come with it.
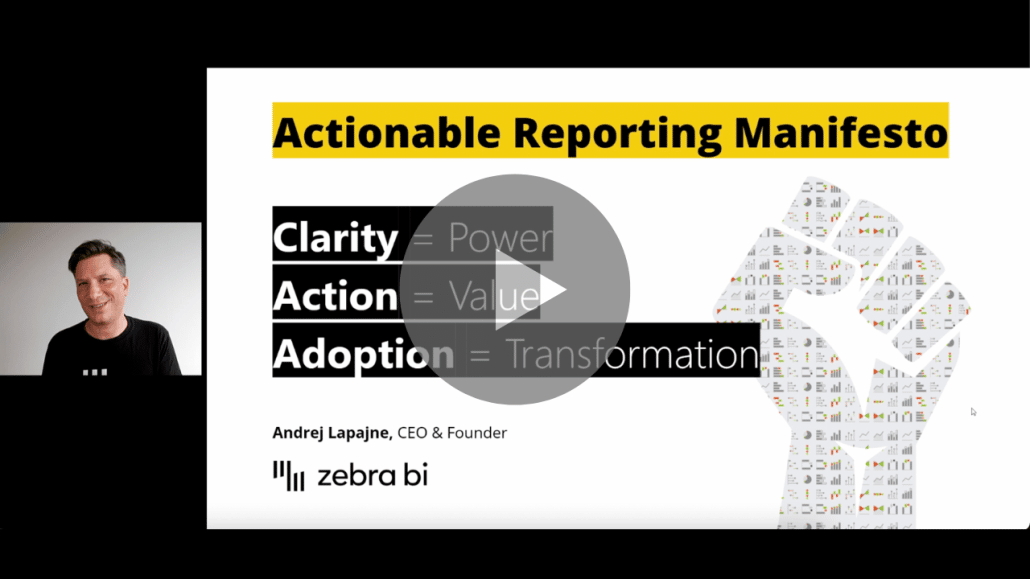
What is the key to actionable reports and why we need that so badly? Hear from Andrej Lapajne, Founder and CEO of Zebra BI, who explains why all companies need to transform their mindset in order to survive.
Ready to start uncovering actionable insights from your data?
Explore Zebra BI for Excel and Power BI, or start a trial instantly and test our tools on your data. You can also contact us to help you build your first test report and create a custom package for your business.
 September 8th
 February 22nd