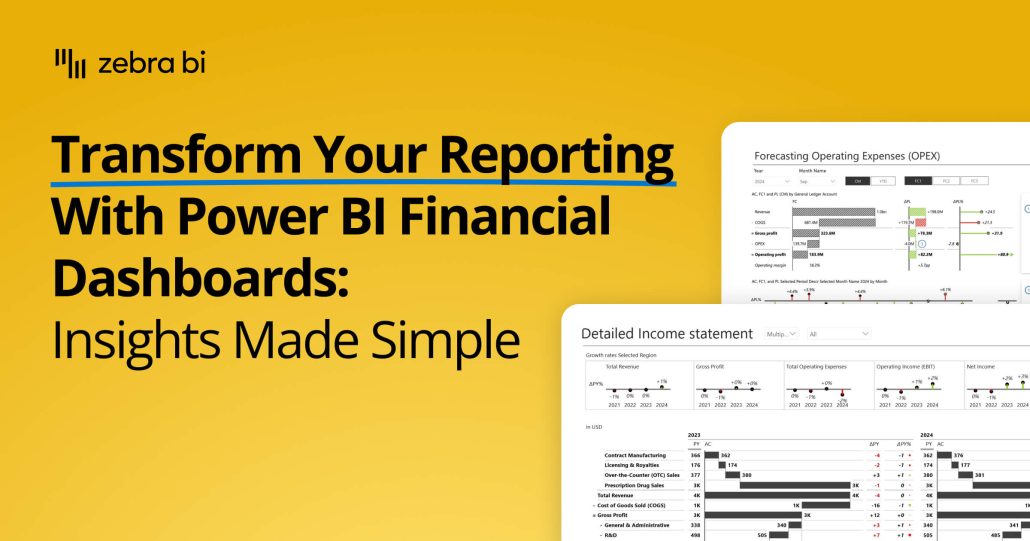
Transform your financial dashboards in Power BI. This guide shows you how to build lean, insightful reports for P&L, trend analysis, and cost management.
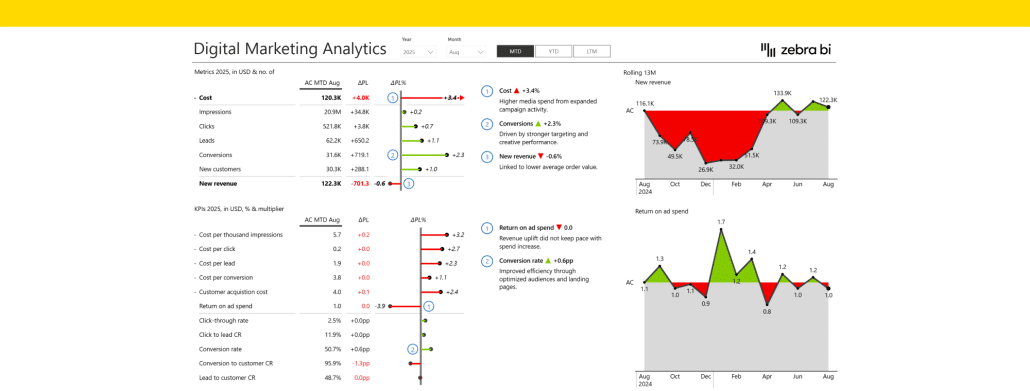
Marketing Performance Dashboard Template in Power BI to help you analyze channels, campaigns, funnel metrics, efficiency KPIs, and marketing ROI in one view.
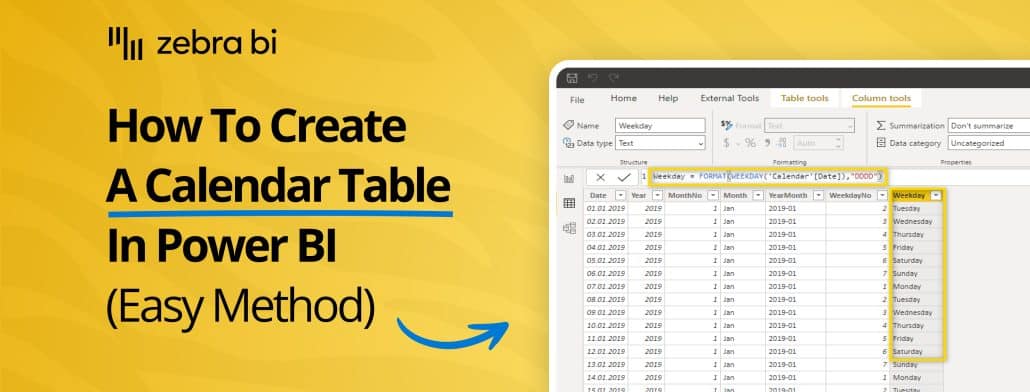
Time-based analysis is crucial for financial & business reporting, but native Power BI tools may not be enough. Here's how to create a Calendar table in Power BI (TWO easy methods)
Ready to take your Power BI waterfall charts to the next level, the easiest way there is? Follow our guide for better custom visuals done in less time and with less hassle.
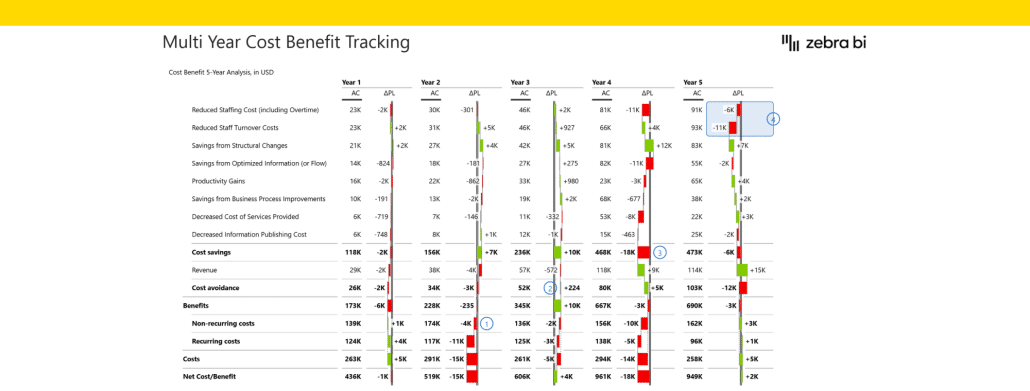
Get a better grip of your annual statements across multiple years and regions -- all in a clean, actionable way even business stakeholders outside of the Financial Department can decipher.
 September 8th
 February 22nd
 04 Jun 2026