Get a better grip of your annual statements across multiple years and regions -- all in a clean, actionable way even business stakeholders outside of the Financial Department can decipher.
Our Cost Benefit Analysis Template helps you get all the important bits of information in one place, in an easy-to-understand way, to help you decide whether to proceed with a project or not.
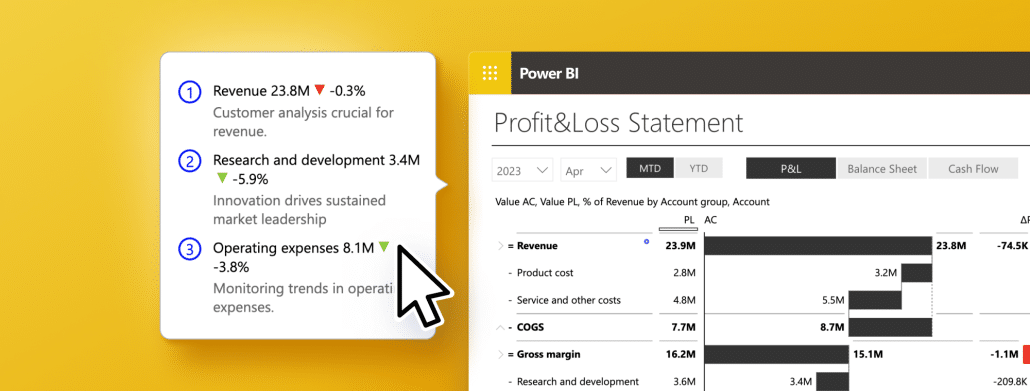
Find out why you should include comments in Power BI reports to deliver clear context and insights, which will help you make informed and strategic decisions.
 September 8th
 February 22nd
 10 Jul 2025