Custom themes are one of the most efficient productivity features in Power BI if you use them wisely. Contrary to the common understanding, they are not just good for setting colors. In fact, you can actually control almost every property of every Power BI element with a custom theme.
That's huge. It means that you can govern the design and behavior of all of your Power BI reports in one place. For the whole company.
Note: This Power BI themes tutorial is based on our 1-hour webinar on the same topic. If you prefer to watch the video, scroll to the bottom of this tutorial, enter your details and we'll send you the webinar recording and all theme JSONs and PBIX examples to go along with it.
Custom themes in your Power BI
You want your reports to look good and distinctive. You might want them to comply with your company's visual branding guidelines. This means that you have to adjust individual visual elements of your reports and dashboards.
This might mean adding a different font in the title. Using a different color scheme. Maybe just a couple of special icons. Nothing fancy.
But if you are just building your reports page by page, element by element, and visual by visual, you need to set all of the design settings from scratch for each element. Every single time. And if your colleagues are doing exactly the same, it all adds up. It adds up to a massive waste of time.
Enter Power BI themes
Power BI themes are probably the biggest time saver you can find in this powerful tool.
With themes, you can design every setting, page layout, background images, and logos in all reports across your organization. That means unifying the designs of thousands of users from one central place - a Power BI theme.
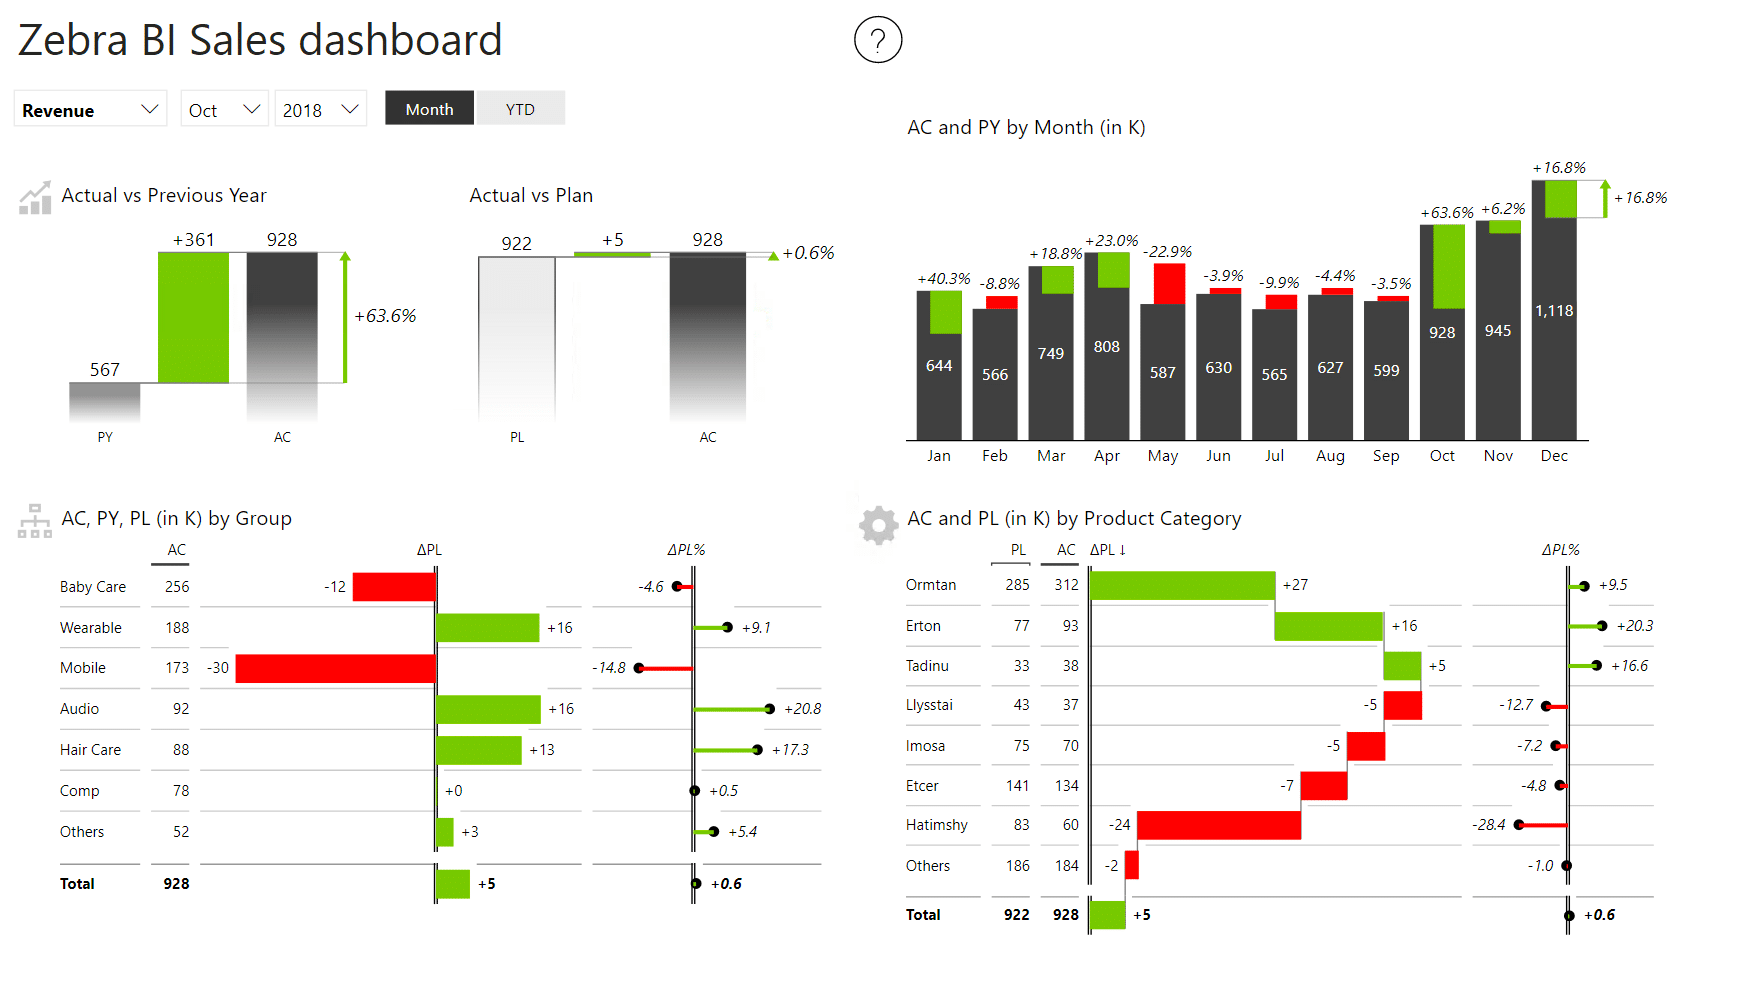
Let's look at an example of what you can do with a Power BI theme. By default, the dashboard below is very minimalist. No logos, backgrounds or other noticeable design elements.
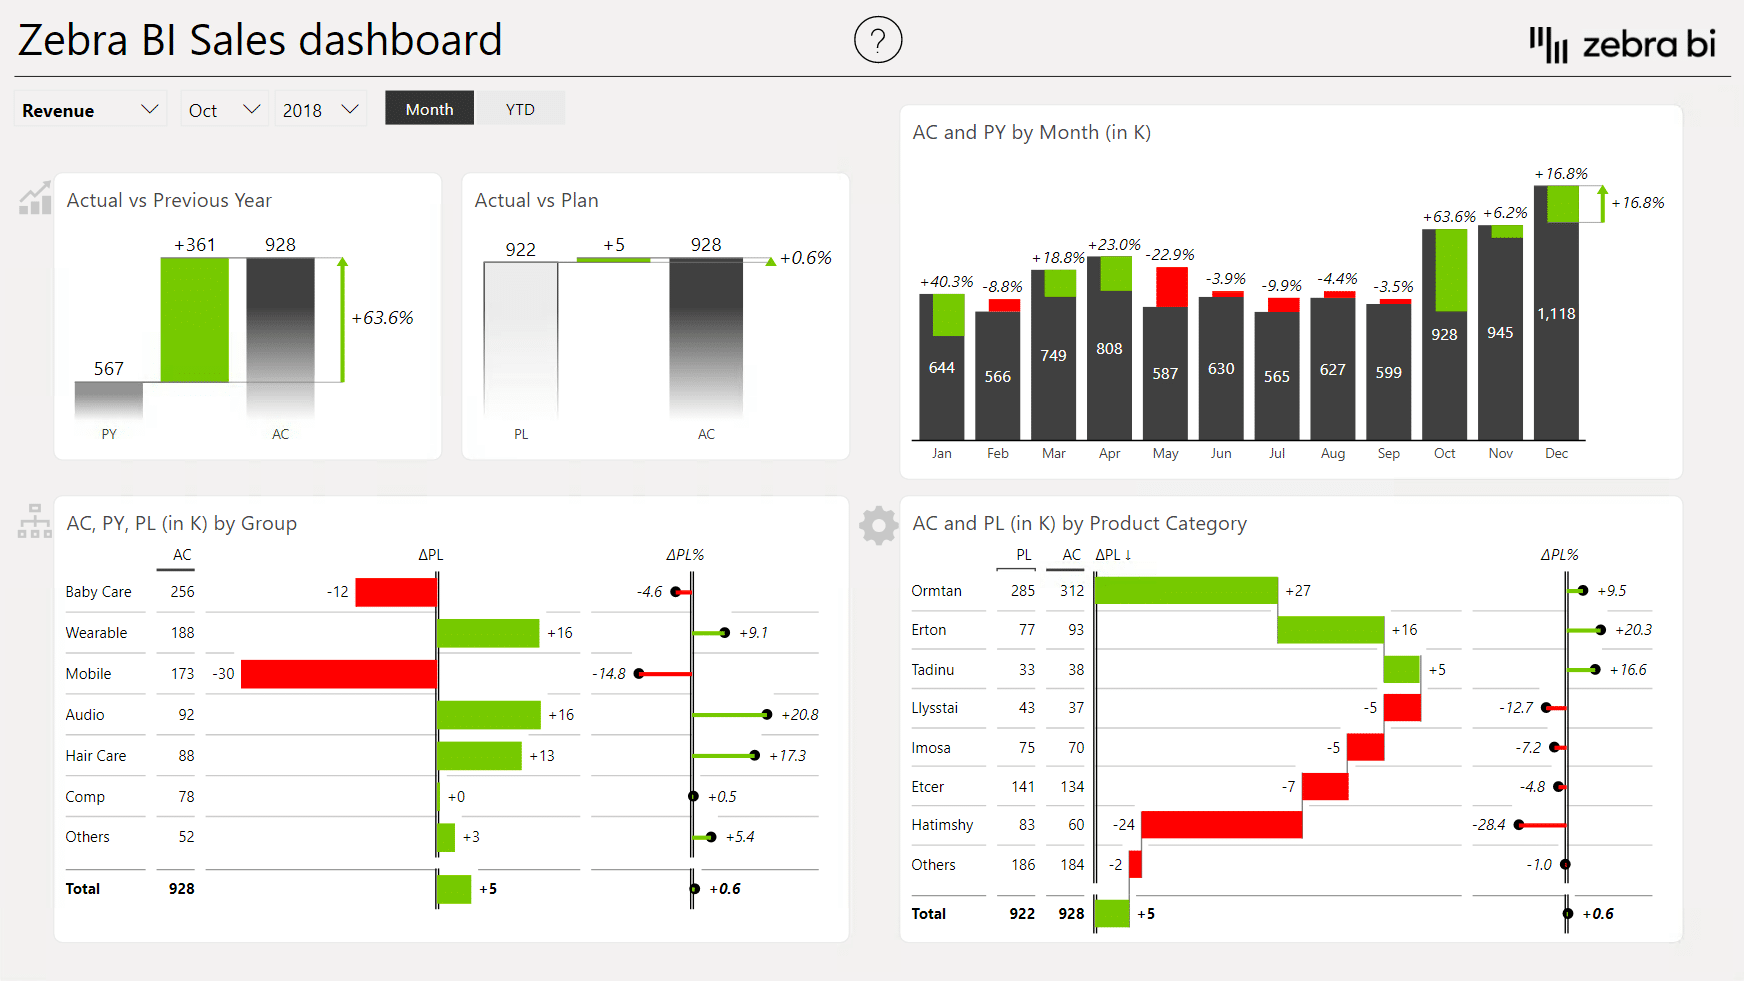
Using custom Power BI themes you can completely change how it looks with a single click. The new dashboard could look like this:
With a single theme, we have added a light grey page background and a slightly darker wallpaper behind it, so it looks like a shadow. We have also added the logo in the top-right corner. The colors of the charts have also changed and even the content of the visuals could change based on the theme.
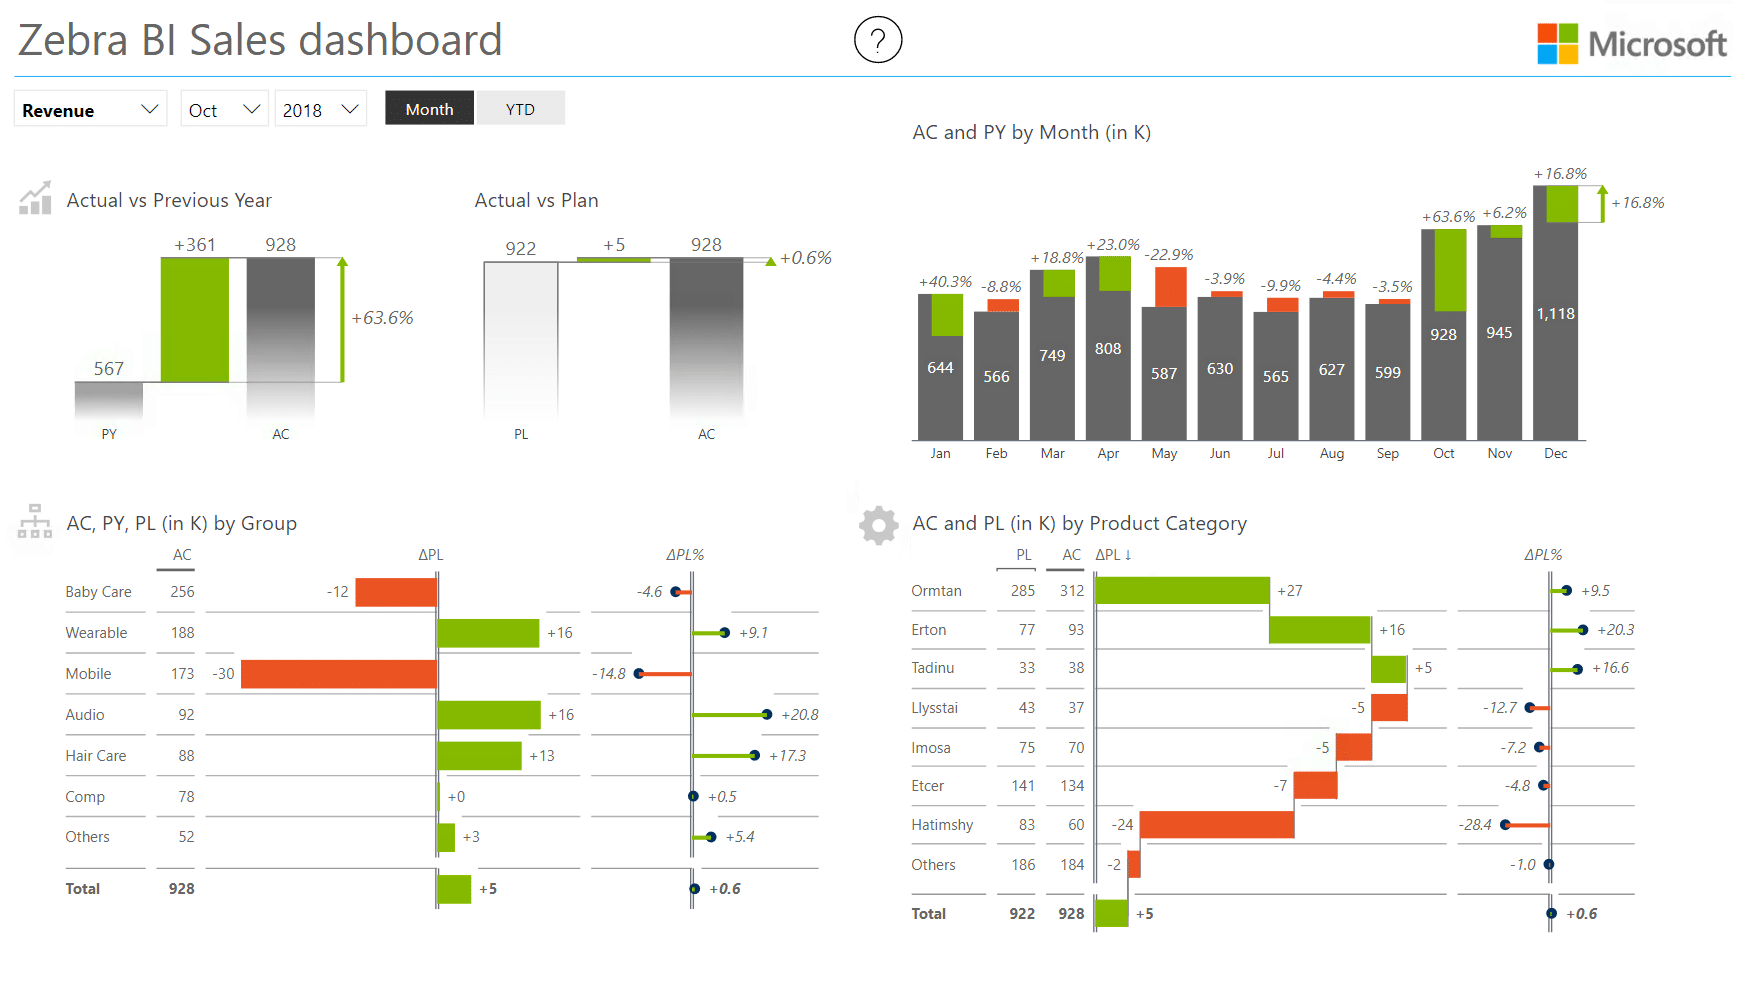
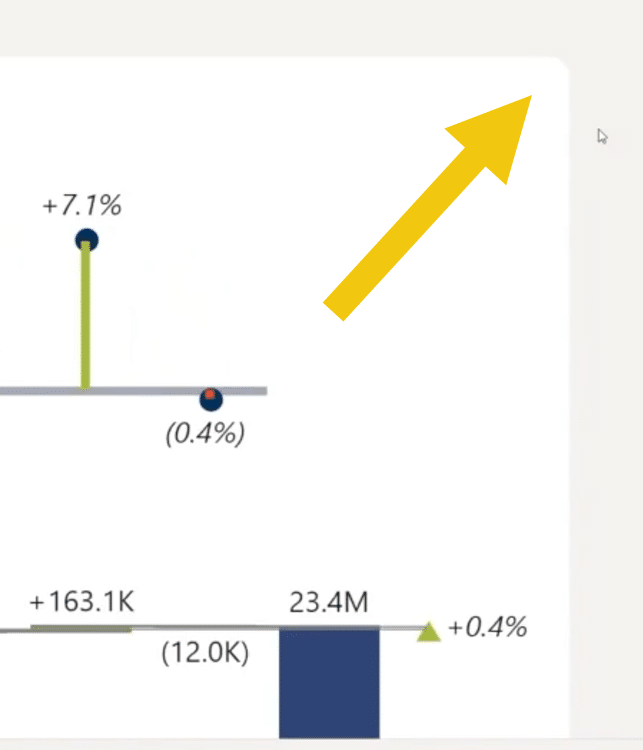
This means you can adapt reports to your brand, like with the report below inspired by Microsoft's design.
Themes mean that any design changes you make are reflected across the entire report and all pages. The best thing about it is they are not limited to just changing colors. You can even use themes to require visuals to show grand total by default. Or even add small multiples to your dashboards. Power BI themes also allow you to turn on Zebra BI features.
Importing a theme
It is easiest to start with the themes that are already included with Power BI. If you already have a Power BI theme that you would like to import, this is how you do it:
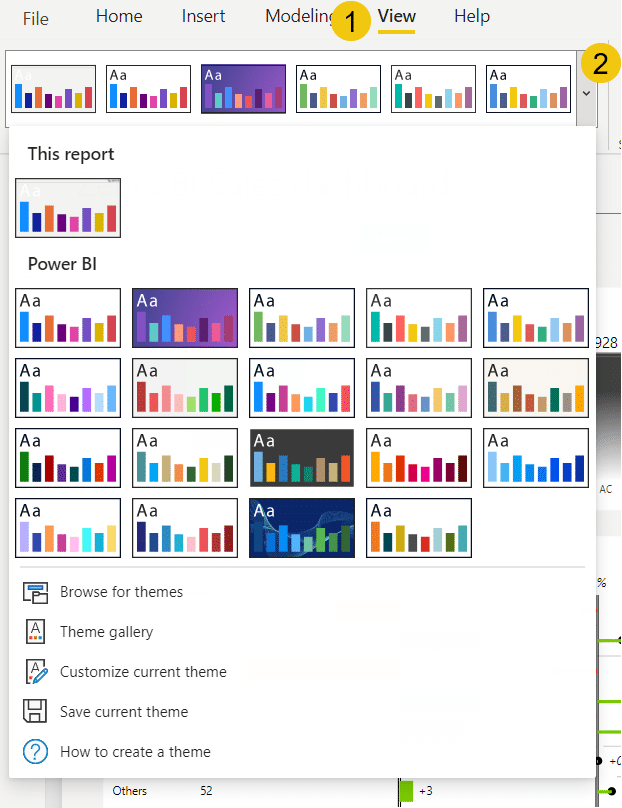
Under the View tab, expand the Themes window and click Browse for themes. Look for the theme you would like to import and then click Open. You'll see a notification pop-up after importing.
Editing themes in Power BI
When you start adding visuals to your Power BI report, you're using certain default settings, such as colors, fonts, button behaviors, etc. that are stored in a theme. You can select, edit, and switch themes by going under the View tab. Click on the themes arrow to open the window where you can access additional options. You'll also see the collection of all built-in themes.
After choosing your desired theme, you can also edit it, to a certain extent. The Customize current theme option will open a new window within Power BI. This will allow you to tweak some of the theme's design settings. Keep in mind that whatever changes you'll make here, will apply to your entire report.
You can change the basic design options for your theme, like
name and colors,
font color, family and size,
design of visuals (which include buttons, slicers, charts, tables, matrices, etc.),
page (wallpaper and background) and
filter pane.
Exporting a theme in Power BI
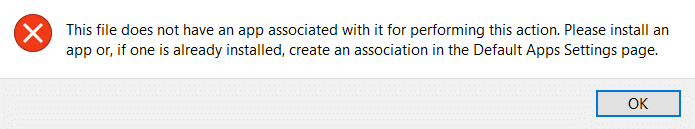
In the next step, you can export the theme and save it as a JSON (JavaScript Object Notation) file. JSON is a syntax for storing and exchanging data and is also the standard file format for Power BI themes. To open a JSON file, you need an app or a program capable of doing that. If not, the system will give you an error message like the one below.
You could open this JSON file also with a program like Notepad or with a normal text editor, like the example below. It's a standard text file, but unfortunately, it's very poorly formatted if opened in such a program.
At Zebra BI use a program called Visual Studio Code, which is a free tool, usually meant for developers and programmers.
This software will be able to open your exported theme and make it available for editing. If you're not accustomed to development tools or if you've never attempted to code before, this might look intimidating at the beginning.
What is in the JSON of a Power BI theme
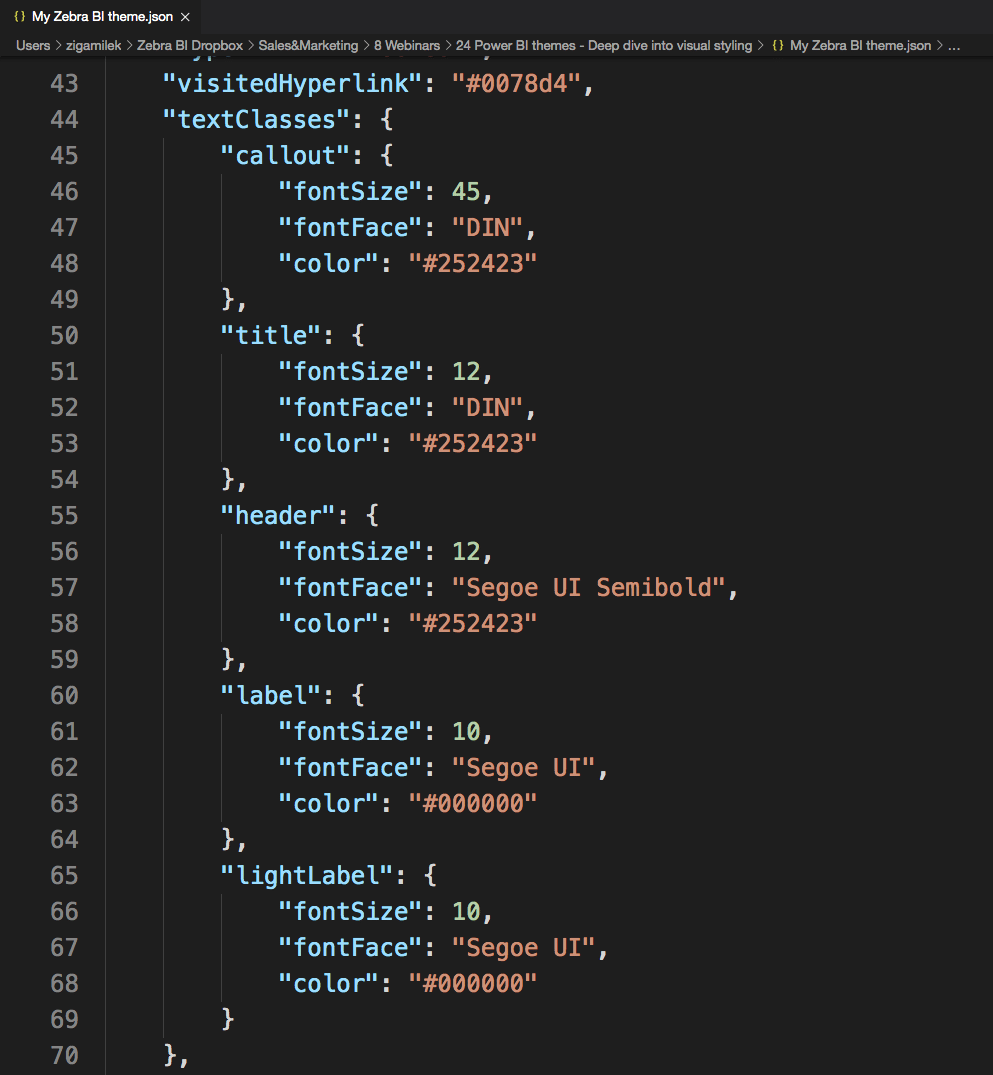
Let's look at an example setting that you can edit in a JSON file. This is a category of settings related to fonts.
For example, this code defines how individual text classes, such as labels, titles, headings and others will look. Headers will be in Segoe UI Semibold in size 12 and in black. Titles will be in DIN font size 12 and also black.
Create your own custom theme with the Zebra BI style editor
You can use our custom Style Editor to customize all colors and fonts in Zebra BI Charts and Zebra BI Tables. The Style Editor is located in your member profile underneath your license key. Activate the use of company style option to enable it.
You can now change colors, lines, markers, font family, and many other elements of the Zebra BI visuals.
When you're satisfied with your custom styles, click the Download Theme button on the top right to download your custom theme (JSON file).
Navigating a JSON file
JSON files might look unintelligible if you're not familiar with coding. However, you will quickly start to understand.
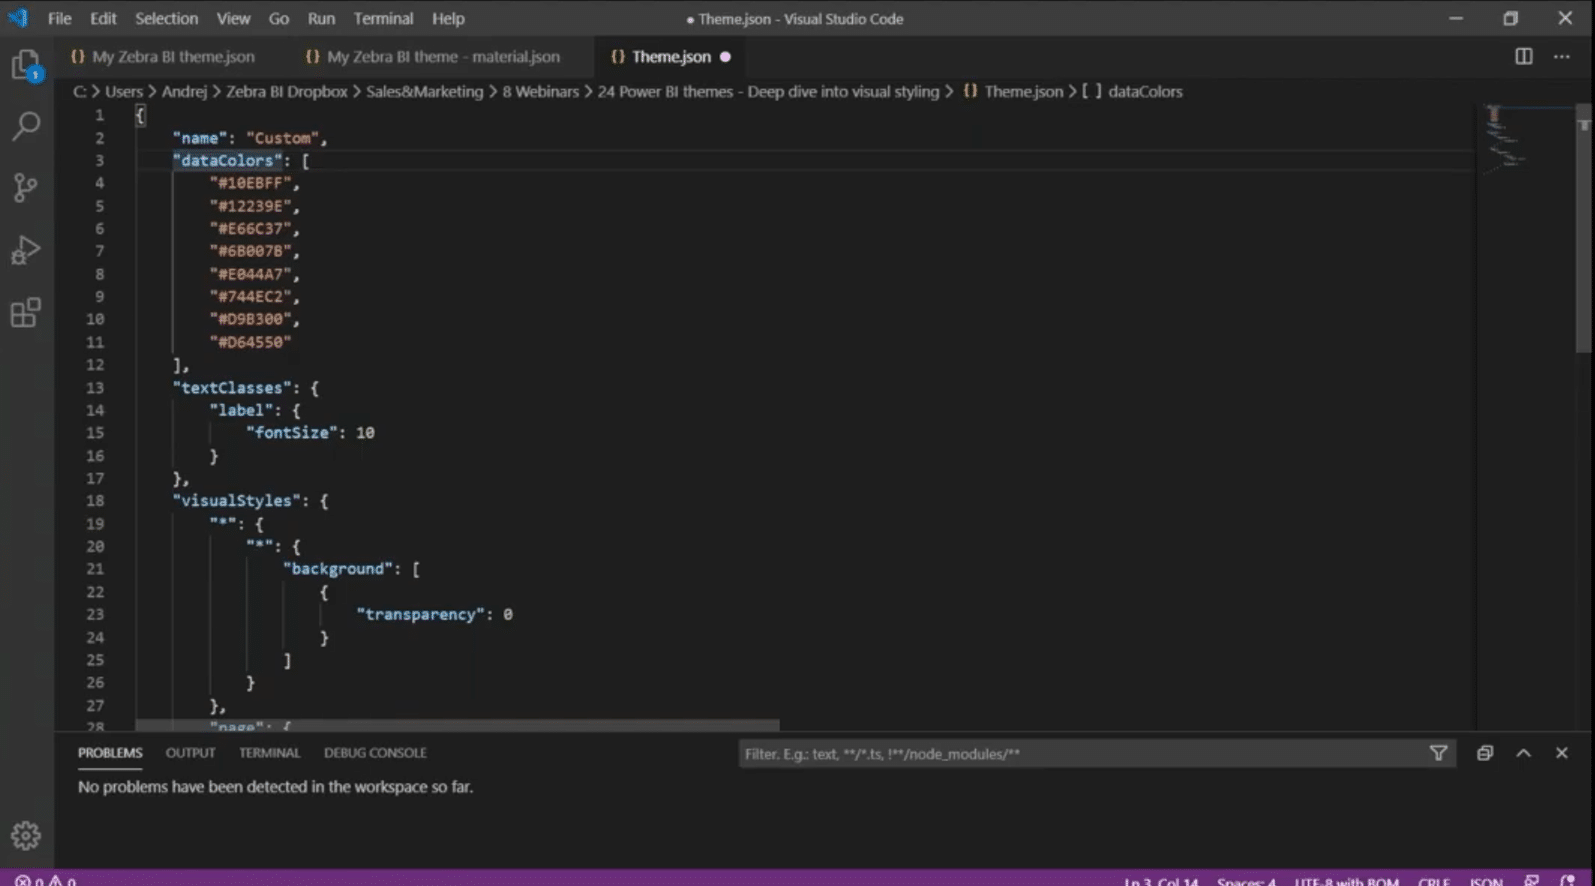
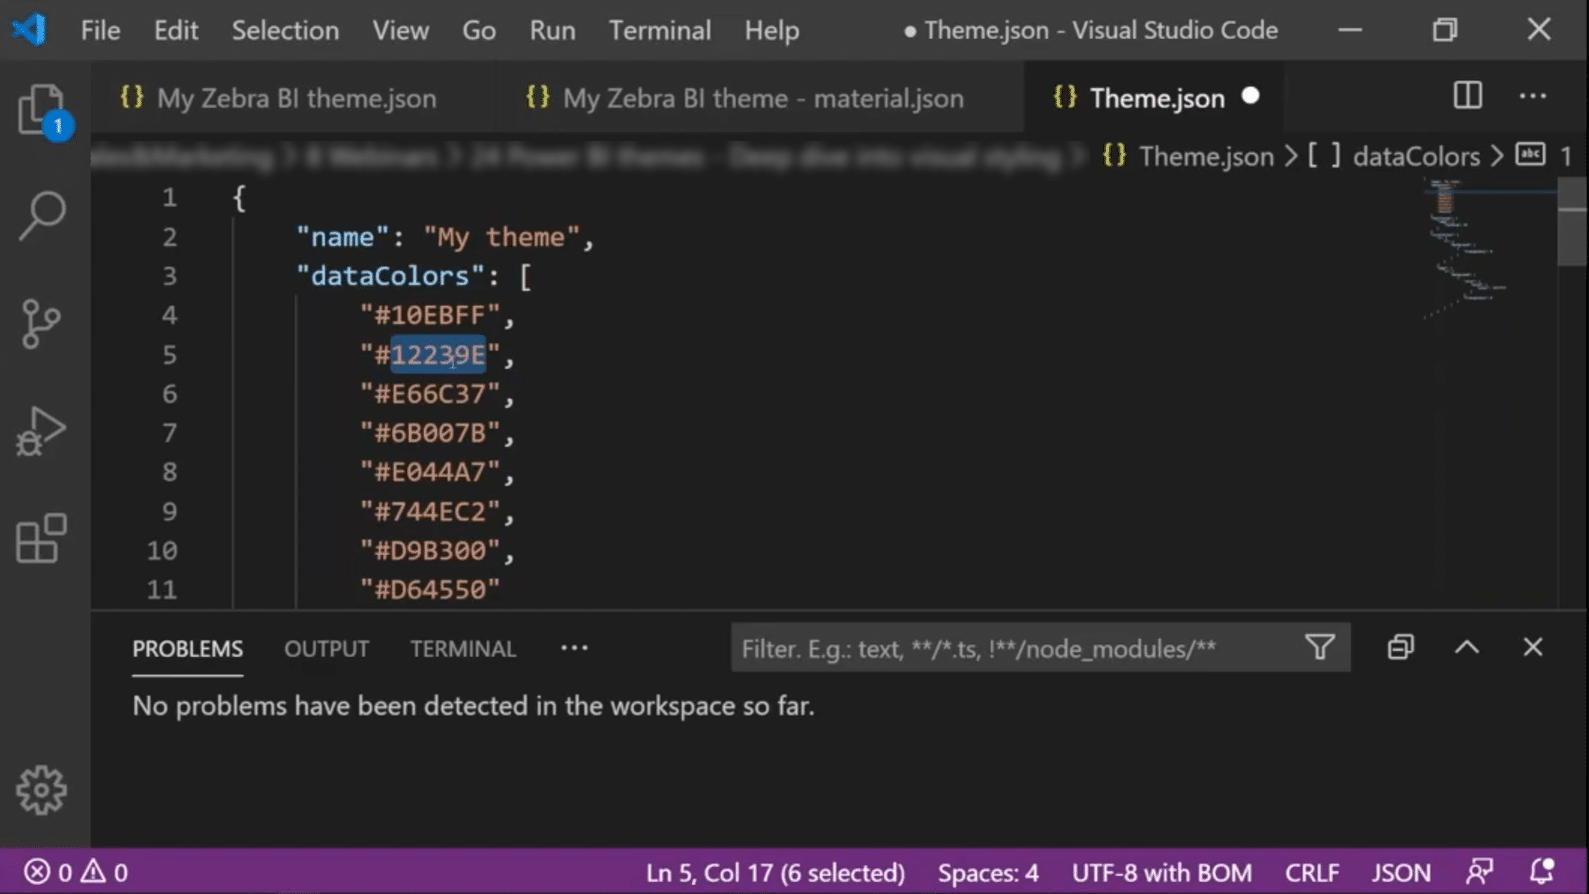
Once you open the JSON file of a Power BI theme, you can start editing individual properties. Within every theme, there should be the theme's name at the beginning. Then there are data colors, which is the basic color palette from Power BI. These names of properties are written within quotes, so you can identify them quickly.
Let's look at the color definitions under the property "dataColors".
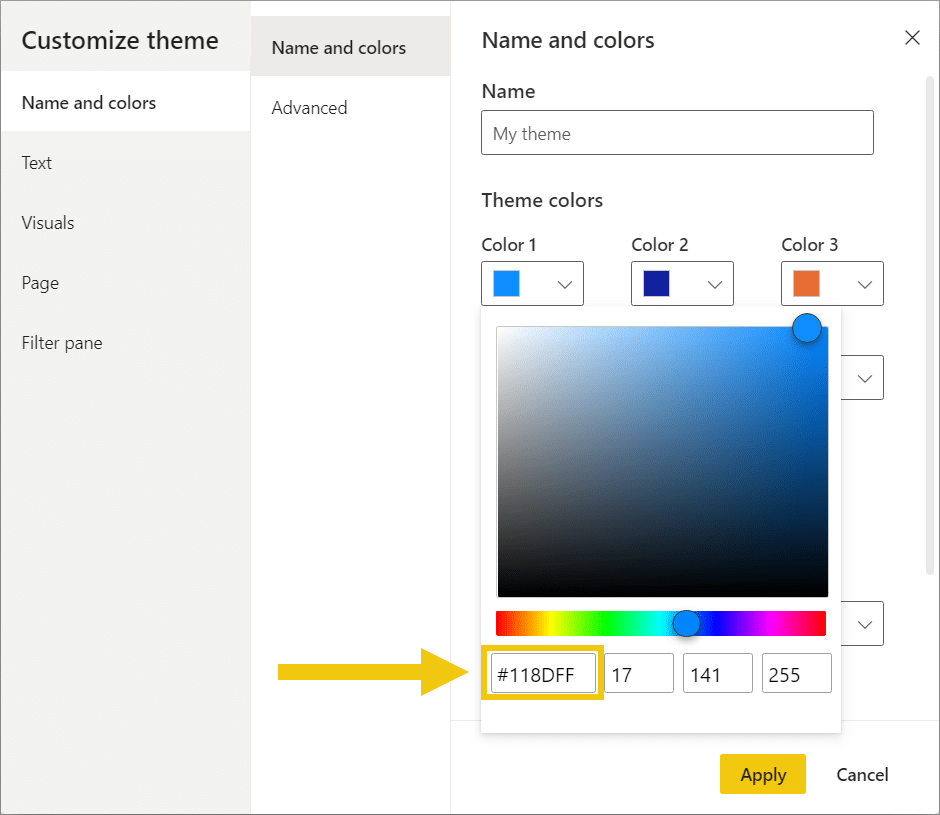
The colors in JSON are always in HEX format. You can obtain the HEX code in a picture editor tool (for example paint.NET) or you can even do it in Power BI. If you open a color picker in Power BI, there should be the code at the bottom, like in the example below. So, you can then copy it from there and paste it into your JSON file.
A basic Power BI theme that you might export directly from Power BI is very simple. Usually, it only contains any elements you have adjusted within Power BI. It does not have any elements related to the Zebra BI visuals included. To actually demonstrate the benefit of the JSON file, we've prepared a larger file with many settings and options. You can download it right here.
You will receive two different JSON files. Simply import them into the sample report to see which one you like better. You can use them as a basis and tweak them to set the properties however you like.
Visual Styles
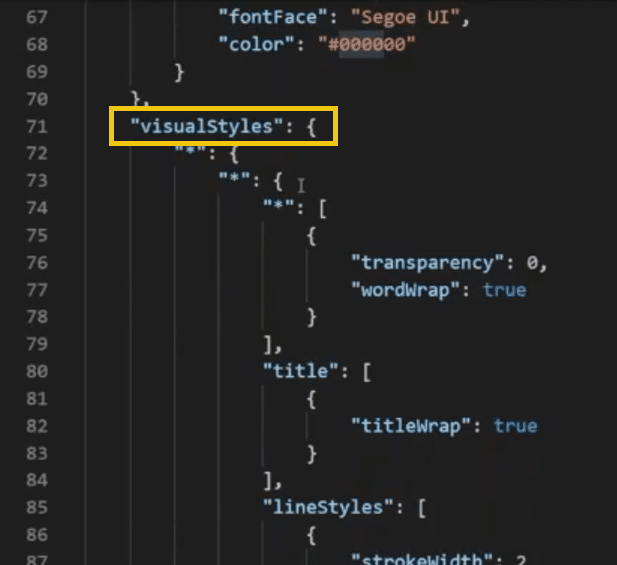
The more you'll be moving down along the JSON file, the more you'll get into the details of the Power BI theme. After you scroll past the basic properties of the theme, like colors and fonts, you will come upon a part marked as "visualStyles". Here you'll be able to set the properties of all the visuals at once. For example, you can set whether the text wraps itself if it's too long.
Here the setting "titleWrap" is set to true, which means that if you have a title in your visual and the text is very long, the text will be wrapped. If you don't want that to happen, you can simply set it to false. Below you see how you change the values.
You can also set lineStyles which determines how thick the lines in shapes and other elements in Power BI are. In this case, it's going to be two pixels.
Use an image as the background
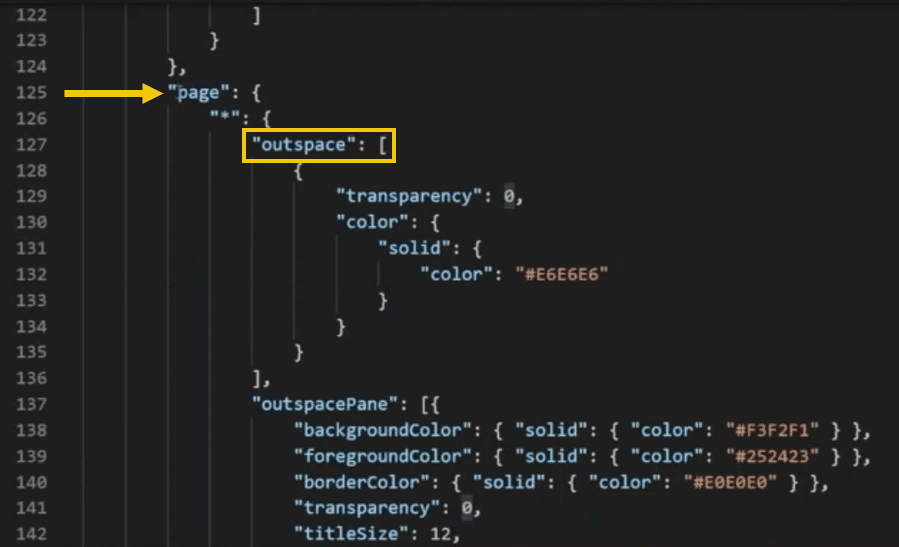
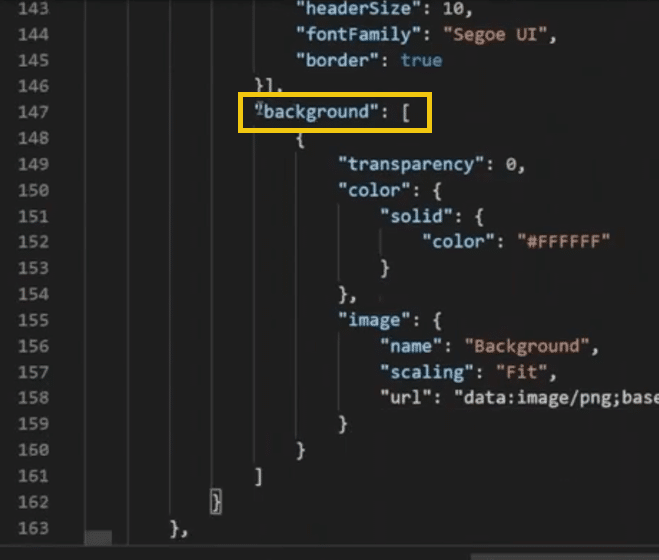
This brings us to our first trick. Just like in Power BI, the page settings in the JSON file also consist of two main elements: The "outspace" (wallpaper) and the "background".
The outspace or the wallpaper is set to grey with the following value:"color": "#E6E6E6"
However, the background is set to white but the trick here is that the image is added as the background. This particular image already has some design elements incorporated into it (color, logo, line element).
This information is also visible within the Customize theme window in Power BI.
This means that instead of the solid white color, the imported image will be used as the background. Because this setting is the default, it will also apply whenever we create a new page in our report.
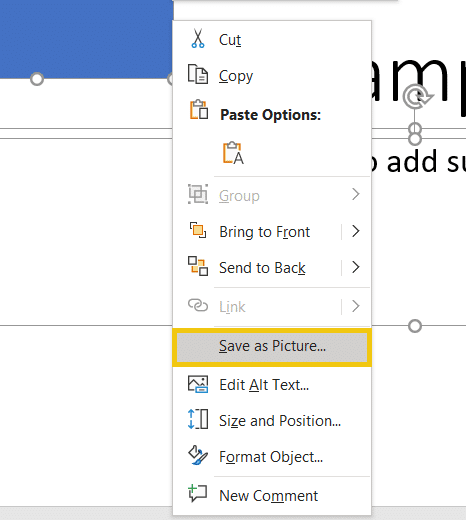
So how do you put an image into your Power BI theme to get it into Power BI? One of the simplest ways is to design your background as a slide in PowerPoint. You can insert your logo, shapes of different colors, text, and other elements. Then, you select all the elements on the slide, right-click, and select Save as Picture and then save it as a PNG file.
The PowerPoint and image file which were used in the sample report can also be downloaded as part of the file package of this article.
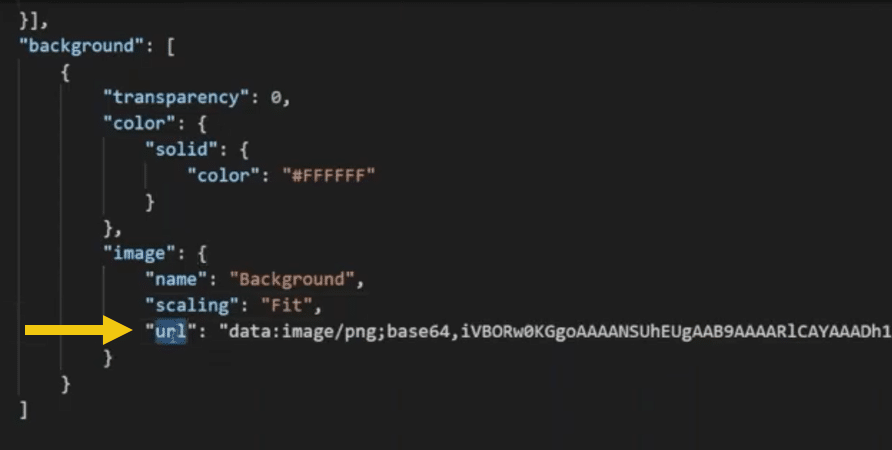
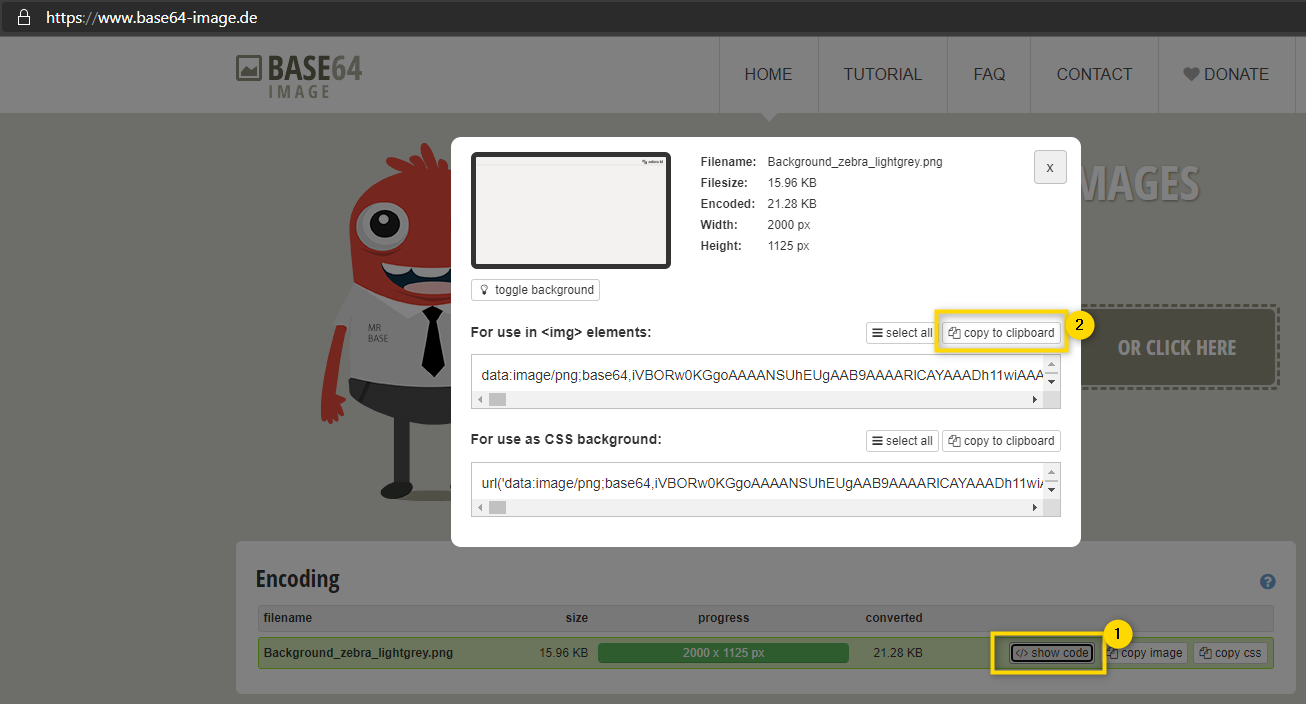
Now, how do you insert this image into the JSON file? For this, the most crucial part is the URL you insert into the JSON file. This is an unusual string that you need to produce and then copy into the file. The string is in the so-called Base-64 coding.
There are many tools that will allow you to produce this string. We will use the one called base64-image.de. Once you load your image into the tool, it will convert it into the Base-64 format. Click the show code button, and then copy the code to your clipboard, go back into your JSON file and simply paste it in between double quotes behind the URL.
We recommend you not to overdo with customization when it comes to backgrounds. Make sure that you keep it very functional and minimalistic - use logotypes and don't add very decorative images or shapes.
Create a round border
Another small detail that can add a lot of style to your report is to simply curve the borders of your visual.
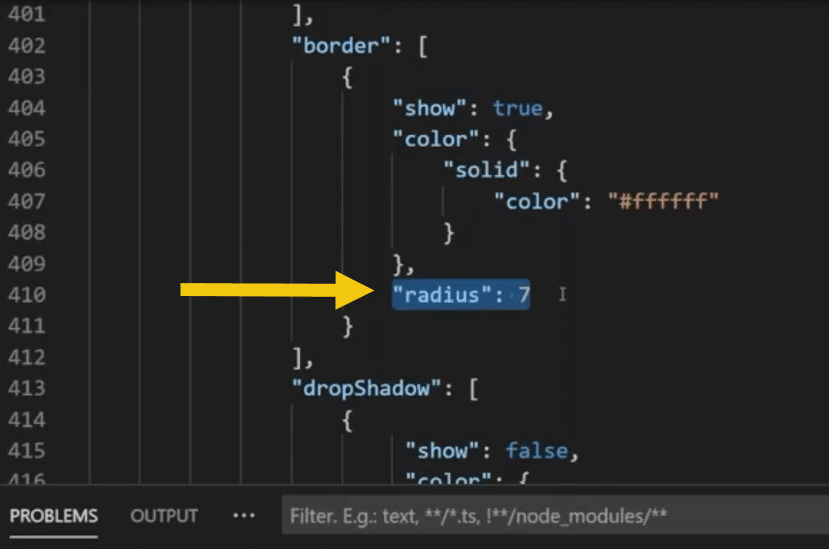
How do you do that? Within your JSON file, there is a reference code for every type of visual, and within this visual, you should find the properties of the "border". You can find it by looking for the code for the visual you want to modify and then follow down the individual properties until you find the one you want to change.
When you find it, there should be basic properties like color and whether the border is actually shown. What interests us now though, is the setting called "radius".
Adding a radius to your visual will enable you to curve the border of the visual to whatever degree you want. Once more, we suggest you don't go overboard and keep it functional.
Add shadows
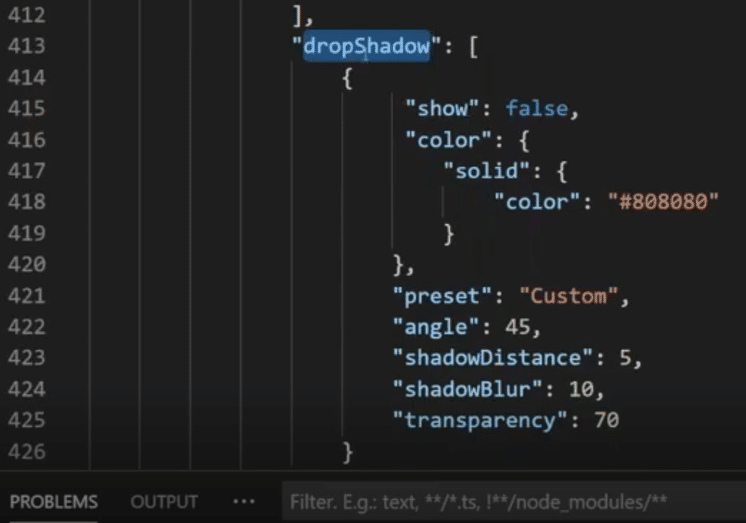
If you wish to avoid flat design and add some shading to your visuals, you should try the "dropShadow" setting.
Like before, there are actually multiple ways to adapt the shadows to fit your preferred design, like if you want to enable the shadows, change "false" to "true" next to the "show" setting. There is also the color of the shadow, which is gray in our case above. And then, there are other options (exactly how strong is this shadow, its size, etc.). This will work for every visual that you set this property for.
Enable Top N by default
If you find yourself using a certain option very often but it is not enabled by default, Power BI themes are the right tool to fix that. We will show you an example of that by enabling the Top N feature for the small multiples in Zebra BI Charts visuals and setting up a specific number of charts we would like to display.
Just to refresh your memory - the Top N feature means that you set the highest number of charts shown in a small multiple view. For example, if you have 15 business units, displaying them all will look crowded. Instead you can just display the top 5, while the rest will be shown under the "Other" category.
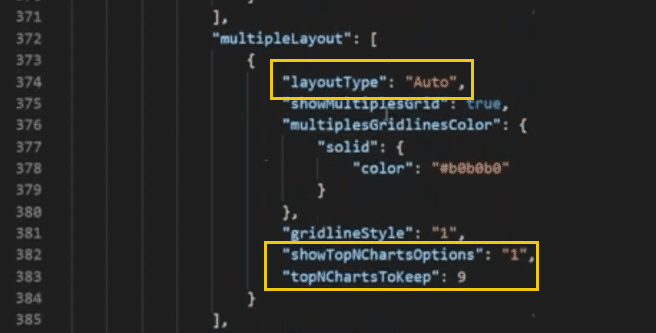
Let's return to the JSON file:
When we find the spot where we control small multiples, we will set layout type to Auto and set Top N charts to 1. In this case, the number represent that this setting will be invoked/enabled (similar to the "true" value we used before). On the line below (topNChartsToKeep), we define how many elements we actually want to show in the Top N, in this case, it is 9.
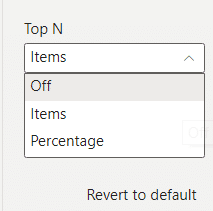
Looking back, how this would look in Power BI, the default setting for the Top N function is off and has designated number 0. The second option is Items (1), which is what we want. The third option is Percentage and has a designated number 2.
Afterwards, remember to save the file and import it into your Power BI.
Another example is if you find yourself regularly manually enabling grand totals in Zebra BI charts. You can set this in the JSON file as well and show the grand total by default. Keep in mind that the theme will apply its default settings for the particular visual until you manually override them in Power BI (or use a new theme).
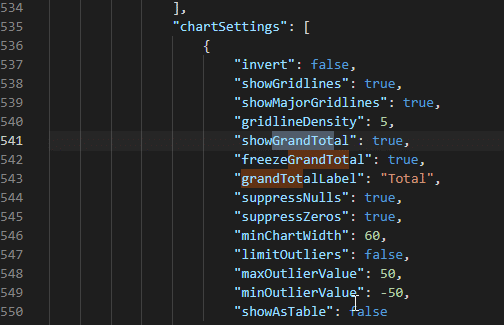
Return to your JSON file and find the chartSettings line. Here, you can set up your grand total settings by setting your "showGrandTotal" value to "true".
Hopefully, this will give you new ideas on how to use the styles for your reporting - to tweak, to bring in your corporate design, to change the default settings of your elements in your Power BI.
We understand that working with JSON files is not everyone's cup of tea but we would like you to understand that you can change the default design and behavior of figuratively every element in Power BI.
Power BI themes are your most powerful design tool
Power BI themes give you an easy way to design and enforce visual styles and rules across your reports. They can even be used across your entire organization. You should invest into themes to avoid wasting time on recreating the same design for every report. Trust us, it's worth it.
You can even dive into JSON files for even more fine-grained access to design. While JSON is slightly more complicated than the theme editer built into Power BI, it gives you more control. You can adjust every single element in your visuals and then apply it to all your visuals. We have prepared everything you need to start playing around and experimenting. Look below for download links.
Get theme JSON and follow-along PBIX example
If you'd like to try any of these tricks yourself, enter your data below to get immediate access to the full 1-hour video recording of the webinar and all JSON themes and PBIX examples used in the this tutorial.
 September 8th
 February 22nd